


Bitcoin trades at $84,275 on October 1, 2026, up +0.84% on the current daily candle, following a period high of $90,593 and a low of $57,759. Over the past three weeks, the tape has been punishing, sliding from $87,385 to $82,500 between September 21 and 28, then attempting to stabilize between $83,600 and $84,400. The current setup pairs an intact medium-term structure, sitting above the 20-, 50- and 200-period SMAs (Simple Moving Averages) with the SMA50/SMA200 bullish crossover (“golden cross”, an upward crossover of the 50-period and 200-period moving averages) dating back 23 candles, against short-term momentum that is clearly fading.
The dominant catalyst of the week remains derivatives-driven. Deribit’s quarterly options expiry for BTC and ETH on September 25 released more than $14B of notional and helped shape the ongoing compression. AMBCrypto’s September 30 report flags that SUI funding rates (periodic fees exchanged between long and short positions) spiked alongside the token’s rally, a classic signal of crowded long positioning vulnerable to a squeeze (forced unwinding of leveraged positions through cascading liquidations). BTC open interest (aggregate notional of outstanding contracts) stands at $8.08B, up +4.31% over 24 hours but down –1.34% over seven days, and the top-trader long/short ratio sits at 2.062: the market remains asymmetrically long, exposing price to a downside liquidity sweep. Kalshi meanwhile ended its volume incentive program a year early, raising concerns about the integrity of crypto perp volumes per CryptoSlate.
On the macro side, the September 30 data salvo supported risk assets. US core PCE (Personal Consumption Expenditures price index excluding food and energy, the Fed’s preferred inflation gauge) for August printed at +0.2% m/m versus +0.3% consensus, with the year-over-year rate at +3%, a configuration favorable to gradual Fed easing according to Bitcoin Magazine. Final Q2 GDP surprised at +2.2% (consensus +1.5%) and personal income at +0.2% (consensus +0.4%). On the other side, Conference Board confidence collapsed to 81.9 (consensus 89.2) and JOLTS job openings to 7.079M (consensus 7.23M), pointing to a latent slowdown. US Treasury yields stay under pressure with the 10-year above 5.3% and the 30-year above 5.6%, levels last seen in 2007 and 2002 per CNBC. On the flow side, Decrypt confirms a ninth consecutive day of positive net inflows into Bitcoin ETFs ($66.19M on 09/29), bringing the cumulative total to $3.08B since 09/17, nearly matching the August record. TD Cowen now describes Bitcoin as financial infrastructure rather than a mere investment asset.
This cocktail calls for a cautious technical read: the daily structure is still bullish, but fading momentum, the confirmed H4 double top, and an excessively long derivatives posture argue for working the levels rather than chasing the move.
Multi-Timeframe Technical Analysis
Daily Timeframe (1D): Post-Correction Recovery Under the SMA20
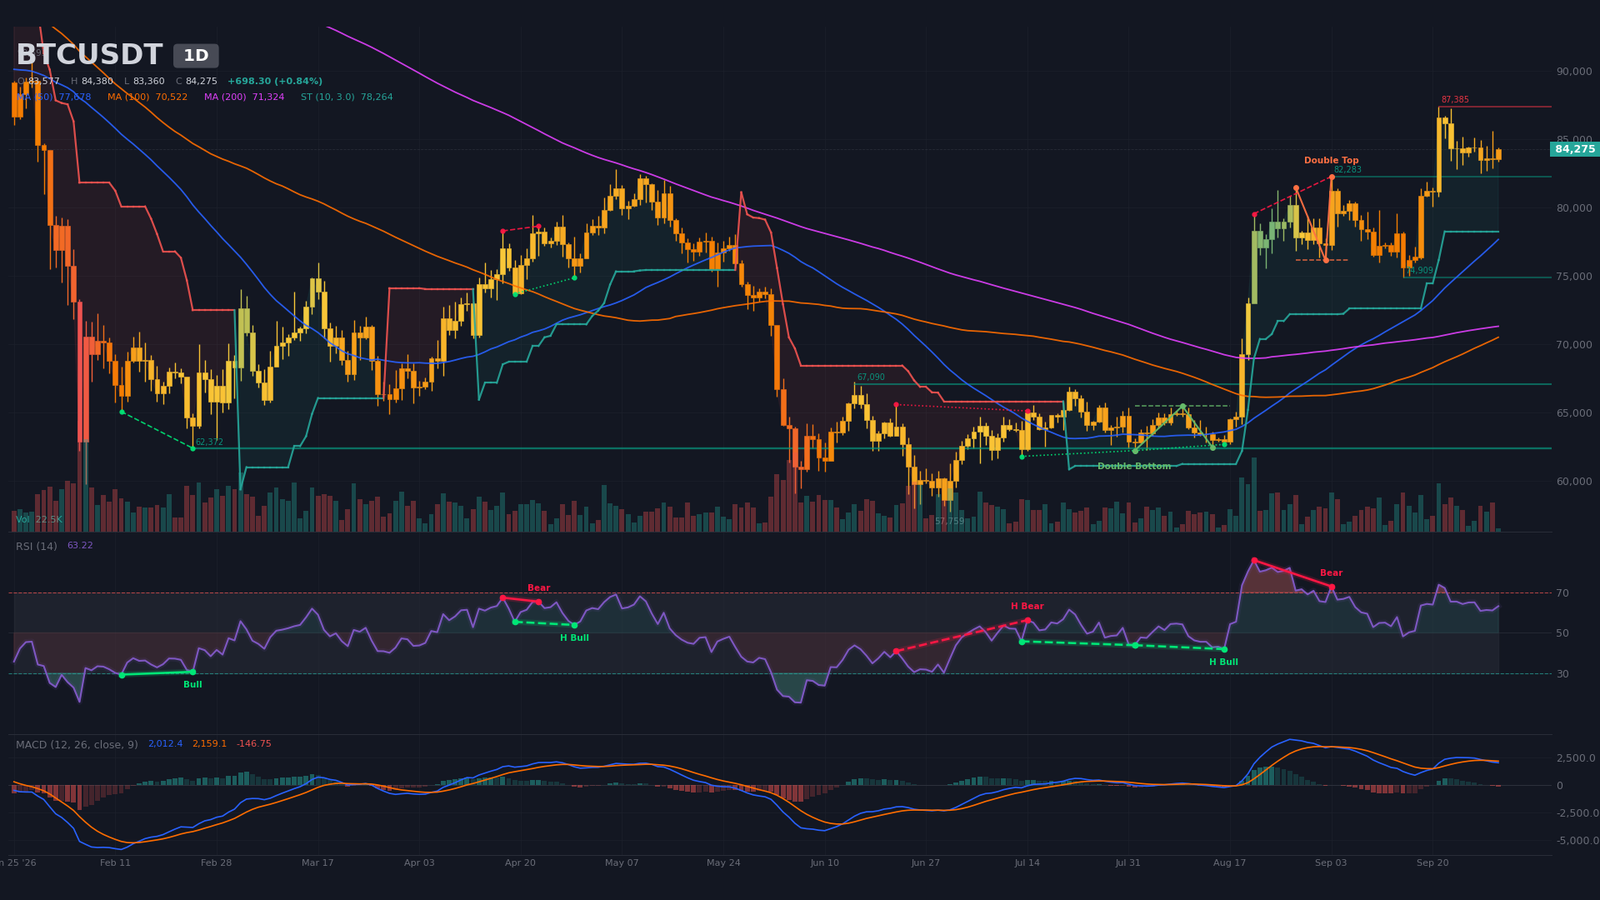
Bitcoin is in a post-correction recovery phase on the daily chart. After peaking at $87,385 on September 21 and pulling back to $82,500 on September 28, the current candle (October 1, still forming) is testing the $83,600–$84,400 zone. Price trades above the SMA20 ($81,644), SMA50 ($77,678) and SMA200 ($71,324), with the SMA50/SMA200 bullish crossover logged on September 8, an intact medium-term structural signal.
RSI14 at ~63 remains below the August mid-month highs (80), validating the regular bearish divergence flagged by the algorithm between August 21 ($79,555, RSI 86) and September 3 ($82,283, RSI 73). A regular bearish divergence forms when prices print a higher high while the momentum oscillator prints a lower high: it flags a loss of upside thrust without breaking it. The MACD (Moving Average Convergence Divergence, a momentum indicator based on the convergence-divergence of two exponential moving averages) is still above zero but flipped bearish on September 29 (two candles ago), with a negative histogram at –147: the momentum impulse is turning over without invalidating the trend.
Structures detected on the daily remain mixed: a confirmed bearish double top (neckline at $76,152, target $70,412) and a confirmed bullish double bottom (neckline at $65,483, target $68,609) are fully resolved and now historical. Resistance at $87,385 (1 contact) caps the range, while key supports at $82,283 (1 contact), $74,909 (1 contact) and $67,090 (2 contacts) form the downside skeleton if price fails. Today’s volume (22,518) is only 15.5% of the 20-period average, an absence of buying pressure that fits the compression phase.
Intermediate Dynamics (4H): Confirmed Double Top and Bearish Compression
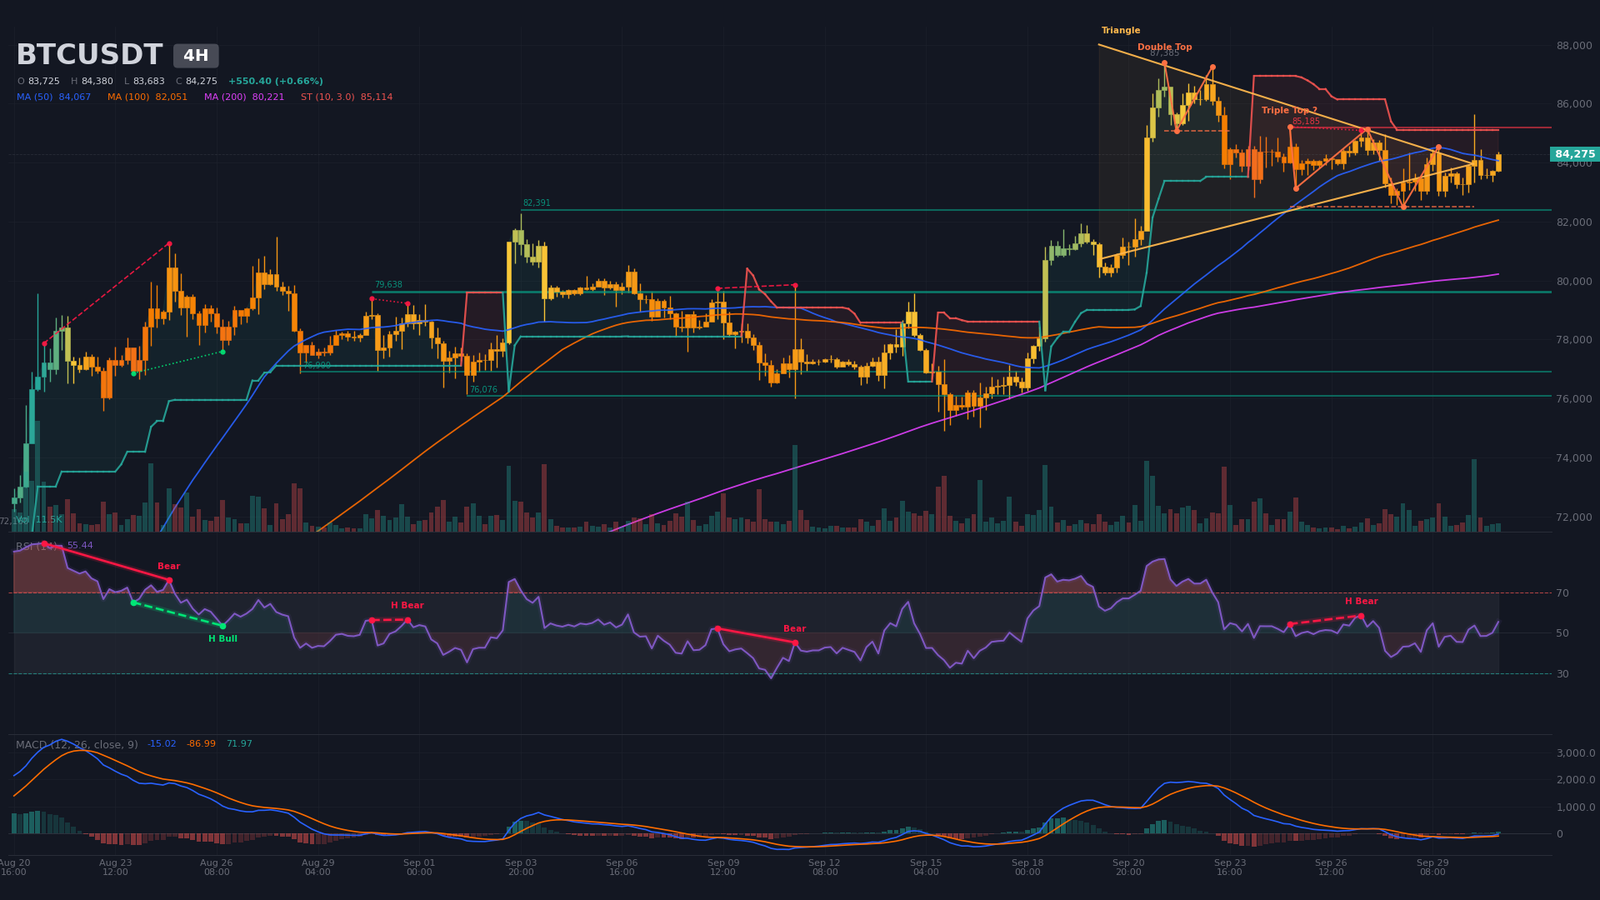
The 4-hour chart prints a confirmed bearish double top (top 1 at $87,385 on 09/21, top 2 at $85,633 on 09/30, neckline at $85,080, downside target $82,843). An unconfirmed triple top (neckline at $82,500, target $80,025) remains on watch. Price compresses inside a symmetrical triangle (upper bound $84,334, lower bound $83,659) whose apex (the convergence point of both bounds) was projected for 09/30 at 08:00; price has broken out to the upside.
The 4H SuperTrend (a trend-following indicator based on ATR) at $85,633 is bearish and sits above price: the market remains capped by dynamic resistance. RSI at ~55 is neutral, without directional momentum. The 4H MACD has crossed back to bullish five candles ago, with a positive histogram at +72, but still below the zero line, a nascent bullish momentum divergence without structural recovery. Key 4H levels are resistance at $85,185 (2 contacts) and supports at $82,391 (2 contacts), $79,638 (4 contacts, major structural support), $76,900 and $76,076. ATR14 (Average True Range over 14 periods, a measure of average volatility) at $859 (1.02% of price) signals moderate volatility. The latest candle’s volume (11,474), at 48% of the 20-period average, indicates thin flows.
Intraday Structure (15m): Rising Wedge Breakout
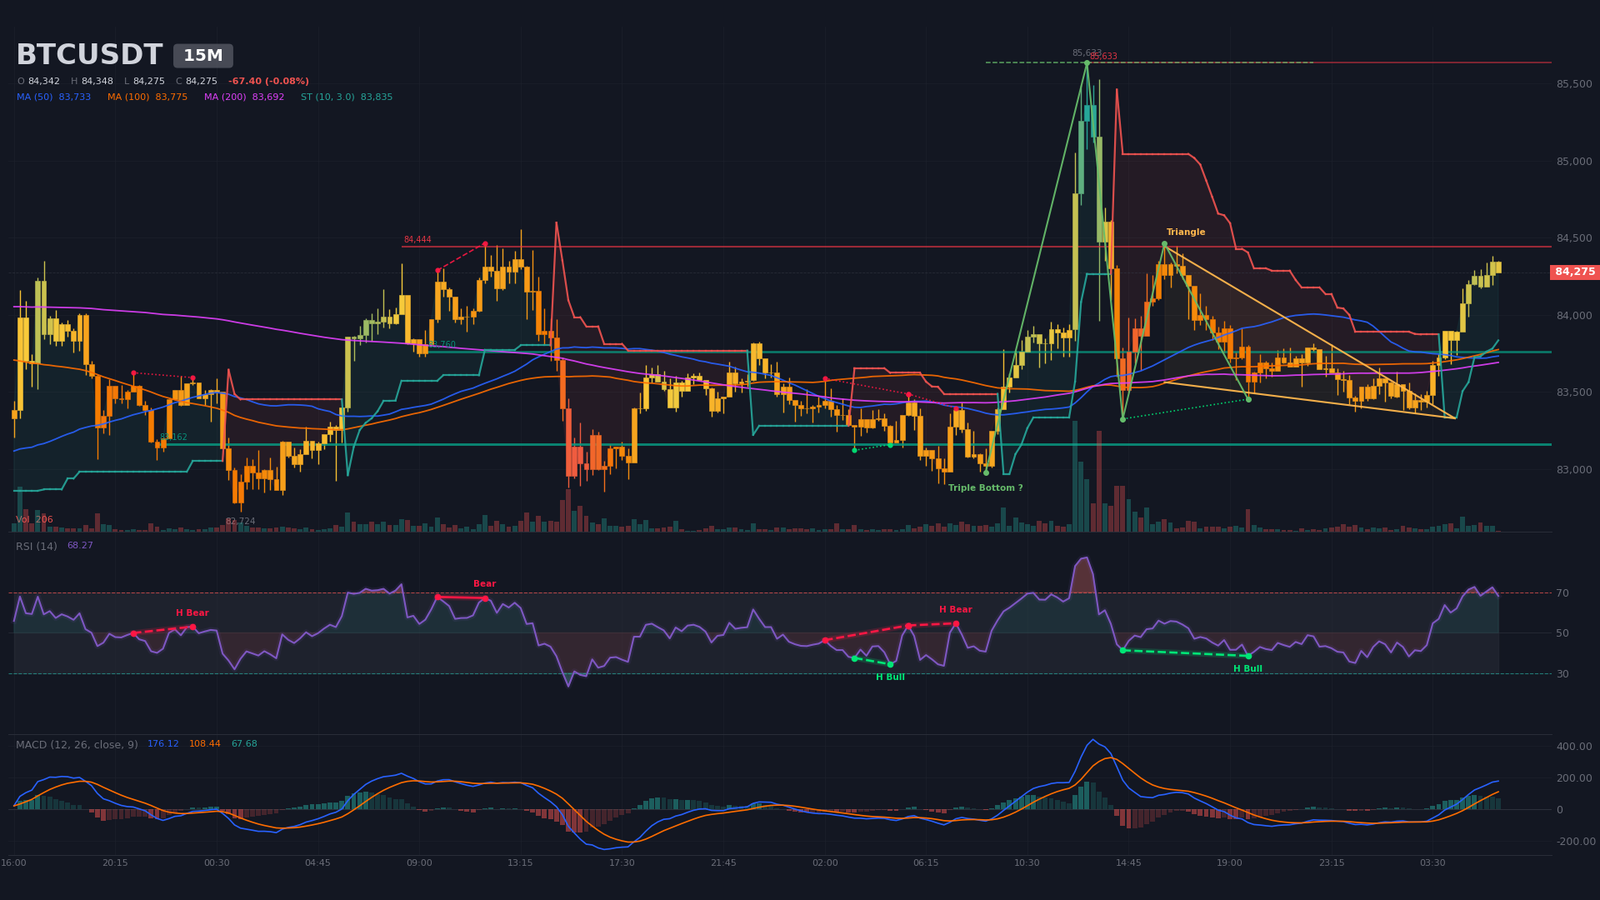
On the 15-minute chart, BTC trades inside a rising wedge breakout structure (a bullish chart pattern of contracting oscillations, bounds at $83,483 and $83,362, apex on 10/01 at 04:15), supported by an unconfirmed bullish triple bottom (neckline at $85,633, target $88,012). The 15m SuperTrend is bullish at $83,835; price has cleared it to the upside.
RSI14 at ~68 (neutral, slightly bullish) reflects the intraday bounce. The MACD is above zero with a bullish crossover logged on October 1 at 01:15 (20 candles ago), an expanding histogram at +68. A hidden bullish divergence was detected between 09/30 at 14:30 ($83,325, RSI 41) and 19:45 ($83,454, RSI 39), a continuation signal for the very short-term uptrend. Price oscillates between resistance at $84,444 (2 contacts) and support at $83,760 (4 contacts), with a major buy wall at $83,162 (10 contacts, –1.32% from price), a true bearish magnet on a break. 15m ATR14 at $162 (0.19%) signals an imminent price expansion.
Multi-Timeframe Synthesis
| Timeframe | Dominant trend | RSI (14) | MACD | Chart pattern |
|---|---|---|---|---|
| Daily (1D) | Bullish (consolidation below $87,400) | ~63 | Recent bearish cross (2 candles) | Post-correction recovery |
| 4 hours (4H) | Neutral-bearish (compression) | ~55 | Bullish cross below zero (5 candles) | Confirmed double top + triangle |
| 15 minutes | Bullish (short term) | ~68 | Bullish cross (20 candles) | Wedge breakout |
Mapping Technical Levels and Pivots
The methodology mixes daily and H4 classic pivots, order book liquidity concentrations, estimated liquidation zones, and swing highs/lows (turning-point highs and lows) detected over 250 candles. The short-term central pivot sits at $84,000 (Daily pivot and axis of the 4H range) and acts as a magnet as long as the compression remains unresolved.
| Level | Price (USD) | Category | Technical basis |
|---|---|---|---|
| R3 | $90,400 – $90,600 | Major resistance 3 | Period high over 250 candles ($90,593) |
| R2 | $87,000 – $87,400 | Major resistance 2 | Swing high 09/21 at $87,385 + daily resistance $87,385 (1 contact) |
| R1 | $85,100 – $85,400 | Immediate resistance | Daily R1 zone ($85,173) + 4H triangle upper bound ($85,185, 2 contacts) + 4H bearish SuperTrend ($85,633) |
| P | $84,000 – $84,300 | Central pivot | Daily pivot $84,037, current equilibrium zone |
| S1 | $83,400 – $83,700 | Immediate support | Buy wall $83,443 ($2.43M) + 15m SMA200 ($83,692) |
| S2 | $82,300 – $82,500 | Major support 2 | Daily support $82,283 + 4H support $82,391 (2 contacts) + 4H double top neckline ($82,500) |
| S3 | $79,500 – $79,800 | Major support 3 | 4H support $79,638 (4 contacts) + estimated liquidation pocket $80,750–$81,142 ($90.4M) |
Order Book and Liquidity Heatmap
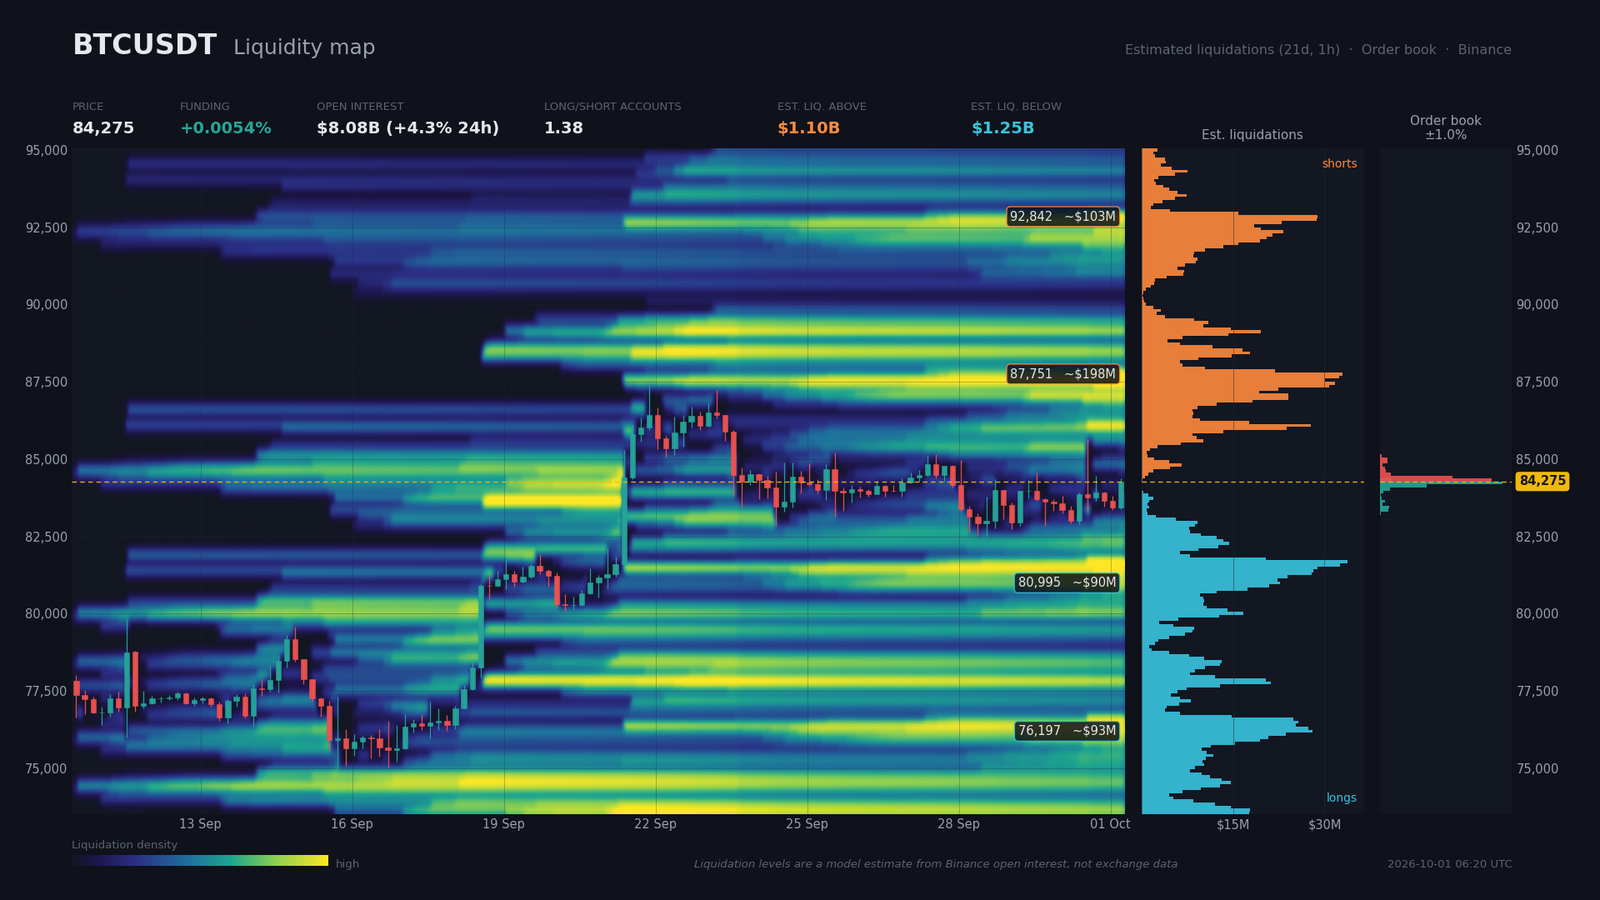
The aggregated Binance spot+perp order book shows 100% coverage within ±2% with an imbalance of –0.7% (slightly more asks than bids, $60.82M versus $59.95M). The main buy wall sits at $84,226 ($33.59M), immediately followed by $84,128 ($12.68M), a concentration just under price, signaling absorption on the bid side. On the ask side, the densest wall is at $84,324 ($30.59M), followed by $84,422 ($19.78M), almost the same price as the buy walls, a textbook tight market-making setup and a region of indecision.
Perp funding stands at 0.0054% (annualized 5.9%), slightly positive: longs pay shorts. Open interest at $8.08B is up +4.31% over 24 hours but down –1.34% over seven days. The top-trader long/short ratio at 2.062 is asymmetrically long, a warning sign: a downside sweep would trigger cascading liquidations. The 24h taker buy/sell at 1.012 is neutral.
Estimated liquidation zones (model output, to be treated as an estimate rather than a measured fact) print a clear asymmetry. Above, $1.10B are stacked across three pockets, the densest at $87,310–$87,898 (peak at $87,751, $197.9M, +4.12%), followed by $92,598–$92,891 ($103.1M, +10.17%) and $86,821–$87,114 ($77.1M, +3.31%). Below, $1.25B across three pockets, the densest at $76,148–$76,442 (peak at $76,197, $93M, –9.59%), followed by $80,750–$81,142 ($90.4M, –3.89%) and $81,631–$81,729 ($66.9M, –3.08%). The asymmetry is clear: more leverage to clear on a downside move. The risk of a liquidity sweep (a price move engineered to trigger stop-loss or liquidation clusters before reversing) is more likely to the downside before any bullish expansion.
Calendar: Catalysts to Watch
The macro calendar over the next ten days contains one catalyst with very high directional volatility potential: the October 2 NFP (Non-Farm Payrolls, US payrolls created outside the farming sector) report, expected at 90k versus 162k previously, a massive consensus miss. A print far from consensus forces an immediate reaction from rates and the dollar. The FOMC (Federal Open Market Committee, the Fed’s policy-setting body) Minutes on October 7 follow and will clarify the central bank’s tone.
- Thursday, October 1, 14:30 (Zurich) — US Initial Jobless Claims (consensus 200k / previous 197k): first read on labor market health before the NFP.
- Thursday, October 1, 16:00 (Zurich) — US ISM Manufacturing (consensus 55 / previous 54.6): prices-paid and new-orders components in focus.
- Friday, October 2, 11:00 (Zurich) — EUR Core CPI Flash y/y (consensus 2.5% / previous 2.4%): ECB barometer ahead of the NFP.
- Friday, October 2, 14:30 (Zurich) — US NFP (consensus 90k / previous 162k): massive consensus miss, strong directional volatility potential.
- Wednesday, October 7, 20:00 (Zurich) — FOMC Minutes: tone of internal debates on the rate path, HIGH impact.
- Friday, October 9, 16:00 (Zurich) — University of Michigan Consumer Sentiment Prel (previous 48.1).
Three Scenarios for the Coming Weeks
Three setups compete for the coming weeks, at probabilities of 45%, 35% and 20% respectively. All revolve around a break of the $82,500–$85,200 range and the October 2 NFP as the directional tiebreaker.
Scenario A — Range Then Bullish Break on NFP Catalyst (probability 45%)
Trigger: an October 2 NFP below 90k confirming monetary easing. Path: current range, break above $85,185 (R1) → $87,000–$87,400 (R2) → extension to $88,000, with an intermediate target aligned with the 15m triple bottom. Execution zone: $83,600–$84,000 (buy-the-dip entries). Invalidation: H4 close below $82,391 (two contacts). Stop: $81,800 (≈ 1.2× 4H ATR = $1,030). R:R ≈ 2.1 toward $87,400.
Scenario B — Bearish Sweep Toward the $80,750–$81,142 Pocket (probability 35%)
Trigger: an NFP above 120k or an ISM Manufacturing print above 56 re-igniting yields. Path: break of $82,500 → $81,631 ($67M pocket) → $80,750–$81,142 ($90M pocket) → $79,638 (4H support with 4 contacts). Execution zone: $81,600–$81,800 (short retracement). Invalidation: 4H close above $83,760. Stop: $82,500 (≈ 1× 4H ATR). R:R ≈ 1.8 toward $79,638.
Scenario C — Daily Bearish Break Toward $74,900 (probability 20%)
Trigger: a geopolitical shock or hawkish FOMC Minutes on October 7. Path: loss of $82,283 support → $79,638 (4 contacts on 4H) → $74,909 (daily support with 1 contact). Daily invalidation: close above $87,385. Stop: $76,500 (≈ 1.1× daily ATR = $2,420). R:R ≈ 1.5.
Summary and Conclusion
The current phase pairs a structurally bullish daily trend (SMA50/200 golden cross, price above all SMAs) with momentum exhaustion flagged by the bearish RSI divergence between August 21 and September 3 and the bearish daily MACD cross on September 29. The 4H confirms caution via a confirmed double top and a bearish SuperTrend, while the 15m flags a very short-term bounce on a wedge breakout. ETF flows remain the structural backbone of the move ($3.08B in 12 days, Decrypt 2026-09-30); the asymmetrically long derivatives positioning (top-trader L/S at 2.06) is the main asymmetry risk.
This bitcoin technical analysis calls for dip-buying within the $82,400–$83,700 wall, with a stop below $82,000, and monitoring any push past $85,400 as a directional catalyst. Levels to keep in mind are $85,185 (1D resistance, 2 contacts, plus the 4H bearish SuperTrend), $84,037 (Daily pivot, range axis), $82,391 (4H support with 2 contacts, loss = bearish scenario) and $79,638 (major 4H support with 4 contacts, true bearish magnet). The October 2 NFP report will serve as the tiebreaker between A and B; the October 7 FOMC Minutes will set the monetary tempo through year-end.
Sources
- Bitcoin price jumps above $85,000 on lighter-than-expected inflation data — Bitcoin Magazine, 2026-09-30
- Bitcoin Surges 40% in Its Best Quarter Since Late 2024 — Bitcoin Magazine, 2026-09-30
- Bitcoin ETFs Extend Win Streak to 9 Days, Matching August Rally — Decrypt, 2026-09-30
- Bitcoin Is More Than Just an Asset, Says TD Cowen — Bitcoin Magazine, 2026-09-30
- Stock futures rise as traders eye elevated Treasury yields — CNBC, 2026-09-30
- Cramer says ‘frozen’ conditions are holding many stocks back — CNBC, 2026-09-30
- BPI Questions MSCI Rule Affecting Strategy, Metaplanet — Cointelegraph, 2026-10-01
- Robinhood’s Institutional Era Has Arrived — Bitcoin Magazine, 2026-10-01
- Kalshi’s $40 billion growth story hits tough questions about its trading volume — CryptoSlate, 2026-09-30
- SUI crypto hits 6B transaction blocks, but rising funding flashes a warning — AMBCrypto, 2026-09-30
- Standard Chartered sees Ethena’s USDe reaching $40B — Cointelegraph, 2026-09-30
- Cboe’s New S&P Deal Opens the Door to Tokenized Options — Decrypt, 2026-09-29
- Clarity Act’s failure gave crypto ‘faster’ regulatory wins — The Block, 2026-09-30
- Coinbase-Backed Crypto Group Reveals Midterm Endorsements — Decrypt, 2026-09-30
- Singapore crypto activity grows 55% as broader region contracts — Cointelegraph, 2026-09-30
- CFTC secures over $30 million judgment in fraud case — The Block, 2026-09-30
- Paramount’s mega debt sale reveals how higher bond yields are squeezing corporate America — MarketWatch, 2026-09-30
Disclaimer: This article is for educational and informational purposes only. It does not constitute investment advice, a recommendation to buy or sell, or an invitation to trade any financial asset. Cryptocurrency markets are extremely volatile; any investment decision should be based on your own research (DYOR) and, where appropriate, the advice of a licensed financial adviser.

