


Bitcoin trades around $85,290 on the BTCUSDT pair, down 2.4% from the analysis window high of $87,385 set on September 21, 2026. The underlying trend remains intact: price has gained close to 12% over the past twenty daily candles, but it is ceding ground on shorter horizons -1.0% across five 4-hour periods and -0.3% across five 15-minute periods. That split between a mature uptrend and an intraday momentum that is fading defines the current phase: a consolidation below major resistance, bracketed by a wedge whose apex is approaching. The overall bias stays neutral with a bullish undertone, conviction is moderate, and the confluence score reads 2 out of 5.
The immediate engine of the market remains derivatives. CoinDesk (October 2, 2026) documents that Bitcoin open interest jumped by $2.3 billion (around 27,000 BTC) between September 30 and October 2, while the perpetual contract funding rate climbed from roughly 3% to 10%, evidence of a clear bullish repositioning. Strive announced on October 5, 2026 (Decrypt) the purchase of 2,000 Bitcoin for approximately $169 million, its biggest acquisition in months, taking holdings to 29,462 BTC; the company’s average cost basis remains at $90,170 per coin, above spot. Our liquidity window confirms the lean: aggregated open interest stands at $8.09 billion, down 3.97% over 24 hours but up 4.32% over seven days, with a global long/short ratio of 1.083 and a top-trader ratio of 1.754 – both still long.
On the macro side, the week was dominated by the NFP surprise on Friday October 2: only 29,000 nonfarm payrolls versus 90,000 consensus, after 133,000 the prior month, with unemployment at 4.2%. That weakness revived the easing thesis, but Reuters (October 1, 2026) reports the dollar hit a two-month high, supported by long-end US yields. Core PCE m/m, released September 30 at 3.4% versus 3.7% consensus, offered marginal support for risk assets, while eurozone flash YoY inflation at 3.8% on Friday October 2 versus 3.6% consensus delivered a hawkish surprise for the ECB. On the regulatory front, the SEC published on October 1 a proposed framework for crypto custody aimed at investment advisers, allowing direct custody and the use of state trust companies, while Coinbase secured CFTC approval to set up its own clearinghouse (Bitcoin Magazine, October 5). The OCC is separately facing an ICBA lawsuit over crypto bank charters (Cointelegraph, October 6).
Bitcoin is thus consolidating inside a wedge below major resistance, and the next macro catalyst – FOMC minutes on Wednesday October 7 at 8:00 pm – will determine whether this is a continuation pause or a true reversal. The technical read that follows moves from the most structural timeframe down to the most tactical one, weaving in derivatives flows and the liquidity map.
Multi-Timeframe Technical Analysis
Daily Timeframe (1D): mature uptrend consolidating under resistance
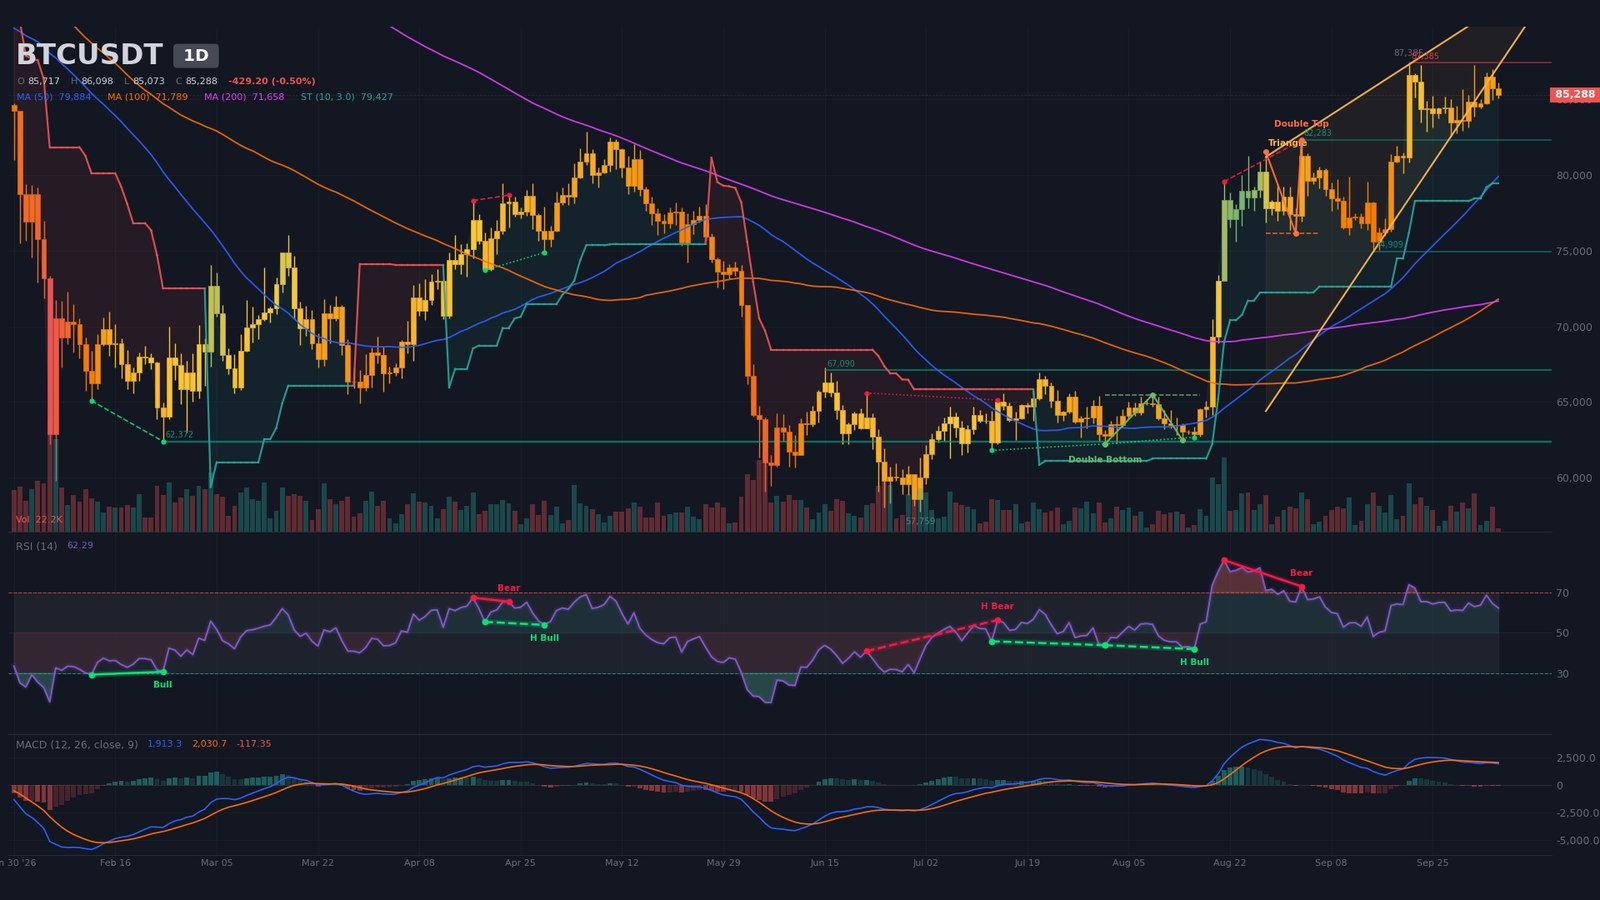
On the daily chart, Bitcoin trades above all three moving averages: SMA20 at $83,807, SMA50 at $79,885, and SMA200 at $71,658. The SMA50/SMA200 golden cross occurred on September 8, 2026, twenty-eight candles ago – recent and structurally meaningful. Price has advanced roughly 12% over twenty candles but is down 0.5% on the current provisional candle. RSI14 sits at ~62 (neutral), easing back from the 68.6 peak hit eight sessions ago. The MACD, still above zero, crossed below its signal line on September 29, 2026; the negative histogram is slowly extending, signaling a loss of momentum without a confirmed reversal.
The detector flags a confirmed bearish double top with neckline at $76,152 and downside target at $70,412, last pivot on September 3, 2026, alongside a wedge spanning August 28 – September 28 with an apex projected for October 17, 2026 (bounds $89,057 / $82,500). A regular bearish divergence sits between August 21 (price $79,555, RSI 86) and September 3 (price $82,283, RSI 73). The daily SuperTrend stays bullish at $79,427, about 7% below spot, the structural protection level.
Volume on the current candle is only 15.7% of the 20-session average – a classic digestion signal after the September 21 impulse, whose candle printed 290,706 against a 141,408 average. The dominant daily structure remains bullish, but price must defend the central pivot at $85,868 to keep open the option of a fresh push toward the wedge upper bound.
Intermediate Dynamics (4H): compression inside a descending wedge under resistance
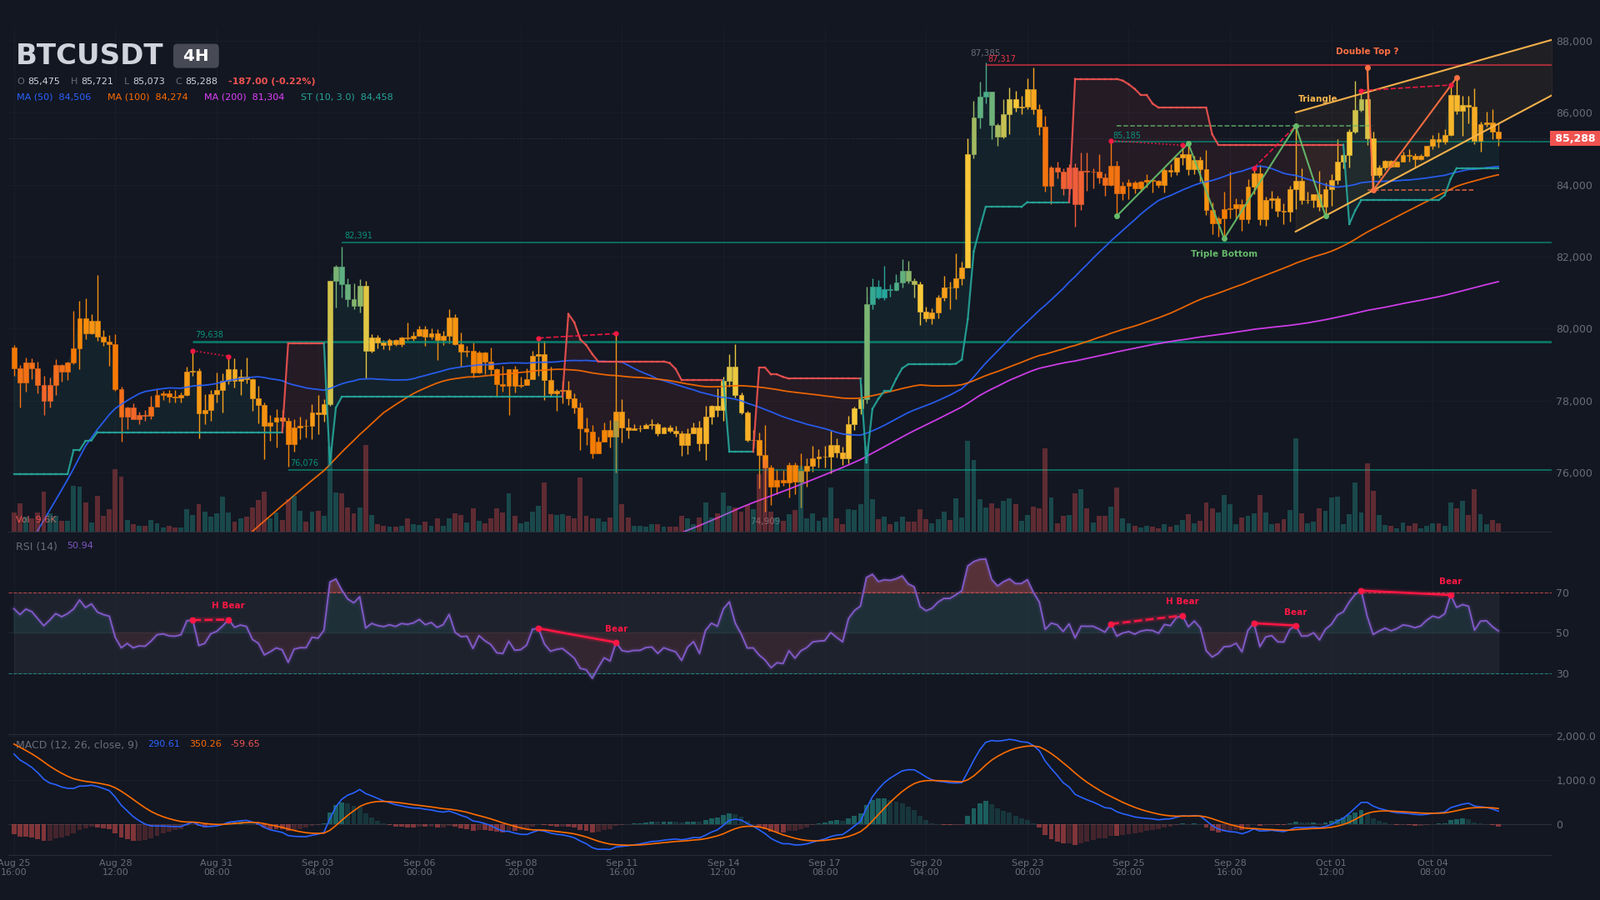
On the 4-hour chart, price at $85,288 has just slipped under the SMA20 at $85,309 but holds above the SMA50 at $84,506 and the SMA200 at $81,304. RSI14 reads ~51, sharply off the 68.7 peak hit three candles ago. The MACD, still positive with a negative histogram, crossed below its signal line just one candle ago (October 6, 04:00), a near-term warning signal. Volume on the current candle runs at 65% of the average.
The detector identifies a wedge with an apex at October 13, 2026 21:42 (bounds $87,277 / $85,076), framing the current zone tightly. A bullish triple bottom is confirmed with neckline at $85,633 and target $88,343; an unconfirmed bearish double top shows neckline at $83,842 and target $80,571. Three bearish RSI divergences are active (regular on October 2-4 and September 29-30, hidden on September 25-27), urging caution on the long side. The 4-hour SuperTrend stays bullish at $84,458, the intermediate protection. The dominant structure is a compression under resistance with a wedge apex approaching fast.
Intraday Structure (15m): bearish break and intraday apex
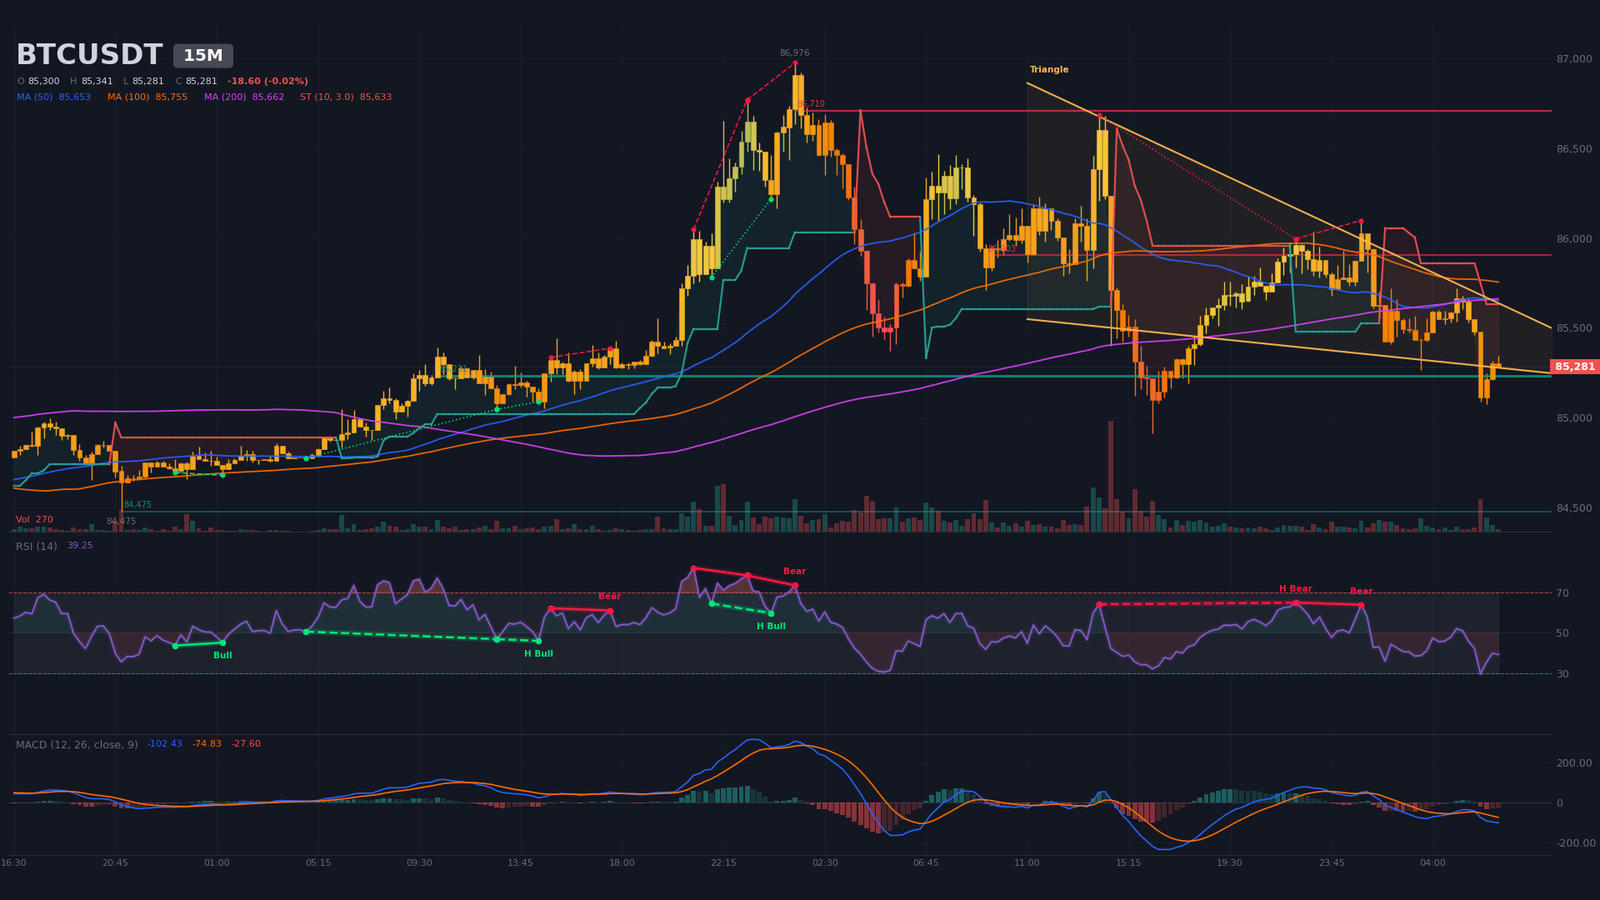
On the 15-minute chart, the break is clear: price at $85,281 sits below all three SMAs (20 at $85,469, 50 at $85,653, 200 at $85,661), with a bearish SMA50/SMA200 cross logged at 06:30 on October 6. RSI14 reads 39 (weak), and the MACD slipped below zero and its signal line at 06:00 on October 6, with the negative histogram extending. The 15-minute SuperTrend is bearish at $85,633, a level price has just lost. Volume on the current candle runs at 31.8% of average, though a spike at 06:00 (3,649 against an 851 average) accompanied the breakdown.
The algorithm detects a wedge with a very near apex (14:11 on October 6, 2026, bounds $85,746 / $85,301) and several bearish RSI divergences, including a regular one on the 22:15 – 01:00 candle (price $85,995 to $86,098, RSI 65 to 64) and a hidden continuation divergence on 14:00 – 22:15. Intraday supports sit at $85,231 (five touches) then $84,475 (one touch). The M15 structure is bearish with a wedge on the verge of resolution, which mechanically points to a directional move in the next hours and keeps downside pressure as long as the 15-min SuperTrend holds.
Multi-Timeframe Synthesis
Reading the three timeframes together, a clear hierarchy emerges between structure (daily bullish) and short-term momentum (4H neutral in compression, 15M bearish). The table below summarizes the active signals.
| Timeframe | Dominant Trend | RSI (14) | MACD | Chart Pattern |
|---|---|---|---|---|
| Daily (1D) | Bullish (consolidation) | ~62 | Bearish cross, negative histogram | Wedge apex 17/10 + confirmed double top |
| 4 hours (4H) | Neutral (compression) | ~51 | Recent bearish cross (1 candle) | Wedge apex 13/10 + confirmed bullish triple bottom |
| 15 minutes | Bearish | ~39 | Below zero, bearish cross | Wedge apex today 14:11 |
Mapping of Technical Levels and Pivots
Method: classic daily pivots combined with extensions from the September 21 swing high at $87,385, the daily wedge bounds ($89,057 / $82,500), Binance order book liquidity concentrations, and estimated liquidation pockets. Short-term central pivot: $85,868 (Daily P), the equilibrium zone where most buy and sell flow concentrates.
| Level | Price (USD) | Category | Technical Basis |
|---|---|---|---|
| R3 | 89,000 – 89,400 | Major resistance | Daily wedge upper bound ($89,057) + estimated shorts pocket ($89,239 peak, $93M USD) |
| R2 | 87,300 – 87,400 | Major resistance | 09/21 swing high at $87,385 + 4H resistance $87,317 (2 touches) + 1st shorts pocket ($87,504 peak, $242M) |
| R1 | 86,800 – 87,000 | Immediate resistance | 15M resistance $86,709 (3 touches) + Daily R1 $86,825 |
| P | 85,600 – 85,870 | Central pivot | Classic pivots Daily $85,868 / 4H $85,612 + 15M bearish SuperTrend at $85,633 + 4H triple bottom neckline |
| S1 | 84,700 – 85,100 | Immediate support | Daily S1 $84,759 + 15M support $85,231 (5 touches) + buy wall $85,010 ($7.6M) |
| S2 | 83,800 – 84,200 | Major support | Daily support $82,283 (1 touch) + longs pocket $83,167 ($92M) + daily wedge lower bound $82,500 |
| S3 | 81,400 – 82,000 | Major support | Longs pocket $81,432 ($205M, -4.5%) + 4H support $82,391 (2 touches) |
Order Book and Liquidity Heatmap
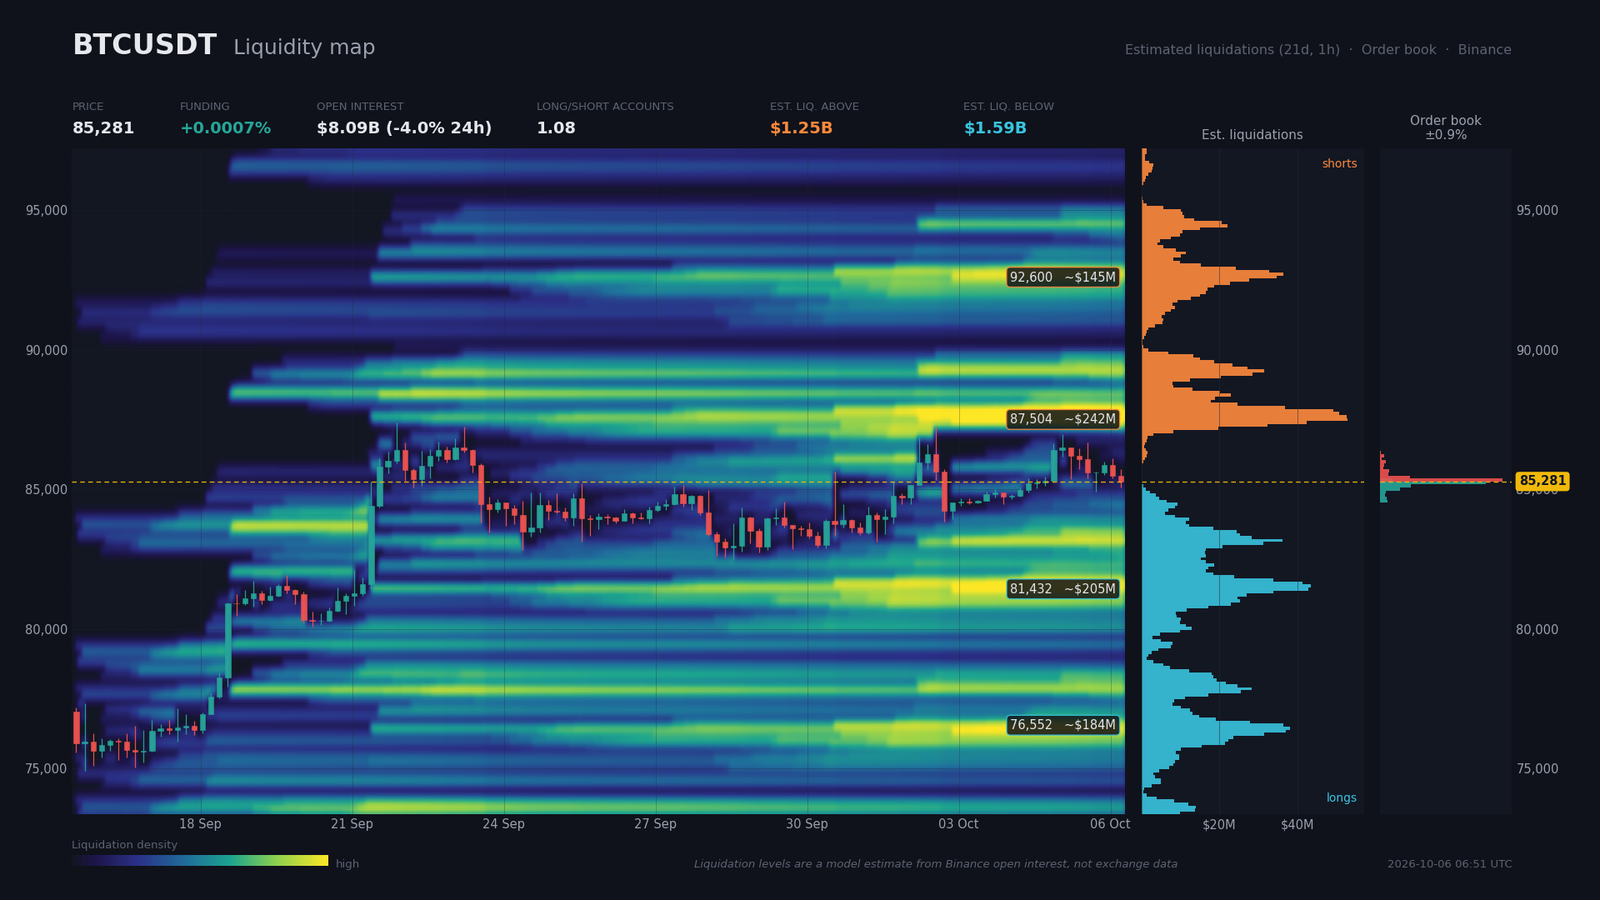
The aggregated Binance book (spot and perp) covers 87% of flow within the ±2% window: $75.4M of bids against $72.8M of asks, a modest positive imbalance of 1.7% favoring buyers. The densest sell walls sit at $85,335 ($47.8M) and $85,443 ($11.5M), just above spot; buy walls cluster at $85,226 ($41.3M), $85,118 ($11.9M) and $85,010 ($7.6M), carving a tight 150-dollar corridor around price. The near-term liquidity sweep target remains the buy wall at 85,010-85,118 on the downside and the sell wall at $85,443 on the upside.
Beyond order book coverage, the estimated liquidation zones reveal where future liquidity sits: on the shorts side, the densest pocket is at $87,504 ($242M, +2.6%), followed by $89,239 ($93M) and $92,600 ($145M); on the longs side, the main pocket is at $81,432 ($205M, -4.5%), then $76,552 ($184M, -10.2%) and $83,167 ($92M). Aggregated open interest stands at $8.09 billion, down 3.97% over 24 hours but up 4.32% over seven days – a tactical deflate without structural unwind. Funding is at 0.0007% (annualized 0.8%), modest; the global long/short ratio is 1.083 and the top-trader ratio 1.754, both clearly long, while the 24-hour taker buy/sell at 0.959 is very slightly bearish. A long squeeze setup would need a break above $85,660 (15-min SuperTrend) to trigger, with the shorts pocket at $87,500 as the next target.
Calendar: Catalysts to Watch
The macro calendar over the next ten days concentrates most of the directional risk. The window is dominated by FOMC minutes on Wednesday October 7, followed by the UoM sentiment print on Friday October 9 and a fresh core CPI on Wednesday October 14.
- Wednesday October 7, 8:00 pm (Zurich) – FOMC minutes: major catalyst; any signal on a rate cut or on the internal Fed debate can push BTC out of its 84,700-87,400 range.
- Wednesday October 8, 2:15 pm (Zurich) – BoE Bailey speech: indirect impact via the dollar and global liquidity.
- Friday October 9, 4:00 pm (Zurich) – UoM preliminary sentiment: consensus 47.6, prior 48.1; in focus after the soft NFP.
- Wednesday October 14, 3:30 am (Zurich) – China YoY inflation: prior 0.8%; direct impact on Asian BTC demand.
- Wednesday October 14, 2:30 pm (Zurich) – US core inflation m/m: prior 0.3%; potential volatility catalyst across risk assets.
Three Scenarios for the Coming Weeks
The current technical setup – compression inside a daily wedge with an October 17 apex, a confirmed 4H triple bottom, fading short-term momentum – opens three trajectories weighted by the analyst, summing to 100%. The shared catalyst is the FOMC minutes on October 7.
Scenario A – Compression resolves to the upside (probability 45%)
Catalyst: FOMC minutes on Wednesday October 7 at 8:00 pm read as confirming the Fed pause. Trigger: 4-hour close above $85,960 (4H R1) and an upside break of the daily wedge. Trajectory: revisit 87,300-87,400 (R2, September 21 swing high), then on confirmation 88,000-88,350 (4H triple bottom neckline plus projected move). Execution zone: 85,230-85,470 on pullback. Invalidation: daily close below $84,759 (Daily S1) and 4H MACD sliding below zero. Stop: 1x ATR14 4H ($764) below entry, around $84,700. R:R approx 2.2 on the $87,350 target.
Scenario B – Liquidity sweep before continuation (probability 35%)
Catalyst: neutral FOMC minutes and an in-line UoM print on Friday October 9. Trigger: break of the buy wall at $85,010 and excursion toward the longs pocket at $83,167 ($92M). Trajectory: intraday low toward 83,800-84,200 (Daily S2, extended 4H support $82,391), then a structural bounce off the daily wedge lower bound. Execution zone: 83,800-84,000. Invalidation: 4-hour close below $82,391 and break of the daily SuperTrend at $79,427. Stop: 1x ATR14 Daily ($2,127) below entry, around $81,700. R:R approx 1.8 toward the $85,870 target.
Scenario C – Bullish invalidation (probability 20%)
Catalyst: hawkish surprise in FOMC minutes or a dollar rebound on stronger UoM data. Trigger: confirmed 4-hour break below $82,391 then acceleration toward the $81,432 pocket ($205M). Trajectory: 81,400-82,000 tested, then 79,400-79,600 (daily SuperTrend, Daily SMA50 $79,885). Execution zone: 79,400-79,900 on bounce. Invalidation: a return above $82,500 (daily wedge lower bound) cancels the thesis. Stop: 1x ATR14 Daily ($2,127) below entry, around $77,300. R:R approx 1.6 toward the $82,300 target.
Synthesis and Conclusion
Bitcoin consolidates at a technically sensitive level: the underlying trend stays bullish (active golden cross, price above the major SMAs, bullish daily SuperTrend at $79,427), but short-term momentum has rolled over, with a confirmed 4H triple bottom against an unconfirmed 4H double top and a 15-minute wedge on the verge of resolution. Open interest flow remains tilted higher over seven days (CoinDesk, October 2, 2026), and one-off institutional flows (Strive, Decrypt October 5) confirm structural appetite, while US regulatory pressure (SEC custody proposal, Coinbase CFTC approval) is sketching a more legible framework for traditional actors.
The dominant strategy is to trade the compression of the daily wedge (October 17 apex) by favoring entries on dips in the 84,200-85,200 zone as long as the daily SuperTrend at $79,427 holds. Critical levels: $87,350 (R2, September 21 swing high and first shorts pocket), $85,870 (Daily pivot), 85,010-85,230 (immediate support zone and buy walls), $82,500 (daily wedge lower bound), $81,430 (main longs pocket). The structural protection level remains the daily SuperTrend at $79,427; its loss would invalidate the bullish read and shift the central scenario toward Scenario C.
Sources
- Strive Adds $169M Bitcoin in Its Biggest Buy in Four Months – Decrypt, October 5, 2026
- Coinbase’s Ryan VanGrack: CFTC Approval “Opens Many Doors” For Bitcoin – Bitcoin Magazine, October 5, 2026
- Bullish bitcoin (BTC) bets build as open interest jumps by $2.3 billion – CoinDesk, October 2, 2026
- Dollar gets lift from higher yields – Reuters, October 1, 2026
- How quant funds beat the market by being ‘early, contrarian and right’ – CNBC, October 6, 2026
- Rain Seeks US Trust Bank Charter Amid OCC Challenge – Cointelegraph, October 6, 2026
- SEC Targets Crypto Custody Rules in Major Regulatory Shift – Investing.com, October 2, 2026
- SEC Proposes Framework for Crypto Custody by Investment Funds – Generation Impact Global, October 2, 2026
- Grayscale adds BitGo as custodian for its Hyperliquid staking ETF – Crypto Briefing, October 6, 2026
- NFP, PCE, GDP, ISM, eurozone inflation, unemployment rate prints – integrated economic_calendar, week of September 30 to October 5, 2026.
Disclaimer: This article is for educational and informational purposes only. It does not constitute investment advice, a recommendation to buy or sell, or an invitation to trade any financial asset. Cryptocurrency markets are extremely volatile; any investment decision should be based on your own research (DYOR) and, where appropriate, the advice of a licensed financial adviser.

