


Bitcoin trades on October 4, 2026 around $84,927, locked in a consolidation under a major resistance band sitting between $87,250 and $87,400. Price has corrected roughly 2.8% from the October 2 peak printed on the 4-hour chart at $87,250, after the rally triggered by the deeply disappointing NFP report (29,000 jobs created vs. 90,000 expected, unemployment at 4.2% vs. 4.1% anticipated, hourly wages 0.1% vs. 0.3%). That “bad news is good news” reading, echoed by CNBC and MarketWatch on October 3, 2026, has reshuffled the monetary deck.
The implied probability of an October Fed hold jumped from 36% to 78% on CME FedWatch (CNBC, October 3, 2026), while Kalshi and Polymarket prediction markets priced an 80% chance of a pause. Aggregate open interest has expanded by $2.3B since September 30, and perpetual funding has ticked higher, signalling a return of directional risk appetite, although from a still-low base. Spot ETFs logged a $102M net inflow on October 2 (Decrypt, October 2 18:45), extending the demand pulse. Bitcoin briefly cleared $87,000 on October 2 (Cointelegraph, Oct. 2 17:27; Bitcoin Magazine, Oct. 2 17:09) before fading back.
The move sits within a string of recent data prints that paved the way. August core PCE, released September 30 at 0.3% month-over-month (consensus 0.4%, prior 0.1%), already delivered a dovish read. The September 29 JOLTS report came in at 7,079 (consensus 7,230), followed by the October 1 ISM Manufacturing at 52.7 (consensus 55.0, prior 51.2) — both below consensus. The October 2 eurozone flash inflation print at 3.8% year-over-year (consensus 3.6%, prior 3.2%) however cooled the global disinflation narrative by reminding markets that price pressure remains alive in Europe.
On the regulatory front, the SEC proposed on October 1 a crypto custody framework for advisers and funds, authorizing self-custody under conditions and the use of state trust companies (The Block, October 1, 2026; Investing.com, October 2, 2026). That proposal, paired with Absa becoming the first African bank to custody bitcoin (Bitcoin Magazine, October 2, 2026), is a structurally positive signal for institutional adoption. This macro and regulatory backdrop carries a bullish technical bias, but the daily compression in place and the extreme sensitivity to the next catalysts — chiefly the FOMC Minutes on October 7 — argue for a wait-and-read posture rather than an imminent directional breakout. The analysis below dissects price structure across three timeframes, from daily down to 15-minute, before laying out three probabilistic scenarios for the weeks ahead.
Multi-Timeframe Technical Analysis
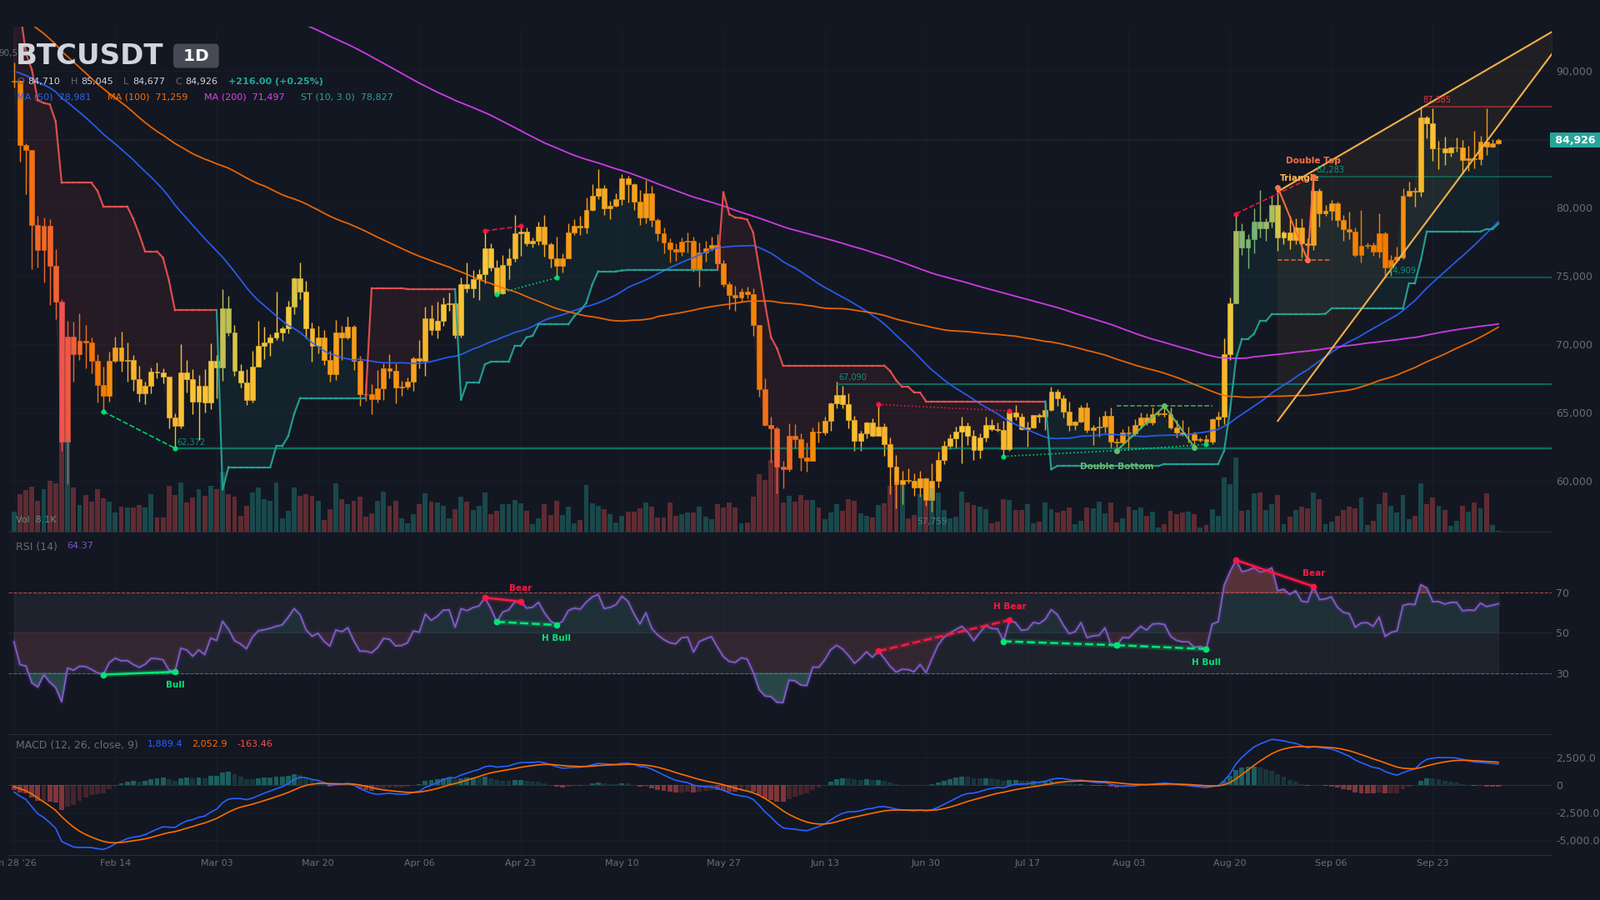
Daily Timeframe (1D): Compression Wedge Under Major Resistance
The structural trend remains bullish: price trades above the 20-period SMA at $82,770, the 50-period SMA at $78,980 and the 200-period SMA at $71,500. The 50/200 bullish crossover (golden cross) printed on September 8 — twenty-six candles ago — and the 50 SMA now acts as a distant cushion, more than $7,000 below spot. The daily SuperTrend is bullish at $78,830.
Price action carves a compression wedge (rising wedge) between $82,500 (September 28 low) and $89,060 (algorithmic upper bound), with an apex estimated around October 17. Spot sits at the heart of the pattern. The confirmed double top, with a neckline at $76,150 and a $70,410 target, remains a long-term bearish setup; its objective has not been reached, however, and the pattern is now neutralized by the rebound since September 28. The bullish double bottom, targeting $68,610, is fully realized.
The 14-period RSI prints 64, in neutral-high territory, but flashes a regular bearish divergence against the September 21 high: the RSI marked 80 at $87,385 versus 73 on the current swing. The MACD line remains below the signal line after a bearish crossover on September 29; the histogram contracts but stays negative. Daily volume is anaemic: 8,100 BTC versus the 20-day average of 150,600 BTC, just 5% of average — a textbook profile of a pre-catalyst waiting phase.
Intermediate Dynamics (4H): Compression Between Double Bottom and Triple Top
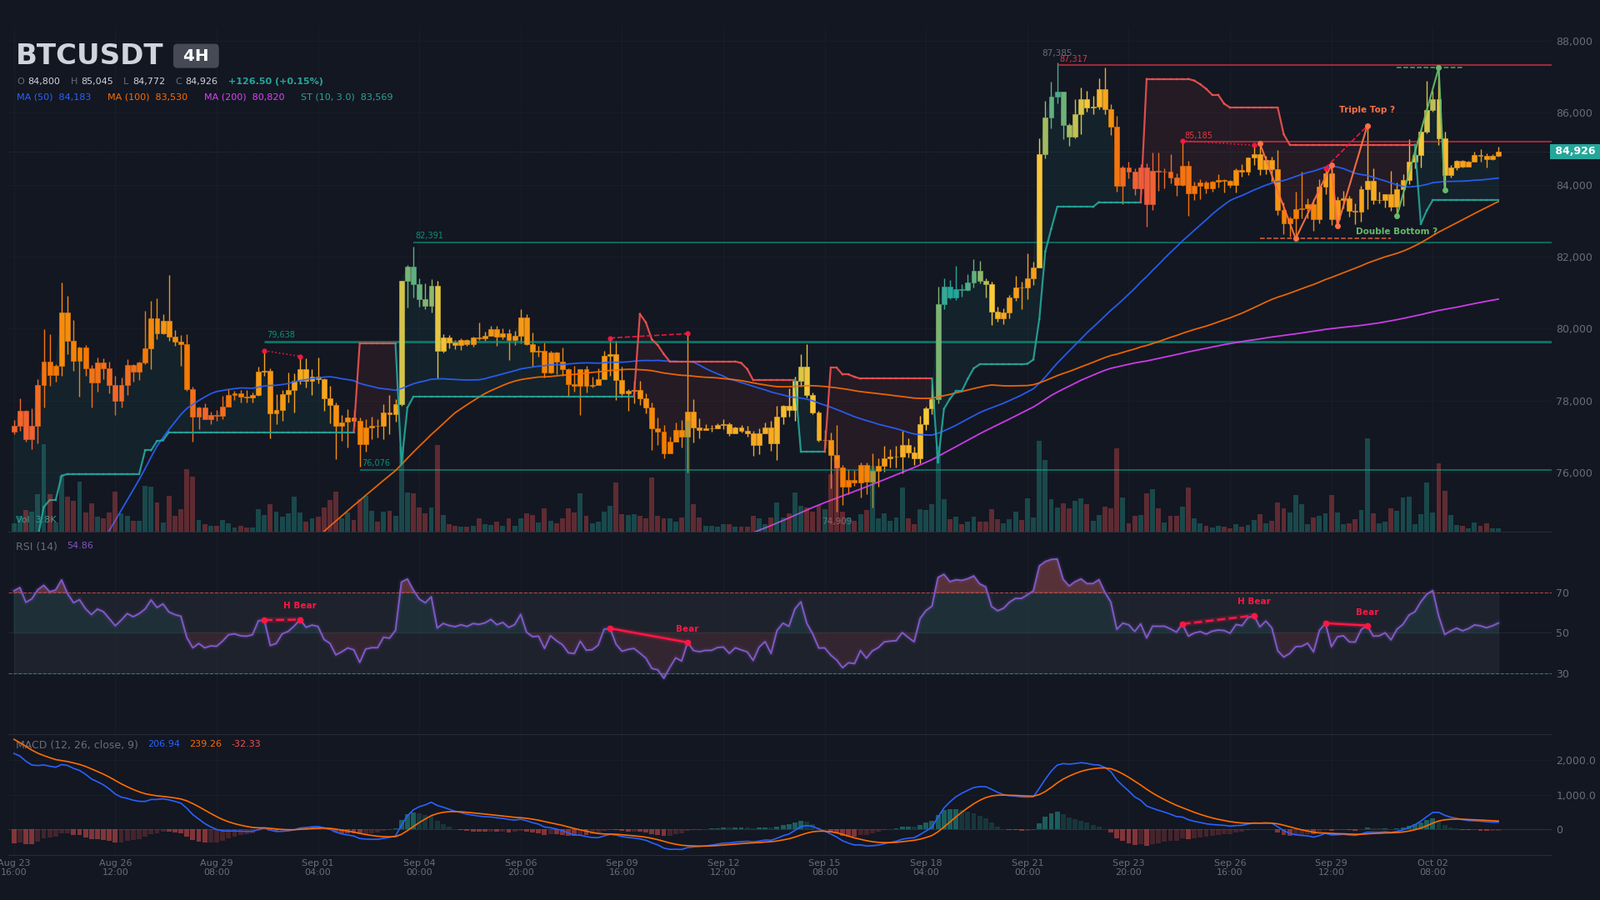
The 4-hour structure confirms the daily compression. Two unconfirmed patterns face off symmetrically: a bullish double bottom, with a neckline at $87,250 and a $91,010 target, valid only on a clean break of $87,250; and a bearish triple top, with a neckline at $82,500 and a $79,890 target. As long as price remains between these two rails, the read is neutral, and the daily apex around October 17 acts as a shared clock across both timeframes.
Price sits above the 20 SMA at $84,720, the 50 SMA at $84,180 and the 200 SMA at $80,820. The 4H SuperTrend is bullish at $83,570. The 14 RSI at 55 is neutral and prints a regular bearish divergence between $84,470 and $85,630 from September 29 to 30, complemented by a hidden bearish divergence on September 25-27. The MACD crossed below the signal on October 3 and the histogram, negative, is contracting — a short-term warning. 4H volume sits at 18% of average, a signature of an order-flow market without conviction.
Intraday Structure (15m): Rebound Inside an Ascending Wedge
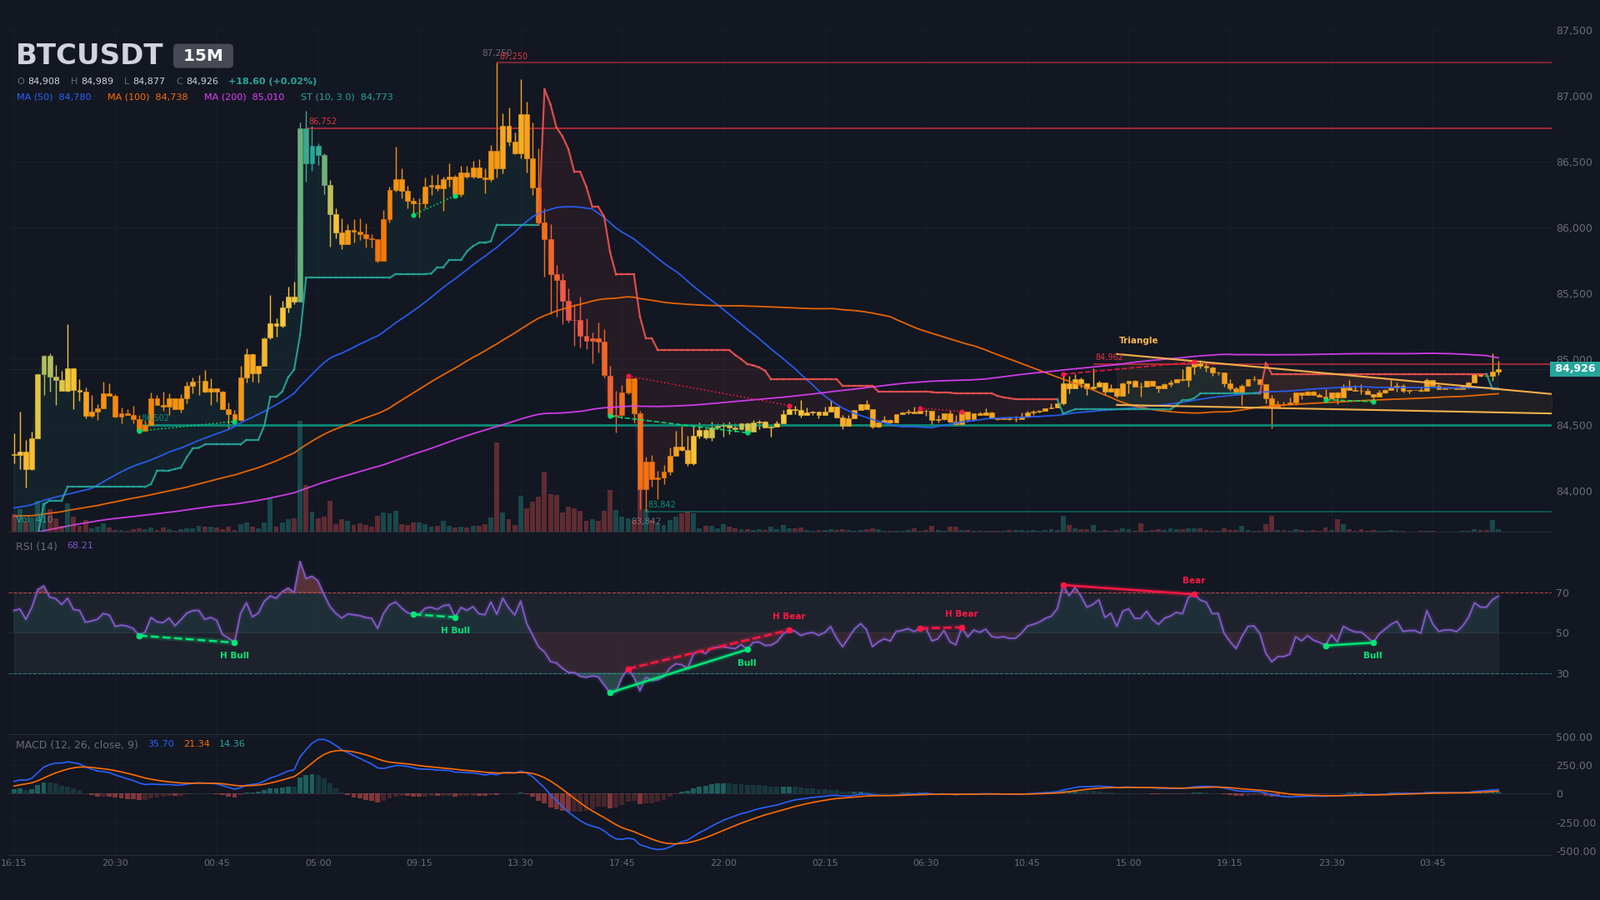
On the 15-minute chart, price trades within an ascending wedge between $84,606 and $84,823, with an apex expected around 20:00 today. The Asian session carved a low at $84,475 at 21:00 yesterday, followed by a rebound to the day’s high at $85,045 on the live candle. The 14 RSI at 68 (brisk-neutral) and the MACD, which just printed a fresh bullish crossover at 00:00 today, confirm a positive intraday pulse. 15-minute volume reaches 165% of the 20-period average, a sign of localized but real buying participation, in the prospect of an imminent test of the $85,080-$85,200 resistance.
Multi-Timeframe Synthesis
| Timeframe | Dominant trend | RSI (14) | MACD | Chart pattern |
|---|---|---|---|---|
| Daily (1D) | Bullish (consolidation under resistance) | ~64 | Bearish crossover, histogram contracting | Compression wedge ($82,500 – $89,060) |
| 4 hours (4H) | Neutral (symmetric compression) | ~55 | Bearish crossover, stabilizing | Bullish double bottom / bearish triple top, unconfirmed |
| 15 minutes | Bullish (short term) | ~68 | Fresh bullish crossover | Ascending wedge ($84,606 – $84,823) |
Mapping of Technical Levels and Pivots
The map blends classic daily pivots, support and resistance levels detected across the three timeframes, order-book liquidity clusters and model-estimated liquidation pools. The short-term central pivot sits in the $84,700-$84,800 band, at the confluence of the daily P pivot ($84,705), the 4H 20 SMA ($84,720) and the spot bid wall at $84,874 ($37.2M).
| Level | Price (USD) | Category | Technical basis |
|---|---|---|---|
| Major resistance 3 (R3) | $87,250 – $87,400 | Major resistance | Daily swing high Sept. 21 ($87,385), 4H peak Oct. 2 ($87,250), 4H double-bottom neckline, peak of the estimated short liquidation pocket ($87,440-$87,860) |
| Major resistance 2 (R2) | $86,750 – $87,000 | Resistance | M15 resistance at $86,752 (2 touches) and $86,753 (2% ask wall) |
| Immediate resistance (R1) | $85,080 – $85,200 | Resistance | Spot ask wall at $85,083 ($14.9M), 4H resistance at $85,185 (2 touches) |
| Central pivot (P) | $84,700 – $84,800 | Pivot | Classic daily pivots (P $84,705, R1 $85,000, S1 $84,415), 4H 20 SMA ($84,720), spot bid wall at $84,874 ($37.2M) |
| Immediate support (S1) | $84,400 – $84,500 | Support | Daily S1 ($84,415), M15 support at $84,502 (6 touches), 4H swing low Oct. 2 |
| Major support 2 (S2) | $82,300 – $82,500 | Support | 4H and daily swing low Sept. 28 ($82,500), lower bound of the daily wedge, 4H triple-top neckline |
| Major support 3 (S3) | $79,500 – $79,900 | Support | 4H triple-top target ($79,890), 4H support at $79,638 (4 touches) |
Order Book and Liquidity Heatmap
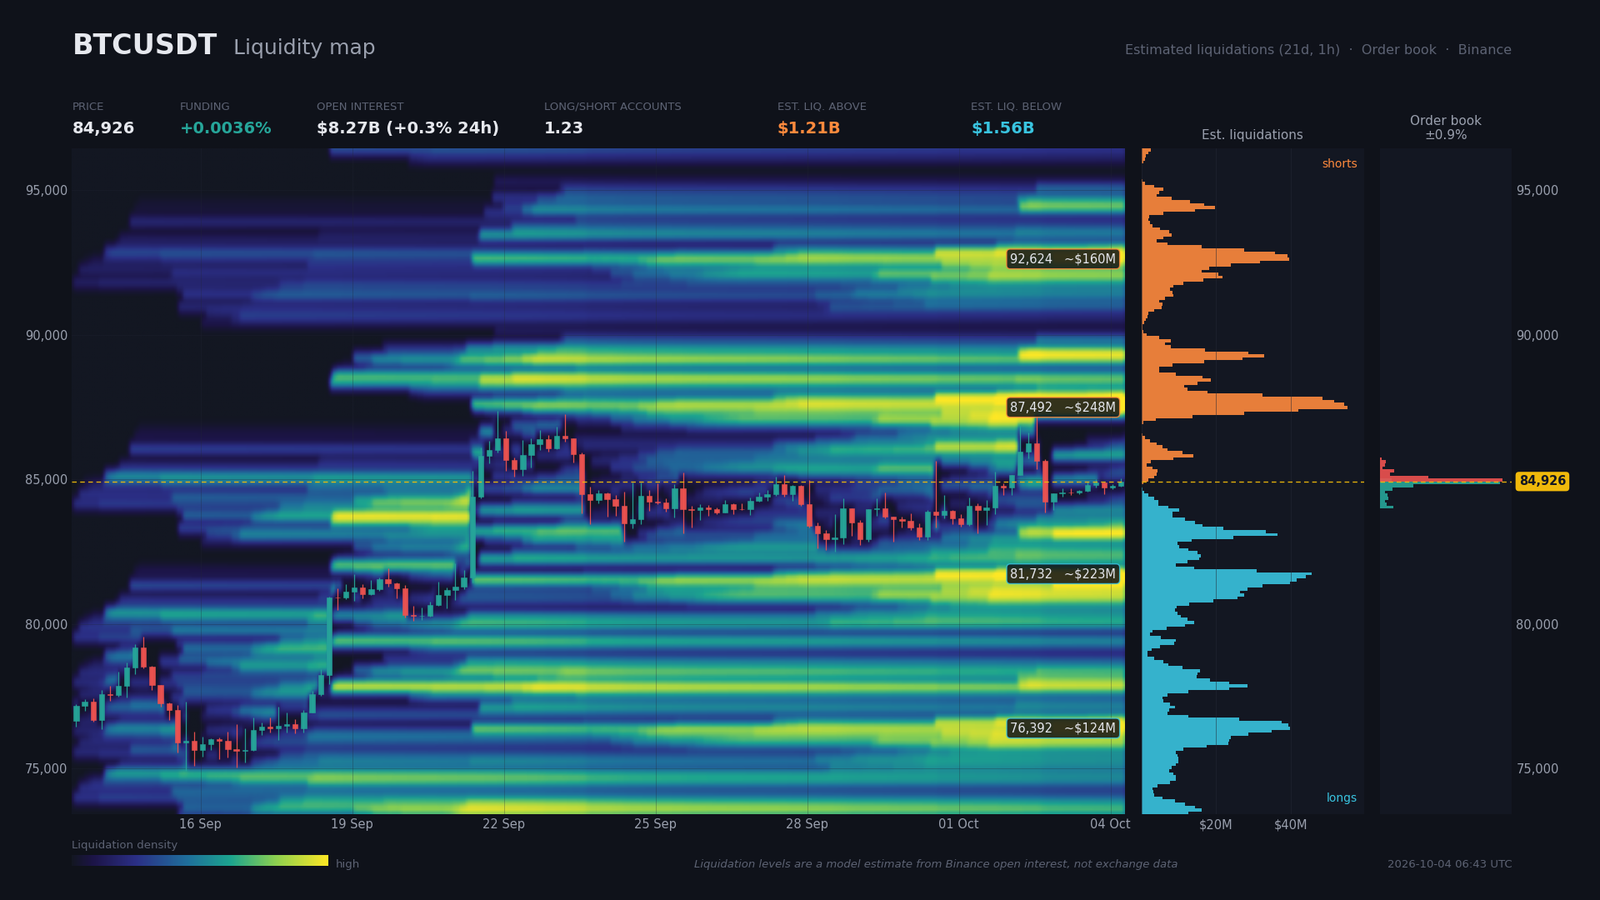
The aggregated book (spot + Binance perp) shows a 3.4% buy imbalance on the ±2% band, i.e. $68.5M of bids versus $64.0M of asks, with 95% of the book covered by Binance prints. The main bid wall sits at $84,874 ($37.2M, 0.06% below spot), followed by $84,769 ($10.3M) and $84,665 ($3.9M). The main ask wall is at $84,979 ($37.8M, 0.06% above), then $85,084 ($14.9M) and $85,188 ($2.9M). The near-perfect symmetry of the two top walls ($37M on each side) signals an extremely tight range in the $84,870-$84,980 zone.
On the derivatives side, perpetual funding prints 0.0036% (4% annualized), perfectly neutral. Open interest stands at $8.27B, up 0.3% over 24 hours and 4.14% over seven days, evidence of a slow rebuild of leverage without excess. The global long/short ratio is 1.23 (mild buy bias) and the top-trader ratio is 1.84 (marked buy bias), while the 24h taker buy/sell ratio is 0.955 (slightly sell-side) — a textbook configuration of a market building a breakout.
Estimated liquidation pools total $1.21B above and $1.56B below spot. On the short side, the three main pockets are: $87,440-$87,860 ($248M, 3.0% above), $89,115-$89,430 ($103M, 5.1%) and $92,570-$92,990 ($160M, 9.1%). On the long side: $81,370-$81,890 ($223M, 3.8% below), $76,130-$76,440 ($124M, 10.0%) and $83,040-$83,250 ($94M, 2.2%). The $87,440-$87,860 pocket acts as a short-term bullish magnet; the $83,040-$83,250 pocket is the first bearish magnet. The risk of a liquidity sweep is elevated at the $87,250-$87,400 resistance, consistent with the typical post-NFP price behaviour.
Calendar: Catalysts to Watch
The macro lineup over the next ten days conditions the exit from the current daily compression. The October 7 FOMC Minutes are the major directional test, capable on their own of pushing bitcoin out of the daily wedge.
- October 5, 16:00 (Zurich) — USD Services PMI final (consensus 55.7; prior 55.4): confirm services deceleration and feed the dovish narrative.
- October 6, 08:35 (Zurich) — BoJ Governor Ueda speech: yen direction and risk-off signals, potential impact on risk assets.
- October 7, 20:00 (Zurich) — FOMC Minutes. Major catalyst (consensus: October hold). Any hint of a prolonged pause would send real rates lower.
- October 8, 14:30 (Zurich) — Initial Jobless Claims (consensus 195,000; prior 197,000): weekly gauge of the labour market.
- October 9, 16:00 (Zurich) — UoM Consumer Sentiment preliminary (consensus 48.1; prior 48.1): barometer of household confidence.
- October 14, 03:30 (Zurich) — China inflation YoY (prior 0.8%): exogenous impulse on global demand and late catalyst for the daily apex.
Three Scenarios for the Coming Weeks
The horizon runs to the daily wedge apex around October 17, with particular attention to the FOMC window on October 7-8. Probabilities are calibrated on price position within the compression, the momentum profile and the distribution of the liquidation pools.
Scenario A — Bullish Break of the Daily Wedge (probability 50%)
Catalyst: October 7 FOMC Minutes confirming the dovish tone and anchoring the hold probability above 80%. Trigger: a 4H close above $85,200 (R1) on a clean break of the $14.9M ask wall at $85,084. Path: $85,200 → $86,000 → test of the post-NFP high at $87,250-$87,400 (short pocket $248M) → $88,000-$89,000 toward the daily wedge upper bound at $89,060. The R:R is 2,200 / 670 ≈ 3.3. Execution zone: $85,100-$85,300. Invalidation: 4H close below $84,000.
Scenario B — Range $82,500-$87,250 With Liquidity Sweep (probability 35%)
Catalyst: no clear directional signal from the FOMC Minutes, market grinding inside the daily compression. Trigger: oscillations between $82,500 (September 28 low, S2) and $87,250 (October 2 high, R3), with a prior sweep of the $87,400-$87,860 zone ($248M short pocket) followed by a fade toward $85,200, then a downside rotation if selling pressure builds. The negative daily MACD and the bearish RSI divergence argue for this default hypothesis. Execution zone: sell $87,100-$87,200 (R2-R3), buy $82,700-$82,900 (S2). Invalidation: daily close above $87,500 (flips to A) or below $82,000 (flips to C).
Scenario C — Bearish Break Toward $79,500-$80,000 (probability 15%)
Catalyst: a more hawkish-than-expected FOMC Minutes, ISM rebound, relapse in spot ETF flows and a renewed global risk-off. Trigger: loss of the $82,500 support (S2, 4H triple-top neckline, lower bound of the daily wedge) validated on a daily close. Path: $84,500 → $83,000 ($94M long pocket) → $81,500 ($223M pocket) → $79,500-$80,000 (S3, 4H triple-top target at $79,890). The R:R is 3,400 / 670 ≈ 5.1. Execution zone: $83,000-$83,200. Invalidation: 4H close above $84,700.
Summary and Conclusion
Bitcoin remains in a daily compression phase, inside a wedge whose apex sits around October 17. The structural bullish bias is intact — confirmed by price holding above every daily moving average, by the SuperTrend being bullish on all three timeframes and by the derivatives flow read (open interest rebuilding modestly, long/short ratios skewed long) — but the daily momentum fatigue (bearish RSI divergence, negative MACD) argues for a range-based read rather than an imminent directional breakout.
The dominant technical playbook is to buy dips toward $84,400-$84,800 with invalidation below $84,000, and to sell rallies toward $87,200-$87,400 targeting $85,200, with a directional bullish bias reserved for a confirmed break of $87,400 (R3). Key levels to monitor remain: $87,250-$87,400 (major resistance and the $248M short pocket), $85,080-$85,200 (immediate resistance, ask walls), $84,700-$84,800 (central pivot), $82,400-$82,500 (immediate support, 4H triple-top neckline) and $79,500-$79,900 (major support, 4H triple-top target).
Sources
- IMF Praises El Salvador — Bitcoin Magazine, October 2, 2026
- Absa Becomes First African Bank To Custody Bitcoin — Bitcoin Magazine, October 2, 2026
- Bitcoin Heads Higher on Macro Moves — Decrypt, October 2, 2026
- Bitcoin briefly hits $87K as weak US jobs data — Cointelegraph, October 2, 2026
- Bitcoin Price Surges Above $87,000 — Bitcoin Magazine, October 2, 2026
- Bitcoin ‘golden cross’ pattern — CNBC, October 2, 2026
- Bitcoin nears highest level since January — The Block, October 2, 2026
- ‘Uptober’ Off With a Bang — Decrypt, October 2, 2026
- How Nvidia, Micron and a surprising jobs report drove last week’s stock action — CNBC, October 3, 2026
- The U.S. jobs market just took a turn for the worse — MarketWatch, October 3, 2026
- SEC proposes framework allowing advisers to self-custody crypto — The Block, October 1, 2026
- SEC Targets Crypto Custody Rules in Major Regulatory Shift — Investing.com, October 2, 2026
- Bullish bitcoin bets build as open interest jumps by $2.3 billion — CoinDesk, October 2, 2026
- Bitcoin Whales Are Buying Again — Bitcoin Foundation, September 28, 2026
- Pump.fun sees $8.3M in long liquidations — AMBCrypto, October 3, 2026
- Lula or Bolsonaro: Wall Street braces — CNBC, October 3, 2026
- Trump Is Hosting Yet Another Meme Coin Dinner — Decrypt, October 3, 2026
- Community banks sue OCC over trust bank charters — Cointelegraph, October 3, 2026
- European crypto users have ‘more faith’ under MiCA — Cointelegraph, October 2, 2026
- 71% of UK finance leaders expect tokenization — Cointelegraph, October 2, 2026
- Crypto’s billions are back, but the premiums aren’t — Cointelegraph, October 2, 2026
- Largest cluster of net long Ethereum positions at $2,538 — Crypto Briefing, October 2, 2026
- Blast shuts down $20M layer-2 network — CryptoSlate, October 3, 2026
- BNB Chain crosses $1B in tokenized stocks — Cointelegraph, October 2, 2026
- Zcash Drops 21% From Recent High — Decrypt, October 1, 2026
- 88 Trillion SHIB Threshold Back in Play — U.Today, October 4, 2026
- Stellar Unlocks New DeFi Milestone — U.Today, October 3, 2026
- United States Nonfarm Payrolls (historical data) — Investing.com, date not specified
Disclaimer: This article is for educational and informational purposes only. It does not constitute investment advice, a recommendation to buy or sell, or an invitation to trade any financial asset. Cryptocurrency markets are extremely volatile; any investment decision should be based on your own research (DYOR) and, where appropriate, the advice of a licensed financial adviser.

