


As the third quarter of 2026 draws to a close, Bitcoin (BTC/USD) sits at the crossroads of two major forces: a deep restructuring of the derivatives market and a spectacular resurgence of institutional demand. After printing an intermediate high of $87,396 on September 21, the asset is consolidating constructively between $83,900 and $84,100, extending a recovery of more than 42% from the summer’s cyclical lows below $60,000.
This breather follows the massive quarterly expiry on Deribit on Friday, September 25, covering a notional between $15.6 and $16.6 billion in Bitcoin and Ethereum options. While the theoretical « Max Pain » for this expiry sat between $72,000 and $76,000, the spot price stayed firmly anchored above $83,500 — a display of buyer resistance that underlines the strength of the underlying accumulation. The unwinding of nearly 40% of short-term open interest also purged the market of the pinning effect exerted by market makers’ positive gamma, opening the door to a directional expansion of volatility as the fourth quarter begins.
This structural support is largely explained by the powerful return of institutional flows through US spot Bitcoin ETFs, which recorded a historic net inflow of $999 million on September 21 — their strongest session in nearly eleven months — bringing cumulative inflows to almost $1.96 billion over four consecutive sessions. This liquidity shock triggered the forced liquidation of $648 million in short futures positions, propelling the market past several intermediate resistance levels.
On the macro front, the Federal Reserve raised its policy rate by 25 basis points (to a 3.75%–4.00% range) in mid-September, a widely anticipated move that removed a significant share of monetary uncertainty. However, the concurrent rise in 10-year Treasury yields and the procedural delay, in the US Senate, of the Digital Asset Market Clarity Act (50 votes in favor, 49 against) prompted some traders into tactical profit-taking, temporarily capping the market below $86,000. Meanwhile, the SEC’s move to open a clearer regulatory framework for the tokenization of corporate equity continues to reinforce long-term institutional conviction.
Multi-Timeframe Technical Analysis
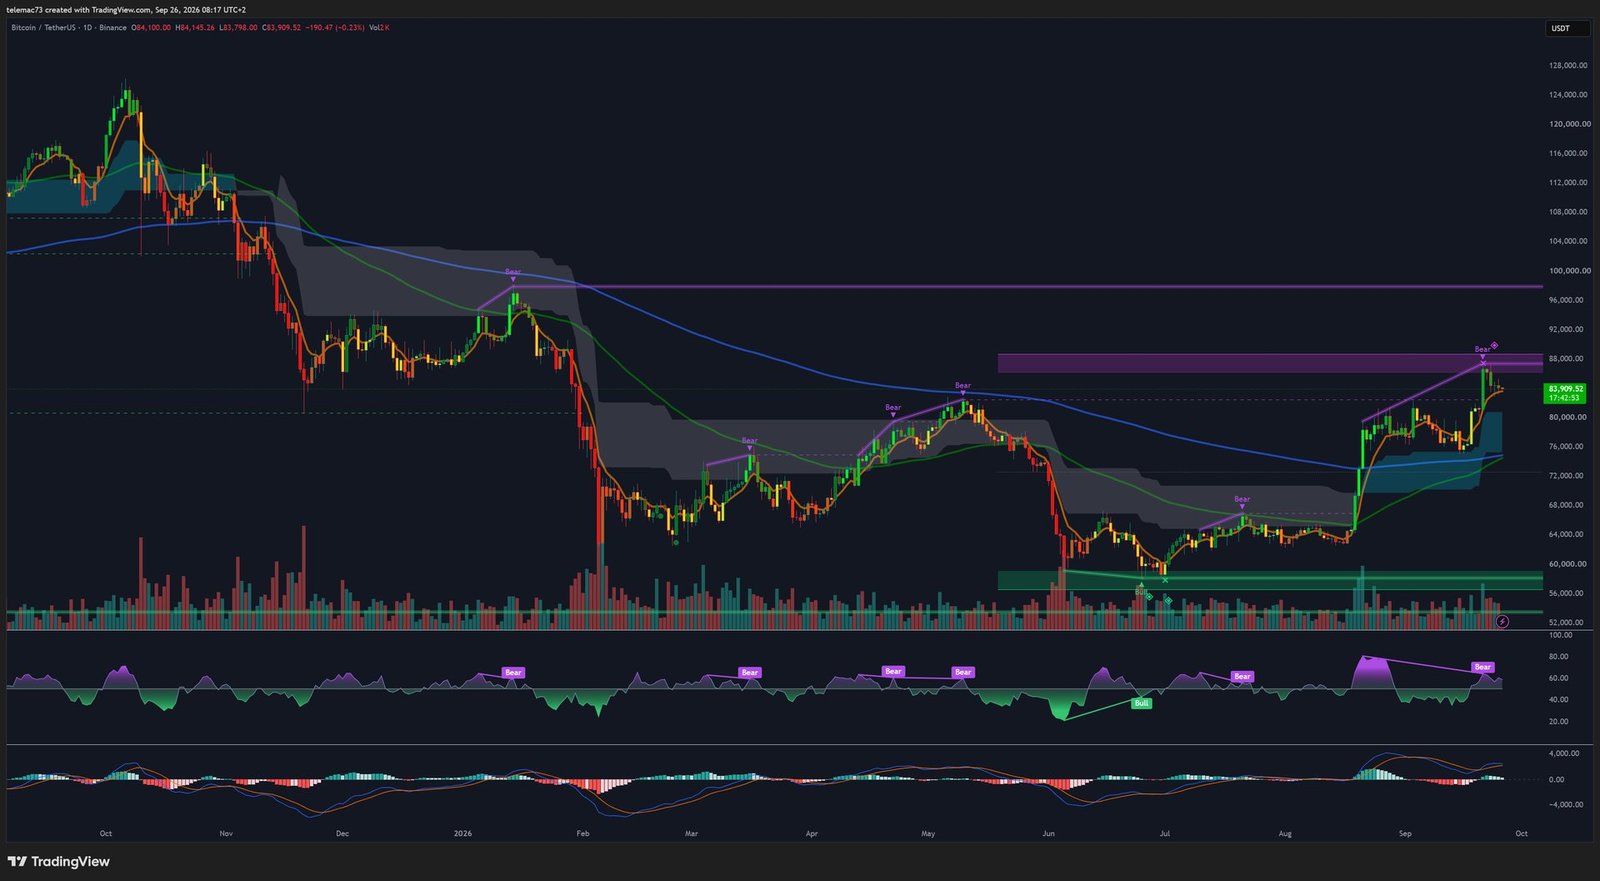
Daily Chart (1D): Golden Cross and Breakout From Accumulation
The daily chart confirms a major bullish breakout from a broad accumulation phase built between $53,000 and $58,000 through June and July 2026. August’s impulsive move allowed Bitcoin to reclaim its 200-day exponential moving average and close above its 50-week moving average for the first time in 45 weeks — validating a regime shift materialized by a Golden Cross of the short-term averages above the long-term trend.
Price action also traces a Cup and Handle pattern, whose $76,000 neckline broke with a clear expansion in volume. The theoretical extension of this pattern projects a long-term technical target beyond the $100,000 threshold.
On the indicator side, the 14-period RSI peaked above 80 during the initial breakout — extreme overbought territory — before printing a lower high around 72 during the retest of $87,396, confirming a regular bearish divergence. This divergence explains the current consolidation, with the oscillator pulling back to an equilibrium level of 63 without damaging the underlying uptrend. The MACD remains comfortably positive despite a contracting histogram, reflecting a simple momentum-absorption phase ahead of a further extension.
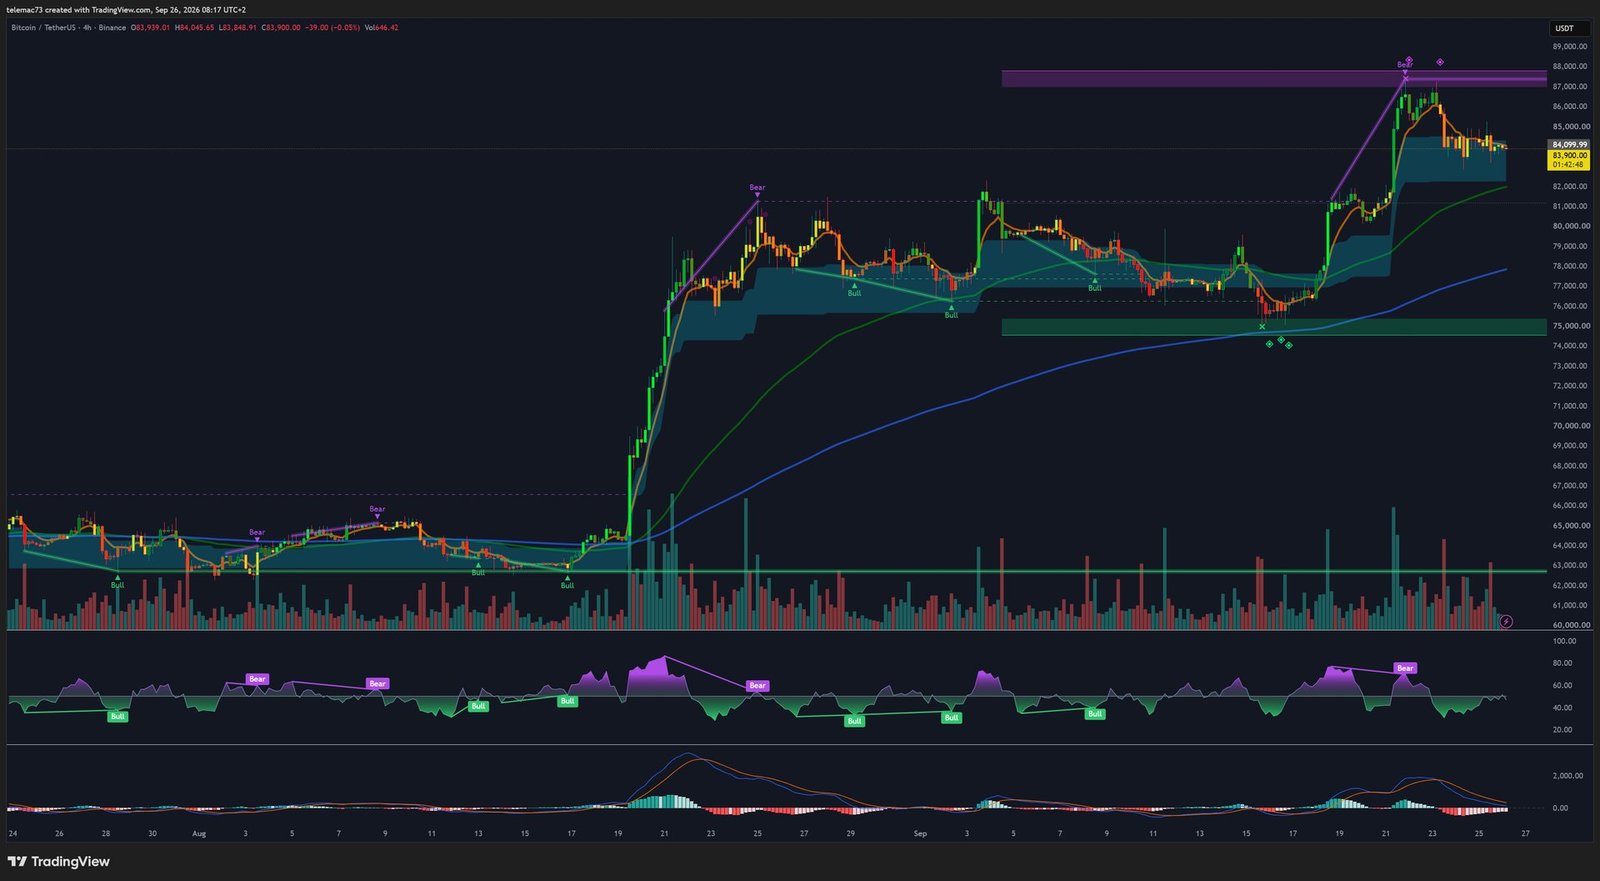
Intermediate Structure (4H): Bull Flag
On the 4-hour timeframe, price action closely matches a Bull Flag formation. The flagpole is the impulsive rally that drove the asset from $74,000 to $87,396, while the current downward consolidation is unfolding on markedly declining volume — a sign that the pullback is driven by a temporary lack of buying aggression rather than institutional distribution.
Price is resting on a dynamic support band between $81,500 and $82,500, while the 4-hour 200 EMA is climbing toward $76,000. The 4-hour MACD did register a bearish crossover (Death Cross) following the rejection at $87,396, but its negative slope is fading, with early signs of a rounding bottom hinting at a bullish reversal. The 4H RSI has stabilized around 51 after a local low of 42, revealing a hidden bullish divergence: price is printing higher lows while the oscillator has fully reset to neutral levels, leaving room for a resumption of the impulsive cycle.
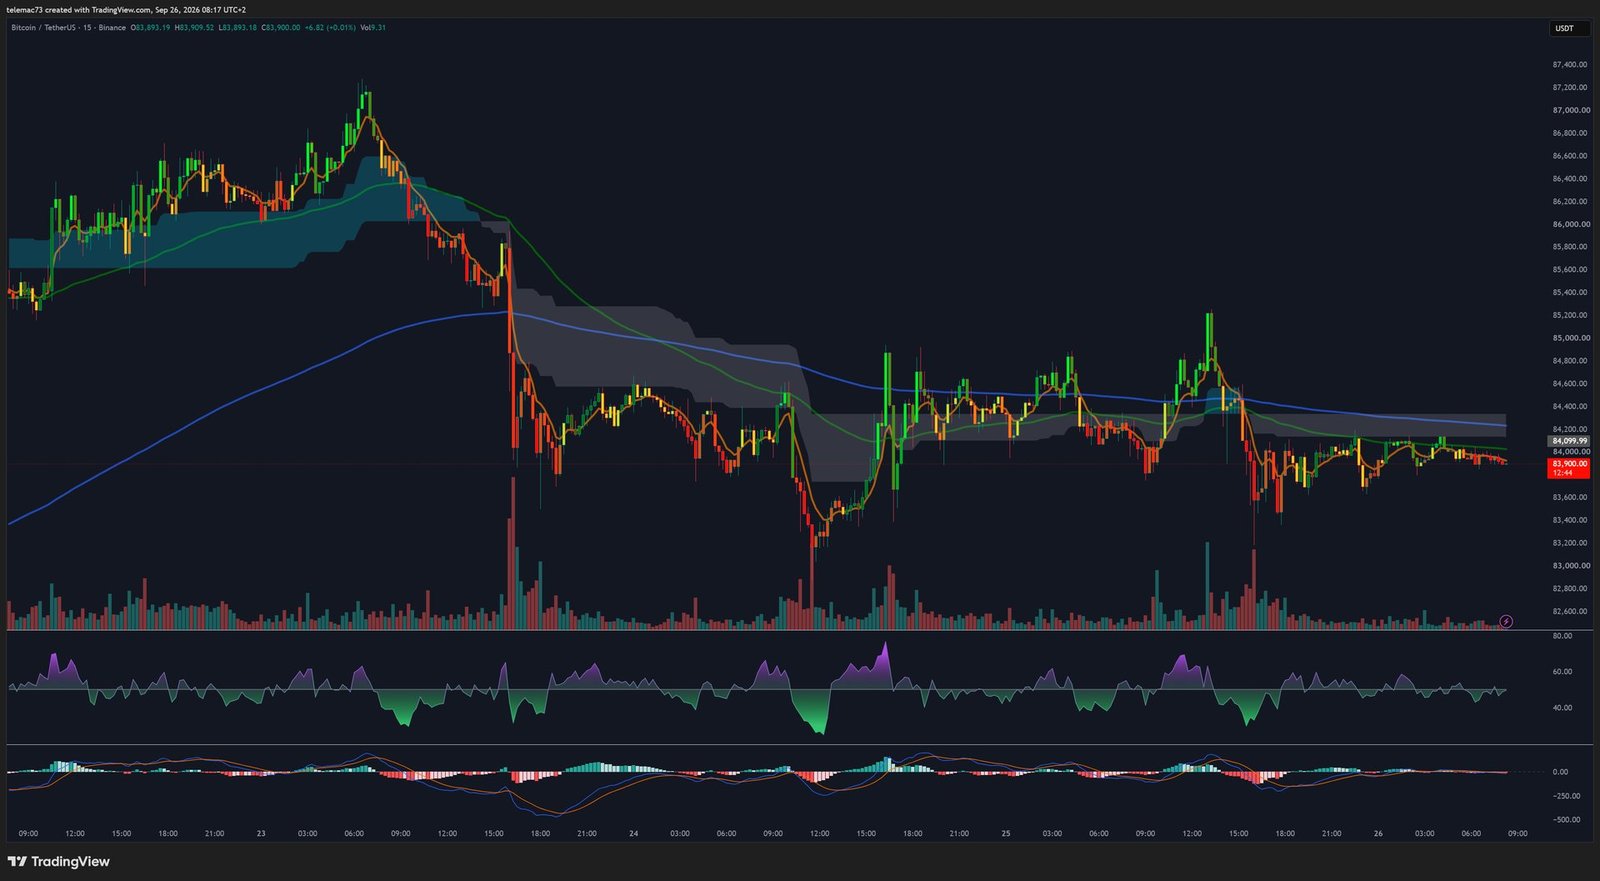
Intraday Structure (15m): Compression Triangle
On the 15-minute horizon, the sharp drop from the local peak of $87,200 to the $83,200 floor has given way to a series of tightening oscillations. Lower highs and higher lows are converging into a symmetrical compression triangle, bounded by a diagonal resistance at $84,400 and horizontal support at $83,600.
The 15-minute RSI is moving within a tight median band between 42 and 56, reflecting a temporary balance between profit-takers and passive buyers, while the MACD lines are tightly interwoven around the zero line — the directional dry-up typical of extreme compression phases. This mechanical tightening signals that an explosive breakout beyond the triangle’s boundaries is now imminent.
Multi-Timeframe Summary
| Timeframe | Dominant Trend | RSI (14) | MACD | Chart Pattern |
|---|---|---|---|---|
| Daily (1D) | Bullish (macro impulse) | ~63 | Positive, contracting histogram | Cup and Handle / breakout from accumulation |
| 4-Hour (4H) | Bullish (consolidation) | ~51 | Death Cross stabilizing | Bull Flag |
| 15-Minute | Neutral (intraday compression) | ~46 | Lines interwoven around zero | Symmetrical compression triangle |
Key Technical Levels and Pivots
Combining pivot points, Fibonacci extensions anchored on the $73,800–$87,396 impulse, and institutional volume clusters allows for a precise hierarchy of intervention levels. The short-term central pivot sits at $84,000–$84,400, the demarcation line between a bullish resolution of the flag and a deeper search for liquidity.
| Level | Price (USD) | Category | Technical Basis |
|---|---|---|---|
| Major Resistance 3 (R3) | $100,000 – $102,100 | Psychological barrier / extension | Maximum institutional expansion threshold, call-option concentration |
| Major Resistance 2 (R2) | $90,000 – $91,500 | 1.618 Fibonacci extension | Flagpole extension target, major liquidation cluster |
| Immediate Resistance (R1) | $86,800 – $87,400 | Recent high / local supply | September 21 high, sell-side liquidity sweep zone |
| Central Pivot (P) | $84,000 – $84,400 | Strategic inflection point | Upper bound of the 15m triangle and weekly VWAP |
| Immediate Support (S1) | $83,000 – $83,300 | Local floor | Bottom of the consolidation range |
| Major Support 2 (S2) | $80,500 – $81,200 | Former ceiling / role reversal | Mid-September breakout threshold |
| Major Support 3 (S3) | $76,000 – $77,500 | 200D EMA / Max Pain | Confluence of the 200-day MA and derivatives pain zone |
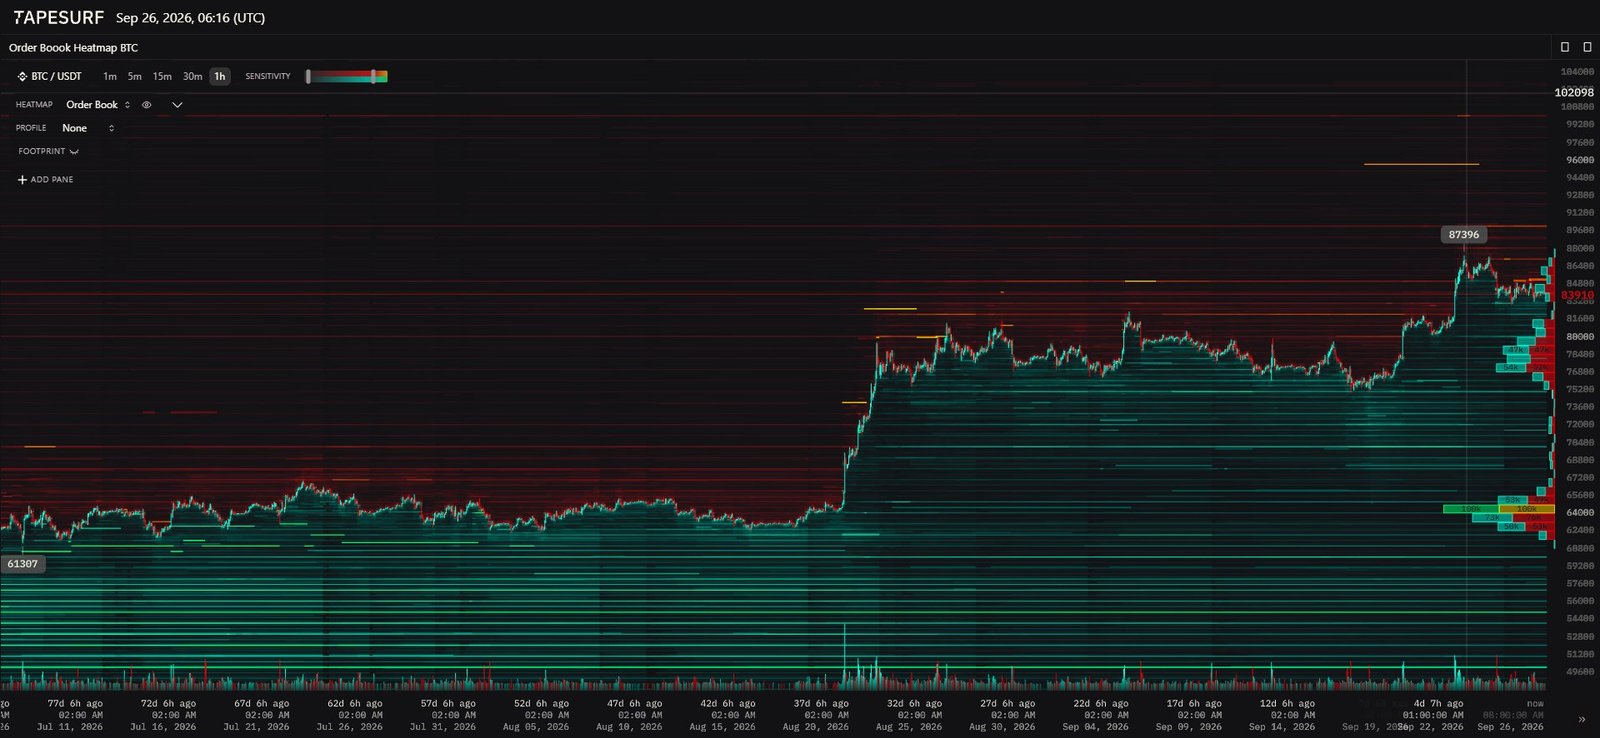
Order Book and Liquidity Heatmap
The market-depth heatmap highlights a marked asymmetry in the placement of liquidity. On the sell side, a first cluster of limit orders sits between $86,800 and $87,500 — matching the scheduled profit-taking of short-term traders — before the book thins out and a wall of exceptional density appears between $96,000 and $102,100, coinciding with massive year-end call-option open interest on Deribit.
On the buy side, the heatmap reveals a dense cluster of limit bids between $82,800 and $83,200 — a floor that has consistently rejected recent downside incursions. Lower down, a secondary support zone spans $78,000 to $80,000, while the absolute macro liquidity floor remains anchored between $64,000 and $65,000, a remnant of August’s accumulation base.
Liquidation mapping shows a critical pocket of short stops above $87,500 — a decisive break there could trigger an impulsive move toward $90,000. Conversely, protective stops on leveraged long positions cluster below $83,000–$82,400, exposing these levels to a tactical liquidity sweep before a trend resumption.
Three Scenarios for the Fourth Quarter
Combining multi-timeframe indicators, order-book data, and the post-expiry derivatives context allows for three quantified forecast scenarios.
Scenario A — Direct Bullish Breakout (60% probability)
A clean break of the $84,400 pivot, accompanied by expanding volume and a bullish turn in the 4H MACD, would absorb sell orders below $87,400 and trigger a cascading short squeeze, propelling price toward the $91,200 resistance ahead of an extension toward the symbolic $100,000 barrier. Execution zone: market buy at $84,500 or on a pullback. Invalidation: a 4H close below $82,800.
Scenario B — Liquidity Sweep (30% probability)
Under pressure from persistently firm bond yields or regulatory friction in Washington, price would temporarily pierce the $83,000 support to flush out late long stops, before finding footing in the dense liquidity band between $81,200 and $82,200 and immediately re-entering the 4H range. Execution zone: limit buy between $81,500 and $82,200. Invalidation: a daily close below $80,000.
Scenario C — Bearish Invalidation (10% probability)
A clean, confirmed break of the $80,500 support would invalidate the bullish continuation structure and trigger a forced deleveraging move toward the 200-day EMA and the quarterly Max Pain zone, between $76,000 and $77,500. Execution zone: short sale below $80,000. Invalidation: a move back above $83,500.
Summary and Conclusion
The technical and contextual assessment of Bitcoin as of September 26, 2026 points to a robust market structure. The pause below $85,000 does not reflect a bearish distribution phase, but a healthy decompression of momentum indicators after an impulsive rally of more than 42%. The successful digestion of the September 25 derivatives expiry, without a break of key accumulation thresholds, shows that structural ETF inflows are effectively absorbing profit-taking.
The dominant technical strategy is to align exposure with the bullish daily trend by exploiting current consolidations: scaled buying within the $81,500–$83,200 support zone, or on confirmed breaks of the $84,400 pivot. Maintaining a protective level below $80,000 would preserve capital while offering an attractive risk/reward profile toward year-end expansion targets between $91,200 and $100,000.
Disclaimer: This article was written for purely educational and informational purposes. It does not constitute investment advice, a recommendation to buy or sell, or a solicitation to trade any financial asset. Cryptocurrency markets are highly volatile; any investment decision should be based on your own research (DYOR) and, where appropriate, the advice of a licensed financial professional.

