


As of August 12, 2026, Bitcoin is trading inside a zone of extreme compression, caught between institutional fundamentals of unprecedented strength and a macroeconomic backdrop loaded with uncertainty. With price oscillating nervously around $63,600, total crypto market capitalization holds between $2.19 and $2.3 trillion. Today’s US CPI print, combined with persistent geopolitical tension and an unprecedented regulatory maturation in Switzerland, sets the stage for what could be a decisive session.
This analysis combines order-book microstructure (heatmap), multi-timeframe technical reading (daily, 4-hour, 15-minute) and an assessment of macro catalysts, in order to map the balance of power between buyers and sellers and identify the pivot levels likely to dictate the next directional move.
1. US CPI: the session’s ultimate catalyst
Global markets are laser-focused on today’s release, Wednesday August 12 at 8:30 AM ET, of the US Consumer Price Index for July. This indicator remains the Federal Reserve’s primary compass for adjusting policy rates, and therefore the leading determinant of the global cost of capital.
A softer-than-expected CPI would give the Fed the empirical justification to continue monetary easing, weakening the dollar and favoring a rotation of capital into risk assets. Conversely, an unexpected inflation resurgence would revive the “higher for longer” narrative, strengthening the dollar and triggering broad profit-taking across equities and crypto alike. This uncertainty fully explains the compressed volatility and range-bound behavior seen in recent days, as institutional players avoid directional positioning ahead of the data.
| Release | Date | Time (ET) | Reference period |
|---|---|---|---|
| Non-Farm Payrolls | Aug 7, 2026 | 08:30 | July 2026 |
| CPI | Aug 12, 2026 | 08:30 | July 2026 |
| PPI | Aug 13, 2026 | 08:30 | July 2026 |
| PCE | Aug 26, 2026 | 08:30 | July 2026 |
The CPI-then-PPI sequence within 48 hours creates a window of potentially extreme volatility, which explains the current liquidity withdrawal visible on order books.
2. Geopolitical tension and the tech decoupling
Developments around the Strait of Hormuz pushed crude oil up 5% to $81.80 a barrel, an energy-cost resurgence that acts as an inflationary feedback loop and complicates the Fed’s task. Bitcoin’s recent pullback from its early-August local highs (near $65,400) is partly attributable to this geopolitical risk premium.
Notably, in Q2 2026 Bitcoin underperformed the Nasdaq-100 (-13.4% versus +27.7%), before the trend reversed sharply in July (+7.5% for BTC versus -6.6% for the Nasdaq). This decoupling illustrates a capital rotation driven by concerns over stretched tech valuations and massive AI-related capital spending, confirming Bitcoin’s occasional ability to act as an asymmetric hedge. Caution remains warranted, however: August has historically delivered an average -4.3% return for Bitcoin.
3. Institutional fundamentals: a solid structural floor
Despite macro pressure, underlying institutional demand keeps building a robust support floor. Net inflows into US spot Bitcoin ETFs reached +$865.3 million over five positive sessions in early August, averaging roughly $186 million per day recently. On-chain data corroborates this: close to 155,000 BTC have been accumulated in the $62,000 range, evidence of institutional algorithmic execution using minor dips to build positions without causing upside slippage.
On the corporate treasury side, MicroStrategy executed a tactical sale of 1,638 BTC (roughly $105 million) to boost cash reserves to $4 billion, while still holding a war chest of more than 840,000 BTC. Meanwhile, the tokenized real-world asset (RWA) ecosystem has grown from just over $1 billion in early 2023 to nearly $37 billion today, of which 44% is tokenized US Treasuries — a maturation that legitimizes the broader crypto ecosystem, with Bitcoin as its primary beneficiary.
4. FINMA Guidance 01/2026: a regulatory game-changer
Published on January 12, 2026, FINMA Guidance 01/2026 strictly frames the custody of crypto-assets in Switzerland. It establishes complete legal protection in the event of insolvency: regulated banks and financial institutions can now offer custody services with a guarantee of asset segregation in case of bankruptcy, under Article 37d of the Banking Act. Segregated assets of this kind are not classified as balance-sheet assets, removing a major economic barrier to adoption by traditional banks.
FINMA also sets a strict equivalence principle for delegating custody to foreign sub-custodians, requiring prudential supervision and insolvency protection comparable to Swiss law. This legal clarity acts as a quiet but powerful catalyst: it neutralizes institutional counterparty risk and underpins the confidence of wealth managers, family offices and ETF sponsors in the asset class.
5. Market microstructure: what the heatmap reveals
Studying the order book through the TapeSurf heatmap maps out latent liquidity. Zones of heavy limit-order concentration act as walls that repel breakout attempts, or as magnets that pull price toward them.
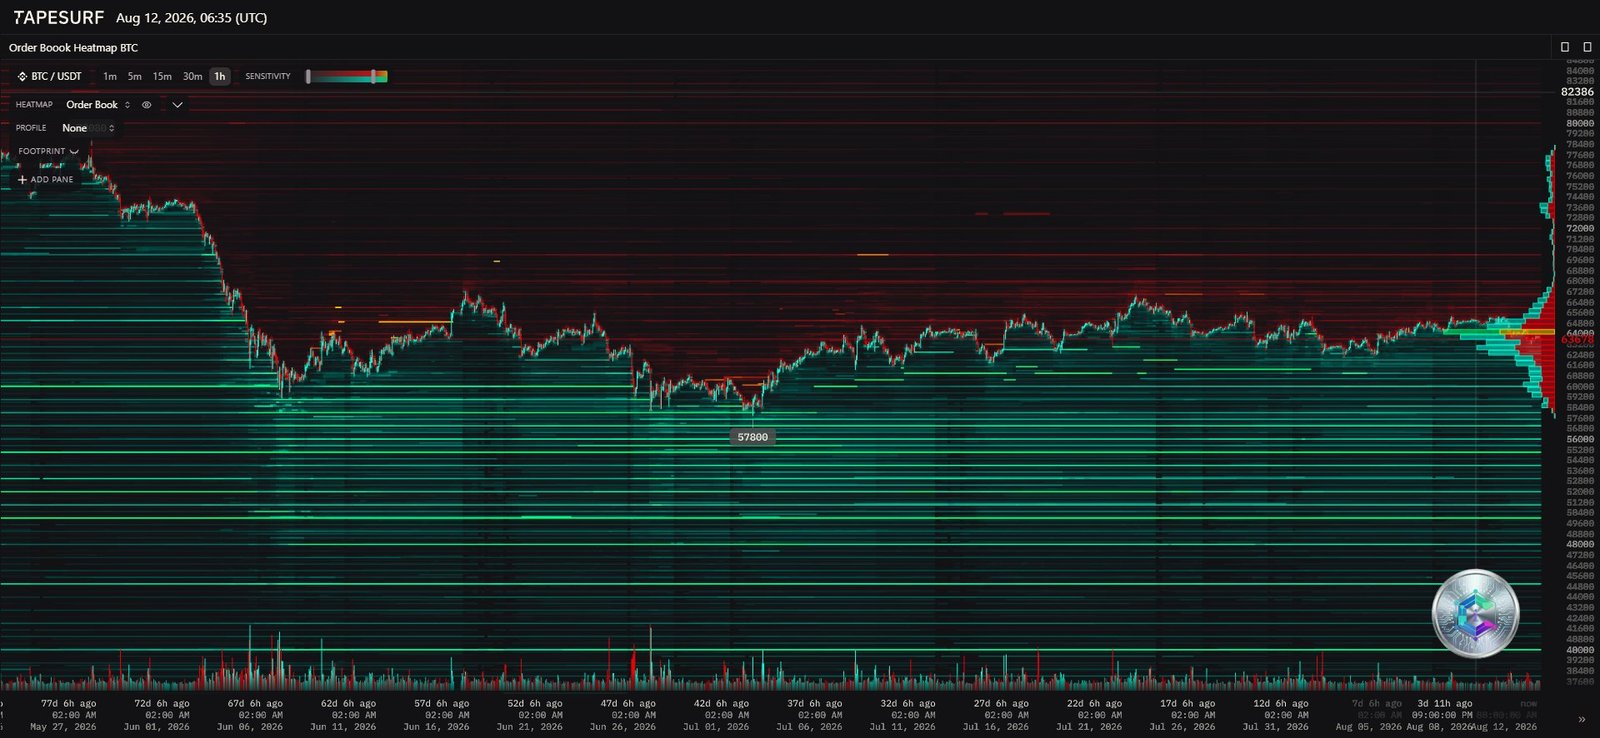
A dense sell zone spans around $64,800, explaining why every rally attempt above $65,000 has been methodically rejected in recent weeks. This sell-side liquidity stems from a confluence of strategic profit-taking, miner operational hedging and, occasionally, spoofing behavior typical of crypto markets.
On the downside, two liquidity cushions stand out: an immediate support around $62,000, aligned with the on-chain accumulation zone, and a deep liquidity pool around $57,800, considered the institutional support of last resort. In the event of a major negative shock, this zone would act as a magnet, flushing out leveraged long positions before offering a base for a massive rebound.
6. Multi-timeframe technical reading
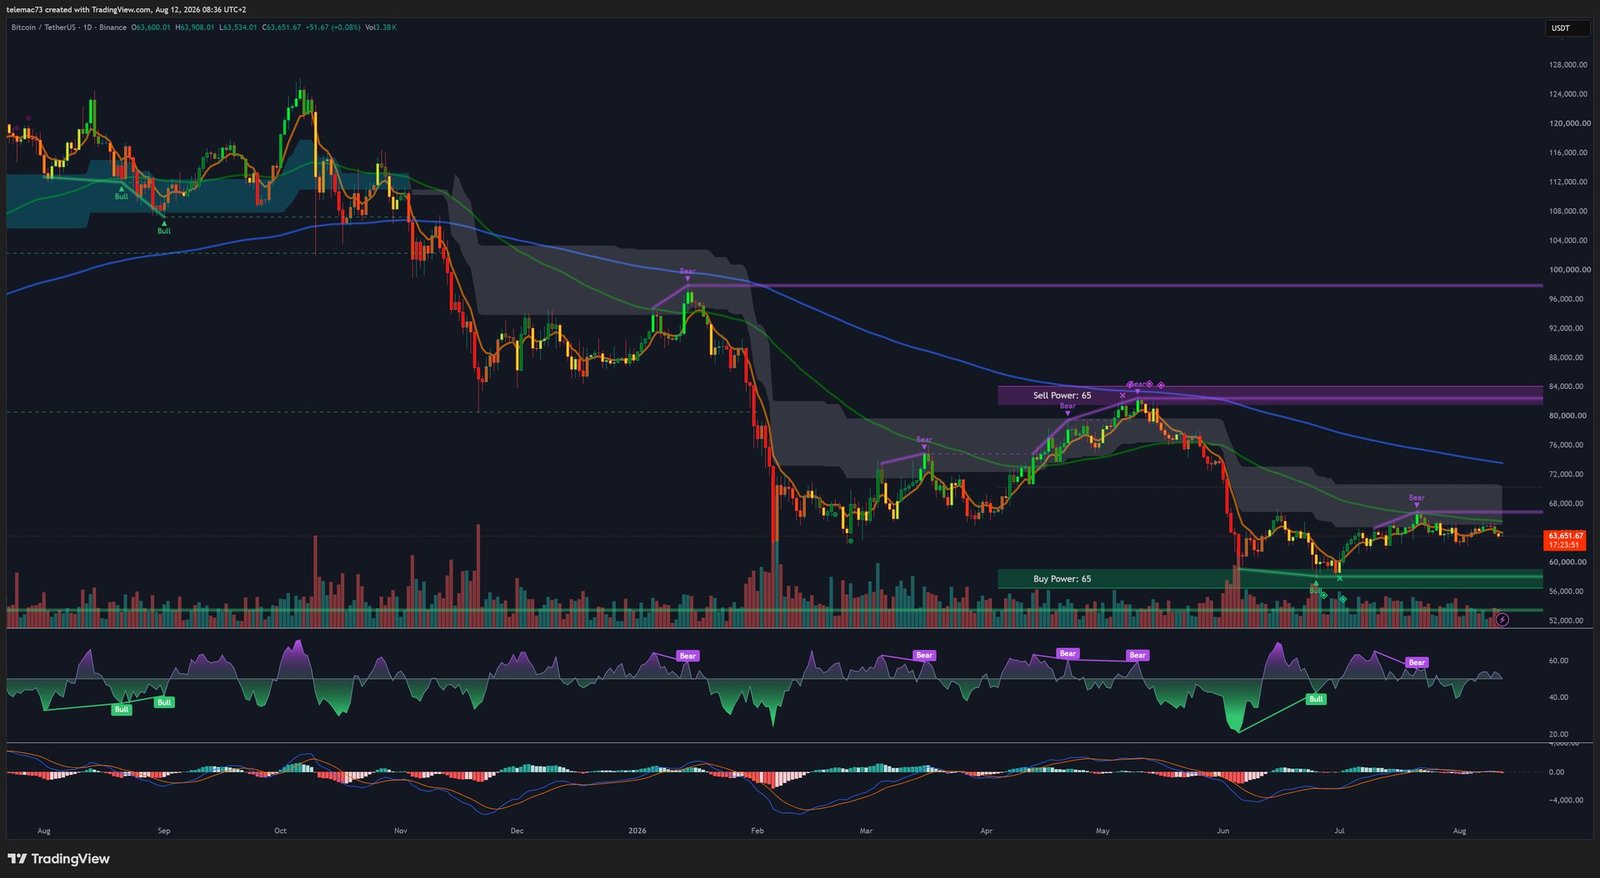
Daily chart (1D): macro compression
Since its all-time highs above $72,000, Bitcoin has been trading inside a wide symmetrical compression triangle. Macro support sits near $56,000 and macro resistance near $70,000. Price is currently testing the major moving average from below, while the daily MACD is rising from deep troughs and converging toward the zero line — a sign of exhausted macro selling pressure. The RSI (14), sitting in neutral territory (40-50), has shown a history of bullish divergence at the $56,000 lows.
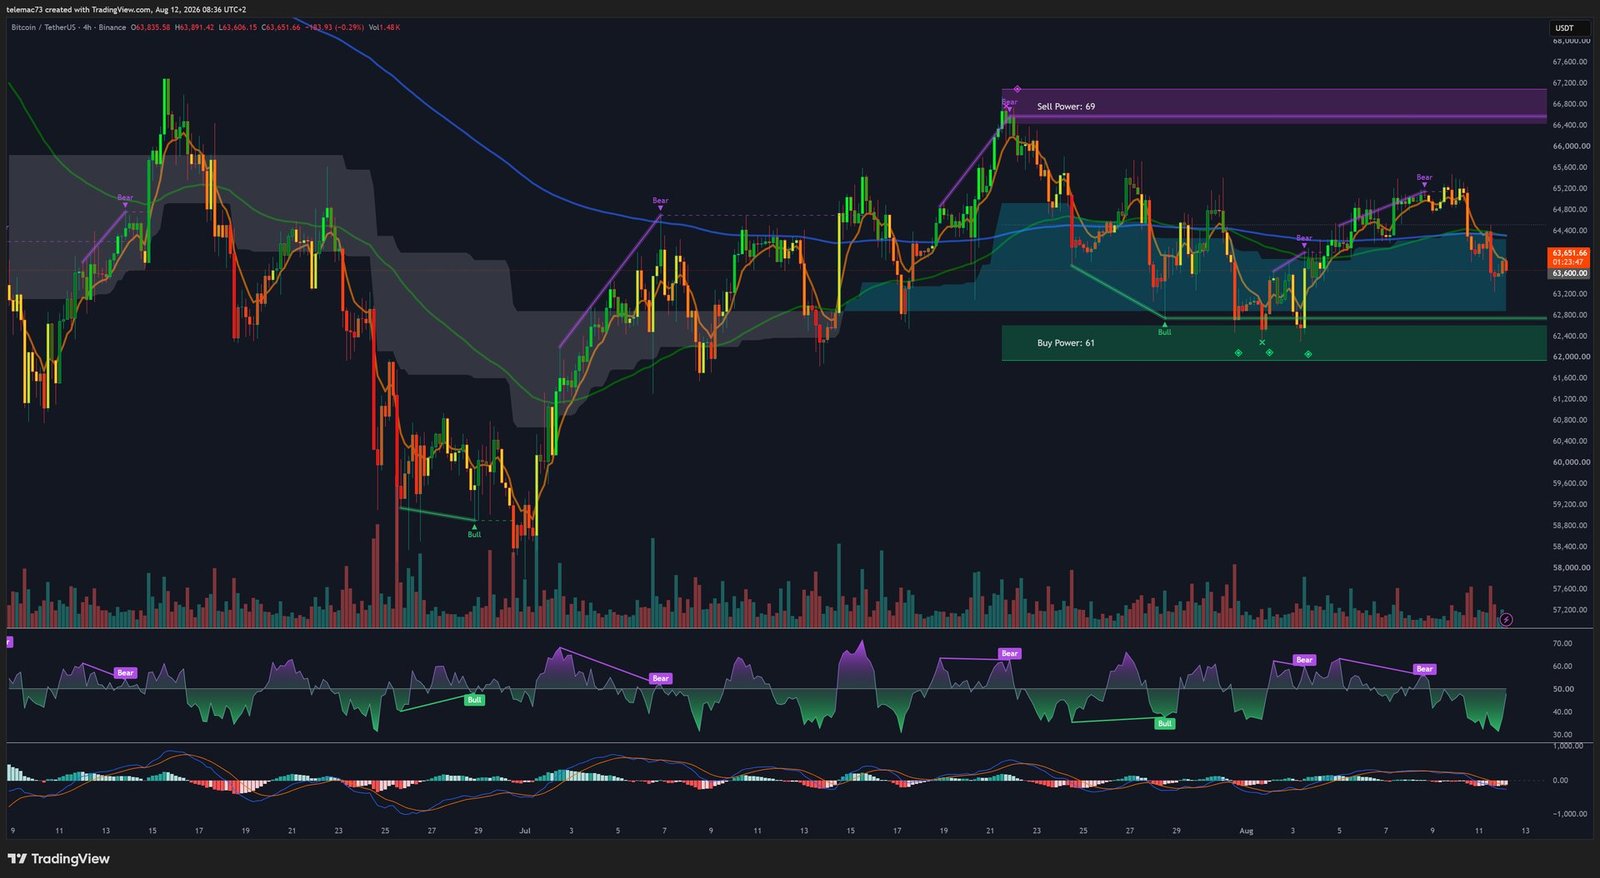
4-hour chart (4H): the critical pivot
On this timeframe favored by institutional and swing traders, a “Sell Power” zone sits between $65,000 and $65,500, while a “Buy Power” zone around $62,000 has worked perfectly as a safety net during the recent correction. Price action has formed a compression pattern (either a bear flag or a symmetrical triangle depending on interpretation), with tightening volatility bands signaling an imminent move. The most concerning near-term signal remains the confirmed bearish MACD crossover on the 4H, confirming exhausted buying momentum at the $65,000 contact zone. The absolute pivot level sits at $63,600: a confirmed close below this threshold would open the path toward $62,000.
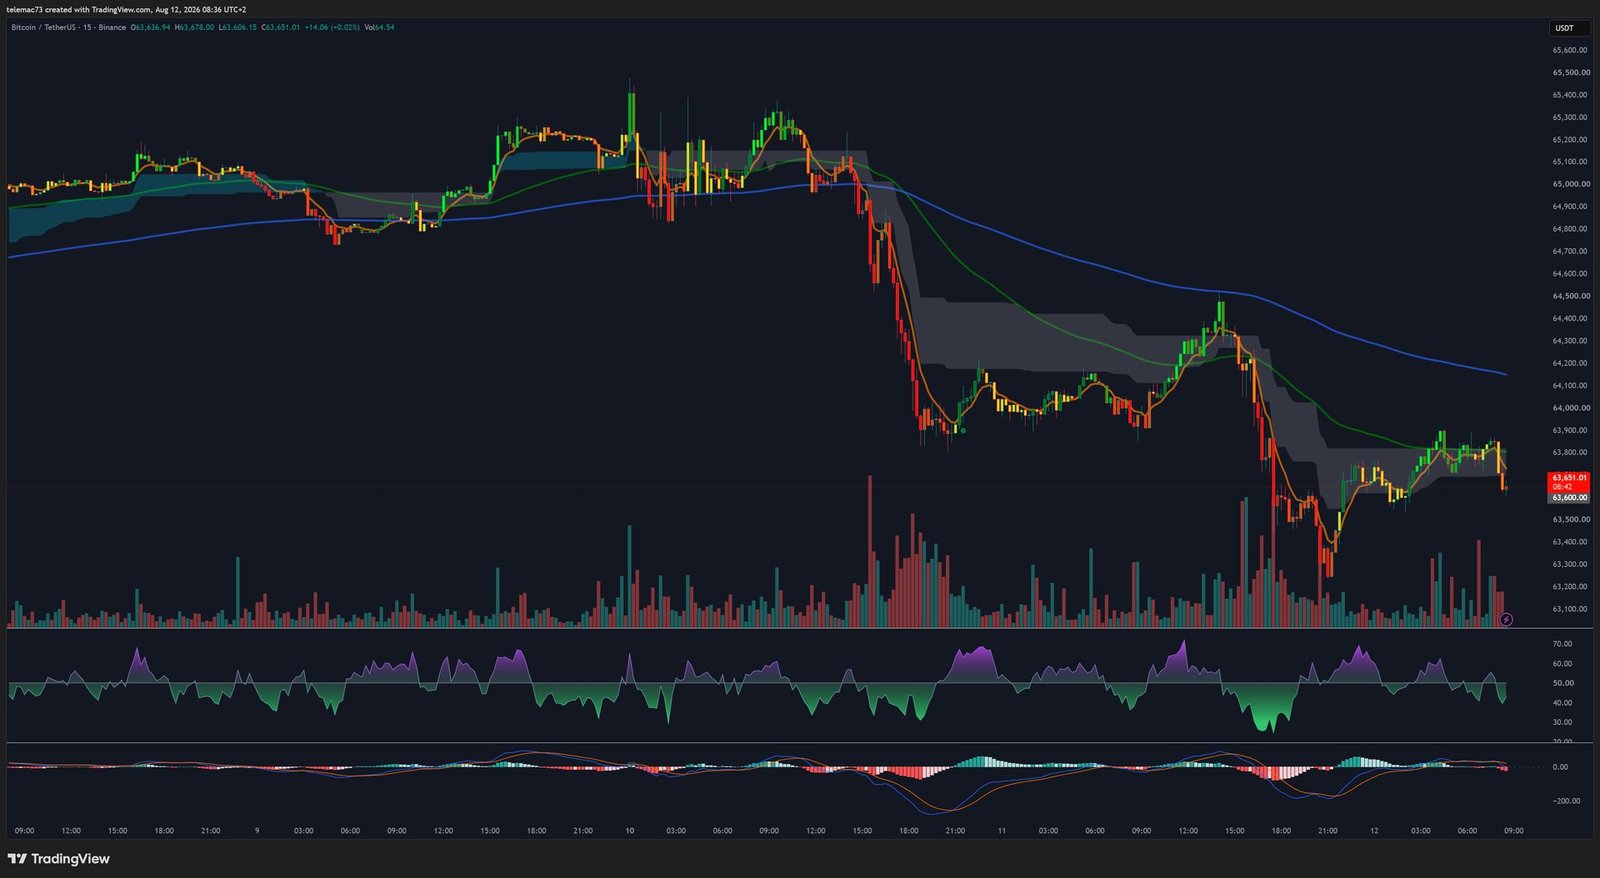
15-minute chart: pre-CPI microstructure
Around $63,651, the market is stuck in a “chop zone” with no clear trend. Price sits below the Ichimoku cloud, confirming the intraday bearish bias. Volumes are notably thin, the 15m MACD oscillates tightly around zero, and the RSI is anchored at 50 — the textbook picture of pre-announcement technical lethargy, where market makers widen their spreads while waiting for the directional shock the CPI print is expected to bring.
7. Two strategic scenarios
Bullish breakout scenario
A softer-than-expected CPI would validate the case for imminent rate cuts. The resulting algorithmic liquidity influx would target the sell wall between $65,000 and $65,600; its absorption would force short sellers to cover, triggering a short squeeze. Chart targets: reclaiming the daily moving average, invalidating the 4H Death Cross, breaking the compression triangle toward $68,000, then $70,000.
Bearish breakdown scenario
Persistent inflation, amplified by rising oil prices, would keep the Fed on a restrictive footing. ETF inflows would dry up, price would fail to reclaim the 4H moving average, and the $63,600 pivot would break. A confirmed close below $62,000 would trigger a cascade of institutional stop-loss selling toward the deep liquidity zone at $57,000-$58,000 — the ultimate institutional accumulation opportunity.
Bitcoin is therefore trading in a highly asymmetric setup: the strength of ETF flows and the new FINMA-validated custody framework guarantee a fundamental floor, but the weight of the macro-oil backdrop and the sell wall above $65,000 require a significant monetary catalyst to launch the next bullish leg. The resolution of this chart compression will be dictated almost immediately by the US inflation data.
Disclaimer: this article is provided for informational and educational purposes only. It does not constitute investment advice, a recommendation to buy or sell, or a financial solicitation of any kind. Cryptocurrency markets are highly volatile and carry significant risk of capital loss. Always do your own research (DYOR) and consult a qualified financial advisor before making any investment decision.

