

XRP hovers near $1, its lowest level since November 2024. Despite a clearly bearish technical setup and negative sentiment on social networks, traders continue betting on a rebound. Derivatives positions reach $2.78 billion and the buy/sell ratio remains favorable.
Key Takeaways
- XRP drops to $1, lowest since November 2024
- Derivatives positions: $2.78B (+2% in 24h)
- Buy/sell ratio of 3.6:1 on Binance and OKX
- Social media sentiment at most negative in 3 months
- Spot XRP ETFs: inflows dropped to zero in late August
Speculation and Derivatives Positions
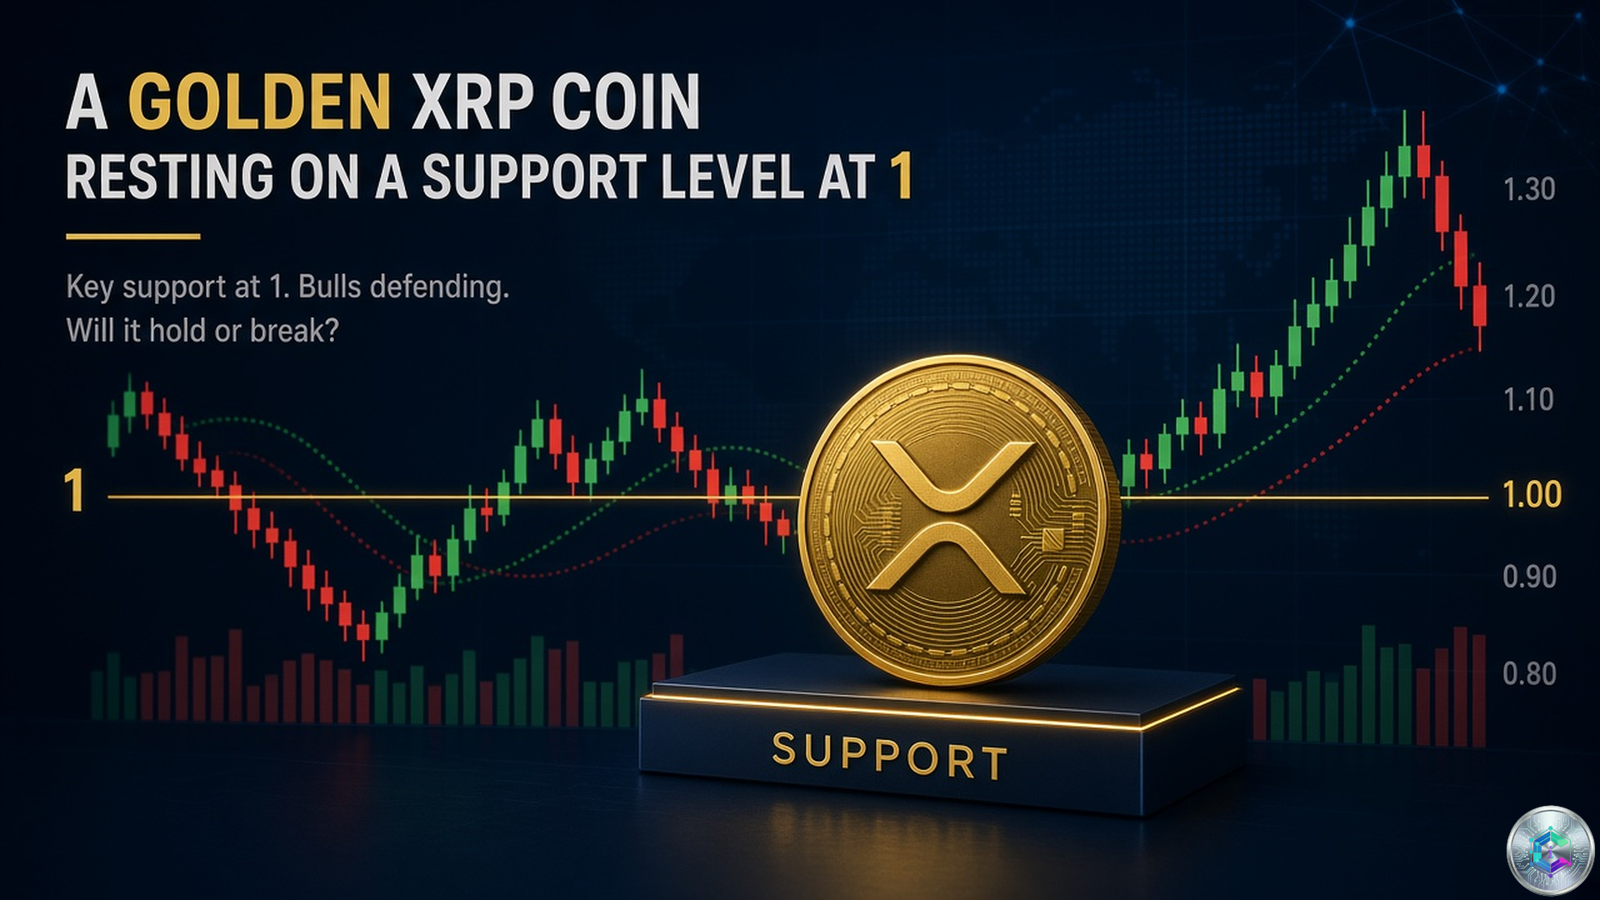
XRP derivatives positions reached approximately $2.78 billion on Monday, up 2% over twenty-four hours, according to CoinGlass data. Trading volume surged by 55% to approximately $1.17 billion over the same period.
On Binance, more than three accounts held long positions for every short position, and the ratio among the platform’s largest traders was approximately 3.6 to 1. Exchange OKX displayed the same ratio of 3.6 to 1. Open interest in tokens stood at approximately 2.77 billion XRP, compared to a level near 2 billion earlier this summer and close to levels observed when the token was worth several times more.
“The 3.6:1 buy/sell ratio on Binance and OKX indicates significant bullish conviction among traders, even as price remains under pressure.”
CoinGlass, market analysis
Technical Setup and Support Levels
Technically, XRP recorded its lowest daily close of 2026, slipping to $1.01 before a modest rebound to approximately $1.03, according to CoinCodex. The currency failed to reclaim the 20-day exponential moving average (EMA 20), accelerating selling, after eight to ten consecutive weeks of rejection at the 50-day EMA (EMA 50).
| Level | Price (USD) | Significance |
|---|---|---|
| EMA 20 resistance | ~$1.15 | Rejected 8-10 weeks |
| EMA 50 resistance | ~$1.20 | Key barrier |
| Current support | 1.00-1.03 | Critical level |
| Weekly support | 1.0085 | Broken confirmed |
| Bearish target | 0.6709 | -33% from $1 |
Support at $1.00-1.03 now constitutes a decisive level. Analyst ChartNerd noted that XRP has officially retested its June low and that the loss of weekly support at $1.0085 leaves fewer support levels nearby. The next major bearish target on the weekly chart lies near $0.6709, representing a decline of approximately 33% from $1.00.
“XRP dominance has broken after two confirmed contacts with a seven-year resistance line. Current dominance stands at 3.3%, with historical support near 1.1% in case of prolonged underperformance.”
ChartNerd, technical analyst
Sentiment and Conflicting Outlooks
However, sentiment on social networks has turned. Comments about XRP on X, Reddit, Telegram and other channels have become the most negative in three months this week, according to on-chain analytics firm Santiment, following the token’s failure to rebound.
Prediction markets are full of skepticism. A Polymarket market tracked on August 3 gave XRP a 56% probability of falling below $1 by August 31, versus a 32% probability of ending above $1.20. The market assigned only 4% chances of ending August above $1.40 and 2% chances of exceeding $1.80. More recently, Polymarket traders set the odds of XRP falling below $1 at 65%, with the token maintaining a consolidation pattern near this level after oscillating around $1 for nearly two months.
| Polymarket Scenario | Probability |
|---|---|
| XRP below $1 | 65% |
| XRP above $1.20 | 32% |
| XRP above $1.40 | 4% |
| XRP above $1.80 | 2% |
Signs of Recovery and Bullish Outlooks
On-chain activity, however, shows signs of recovery. Nearly 50,000 addresses were active over a twenty-four hour period, the highest number in over two months, according to Santiment, after activity had slipped near its 2026 lows in July. Seven-day active addresses increased by 8.1% this week, with an average of 15,200 per day. The XRP Ledger tokenization ecosystem has reached approximately $4.3 billion, highlighting accelerating enterprise adoption.
Momentum indicators show early signs of recovery. XRP’s RSI stood around 44.16, while its moving average was near 53.46. MACD remains slightly bearish, with the MACD line still below the signal line, but the histogram is near neutral. A move above 50 on the RSI would confirm better momentum. Weekly RSI has fallen below the oversold threshold of 30, suggesting the multi-month downtrend appears severely extended.
Some analysts remain optimistic. Egrag Crypto stated that XRP is still following its previous scenario called the “blue path,” arguing that traders should not focus solely on exact numbers, but also on structure, direction, liquidity behavior and macro alignment. The analyst added that XRP’s movement still follows the blue roadmap “almost perfectly.”
“XRP is creating a massive descending wedge structure, a pattern widely recognized by traders as a precursor to powerful bullish rebounds. The $1 level coincides with the Fibonacci 0.786 retracement line, forming a double-layer support zone for buyers.”
Yashu Gola, FXEmpire
Yashu Gola, analyst at FXEmpire, forecast an initial rebound toward the $1.20-1.28 zone, representing a gain of approximately 20 to 30% from current prices, and a 90% upside target toward the $1.88-2.00 zone in case of a confirmed breakout. The analyst noted that Glassnode’s MVRV indicator’s -0.5 standard deviation band currently sits around $0.96, precisely overlapping the psychological support at $1 and the Fibonacci 0.786 retracement line. In 2020 and 2022, XRP price aggressively reached and bounced near this -0.5 standard deviation threshold before reversing its trend.
ETF Flows and Fundamentals
ETF flows offer some relief. According to SoSoValue data, U.S. spot XRP ETFs closed the week with approximately $2.62 million in net inflows. Weekly flows were modest but stood out as Bitcoin ETFs recorded significant outflows over the same period. Cumulative fund flows have reached more than $1.43 billion. JPMorgan additionally reported that XRP recorded the strongest monthly increase in ETF flows as a percentage of assets under management since July 2025, outperforming Bitcoin, Ethereum and Solana.
XRP fundamental data nevertheless shows resilience. XRP’s deflationary tokenomics remains one of its strengths. Over the past 206 days, total XRP supply has dropped from 99,985,726,061 to 99,985,630,555 tokens, representing approximately 95,506 XRP destroyed, or approximately 463 XRP per day.
Conclusion
XRP finds itself at a critical juncture, oscillating around the psychological $1 support level. If XRP breaks below this threshold, leveraged long positions that exhaust their collateral will be closed by the exchange, potentially triggering market selloffs. Open interest has risen back to $2.5 billion, matching the level reached in mid-July, when bulls failed to defend $1.15, triggering a liquidity sweep. XRP fell to $1.03 in early August as this sweep occurred.
Some analysts remain confident in a rebound. Market analyst CryptoBull argued that XRP price “will never trade below $1 again.” Commentator Coach JV took a more cautious view, calling $1 an “incredible buying price” but predicting XRP could still fall further before November, while recommending continuing dollar-cost averaging without leverage or emotional trading. Traders must remain vigilant for a potential break below $1, while keeping in mind the long-term upside potential if technical structure holds.
Sources
- CoinDesk – XRP Traders Bet on a Rebound
- Crypto.news – XRP Price Analysis
- Binance Square – XRP Market Analysis
- PrimeXBT – Polymarket XRP Odds
- CryptoRank – XRP Lowest Close 2026
- FXEmpire – XRP Price Hits $1
This article is published for informational and educational purposes. It does not constitute investment advice in any way. Do your own research (DYOR) before making any decisions.

