


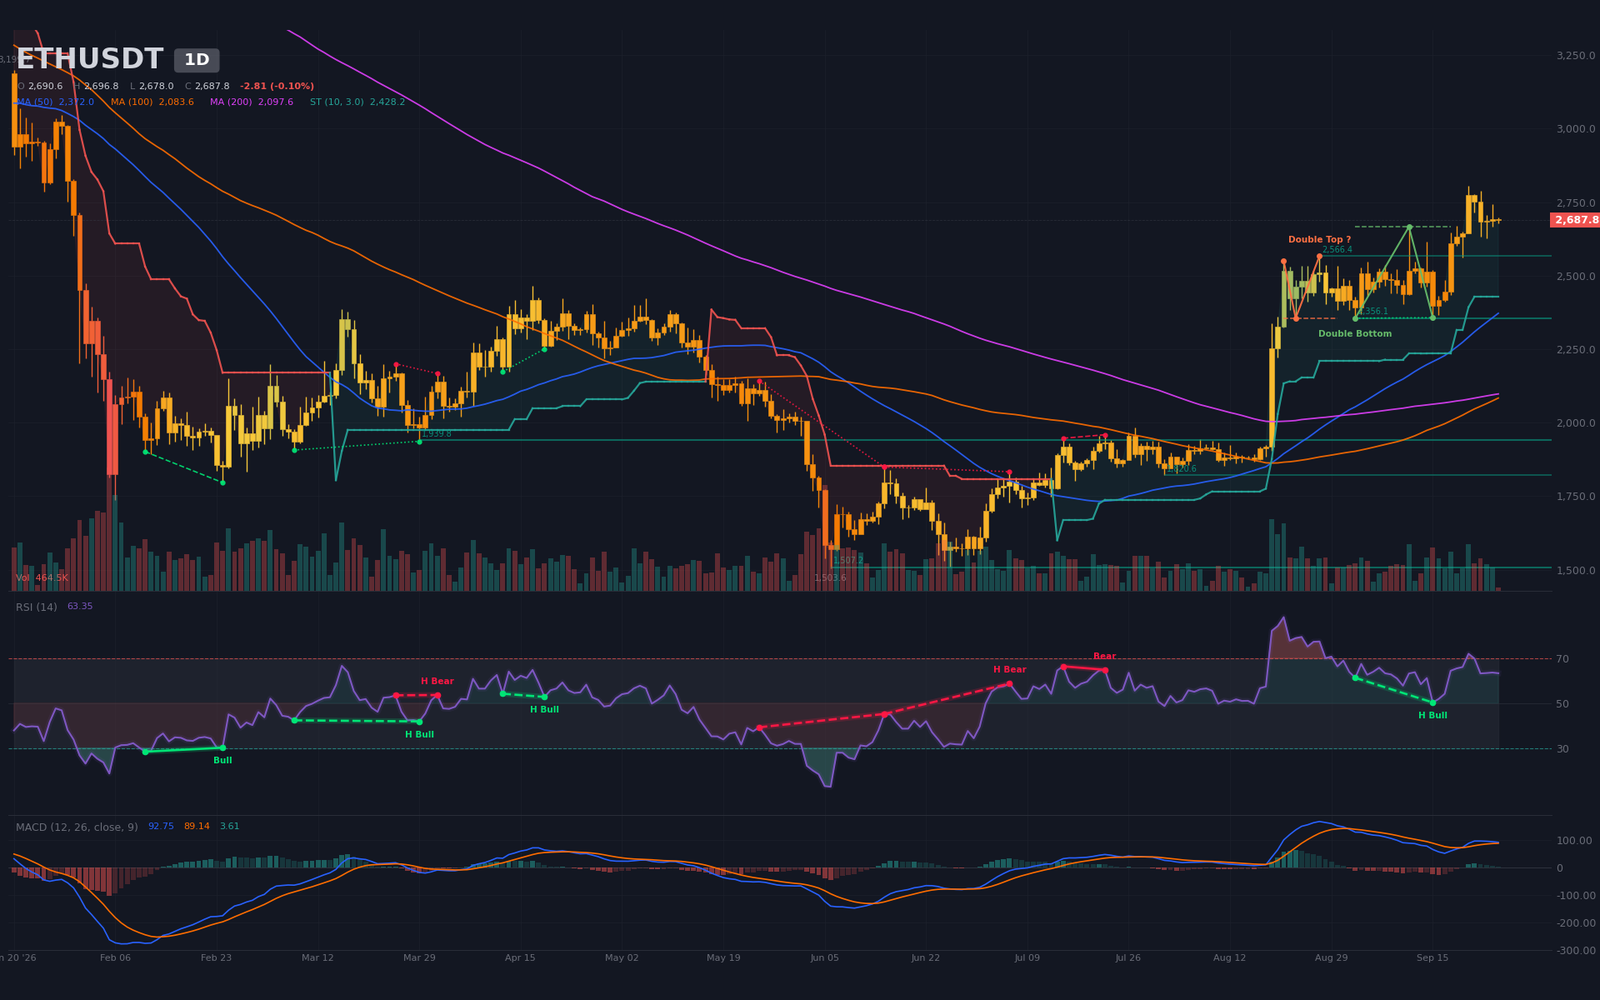
At the close of September, Ethereum trades at $2,687.80 USDT, down 4.25% from the $2,806.80 high touched on September 21 on the daily chart. Today’s candle prints -0.10%, still unfinished at the time of writing. Over twenty sessions, cumulative variation stays positive (+6.93%), but the last five close red (-3.13%), sketching a consolidation phase below the highs within a structurally bullish underlying trend. The period high tops out at $3,199.70, the period low at $1,503.60.
The Deribit quarterly expiry on September 25 (10:00 Zurich) marked the first pivot of the derivatives calendar. According to Decrypt (September 25), the global crypto notional expired reached $15.6 billion, with a sharp pullback in Bitcoin but relative resilience in Ethereum. Open interest contracts (-1.8% over 24h, -3.46% over seven days, to $6.08 billion), signaling gradual deleveraging. Funding at 0.0031% stays neutral, while the global long/short ratio of 2.72 indicates crowded long positioning on retail accounts — a configuration typical of liquidity-sweep risk on any negative catalyst.
On the macro side, the Fed hiked rates by 25 basis points on September 16 (the first increase since 2023) per Decrypt, with a median dot plot at 4.1% for end-2027. The USD/JPY « death cross » flagged by MarketWatch (September 25) and the 10Y Treasuries at 5.23% (CNBC, September 25) outline a restrictive monetary backdrop. The Trump-Xi summit on September 24 (Reuters) produced only a two-month extension of the trade truce — no durable agreement. The SNB’s status quo at 0% (September 24) confirms Swiss monetary easing. On the US labor front, jobless claims on September 24 came in at 197k (consensus 201k) and core durable goods orders on September 25 at 0% (consensus -0.4%), slightly better than expected. On the asset side, the $1.3B ARK Venture fund tokenization on Ethereum via Securitize (The Block, September 24) supports the institutional thesis, while the September 24 Bitget hack (~$387-388M per Decrypt/Bitcoin Magazine, attributed to North Korea) hit primarily ETH, Tron, and USDT.
Within this friction between a bullish structural impulse and a short-term distribution, a multi-timeframe ethereum technical analysis becomes decisive: the next directional move will be settled at the meeting point between a confirmed bullish daily double bottom and a confirmed bearish 4H double top.
Multi-Timeframe Technical Analysis
Daily Timeframe (1D): confirmed bullish double bottom in correction
Ethereum trades above its three daily moving averages: SMA20 at $2,566.5; SMA50 at $2,372; SMA200 at $2,097.6. The 50/200 golden cross (when the SMA50 crosses above the SMA200, signaling long-term trend reversal) occurred on August 31, 2026, twenty-six sessions ago, anchoring a structurally bullish bias. MACD (Moving Average Convergence Divergence) stays positive: line 92.75; signal 89.14; histogram +3.61, expanding, with a bullish crossover dated September 20. The 14-period RSI (Relative Strength Index) at 63, retreating from the 72 peak of September 21, stays neutral without a reversal signal. We note a hidden bullish divergence (continuation) between the September 2 low (price $2,355.1 / RSI 61.3) and the September 15 low (price $2,357 / RSI 50.3): stable price against falling RSI confirms underlying strength.
The dominant pattern is a confirmed bullish double bottom (W-shaped reversal pattern), with a neckline at $2,666 and a technical target of $2,975.9 USD, last pivot on September 15. The recent major swing high stands at $2,806.8 (September 21). Today’s candle posts a volume ratio of 0.12 versus the 20-period average — absent participation in the pullback, which may also signal a lack of aggressive sellers and prepare a technical bounce on the neckline. The current phase is a bullish impulse undergoing a throwback (technical return to the neckline after breakout) before the continuation leg.
Intermediate Dynamics (4H): confirmed double top below resistance
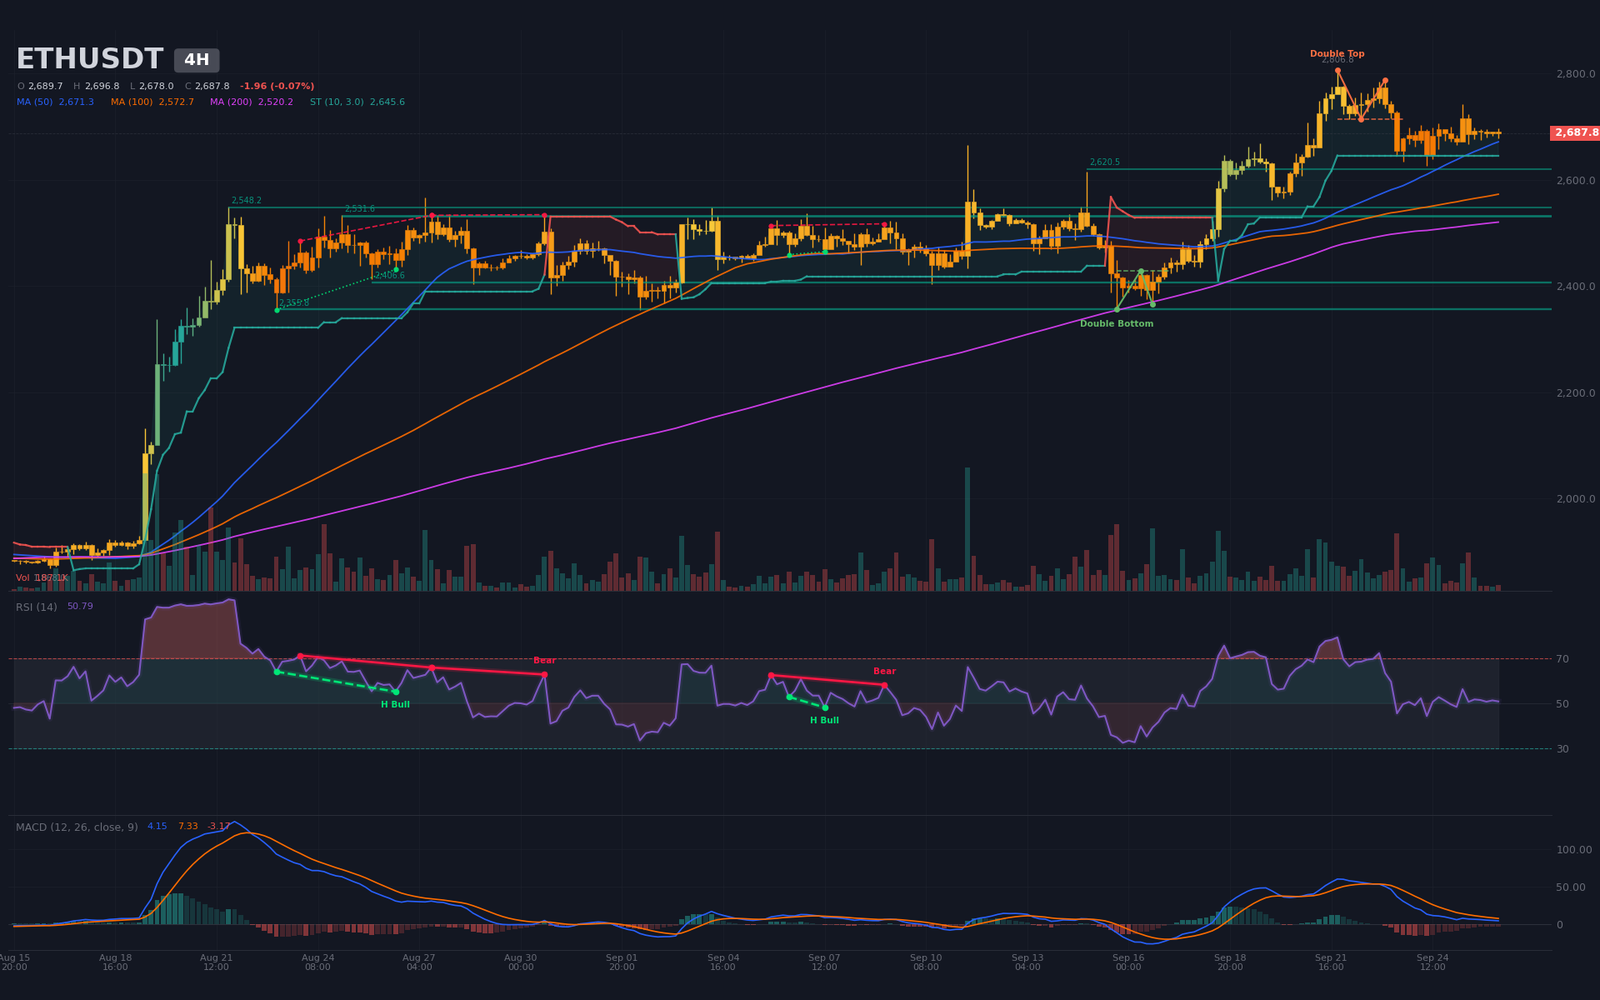
The short-term structure inverts the daily signal. The price ($2,687.8) trades below the 4H SMA20 ($2,688) — by a hair — while remaining above the SMA50 ($2,671.3) and SMA200 ($2,520.2). The 4H MACD shifts to bearish territory: line 4.15 vs. signal 7.33, negative histogram at -3.17, bearish crossover dated September 22 at 20:00 (21 candles ago). The 4H RSI14 at 51 is anchored in neutral territory after peaking at 79 on September 21, signaling a return to equilibrium without fully formed seller excess. Two chart patterns coexist on this timeframe: a confirmed bearish double top (neckline $2,714.4; target $2,631.5; last pivot September 23 at 04:00) and a prior bullish double bottom (neckline $2,429; target $2,497, already exceeded). Swing highs since September 21 print a descending sequence ($2,806.8 → $2,787.8 → $2,742.7 → $2,706), typical of distribution via lower highs. The volume ratio of 0.33 confirms thin engagement. Identified sell walls stand at $2,689.6 ($17.4M), $2,693.1 ($25.1M), and $2,696.5 ($23.0M) — an immediate barrier above price.
Intraday Structure (15m): compression within the $2,626 – $2,742 range
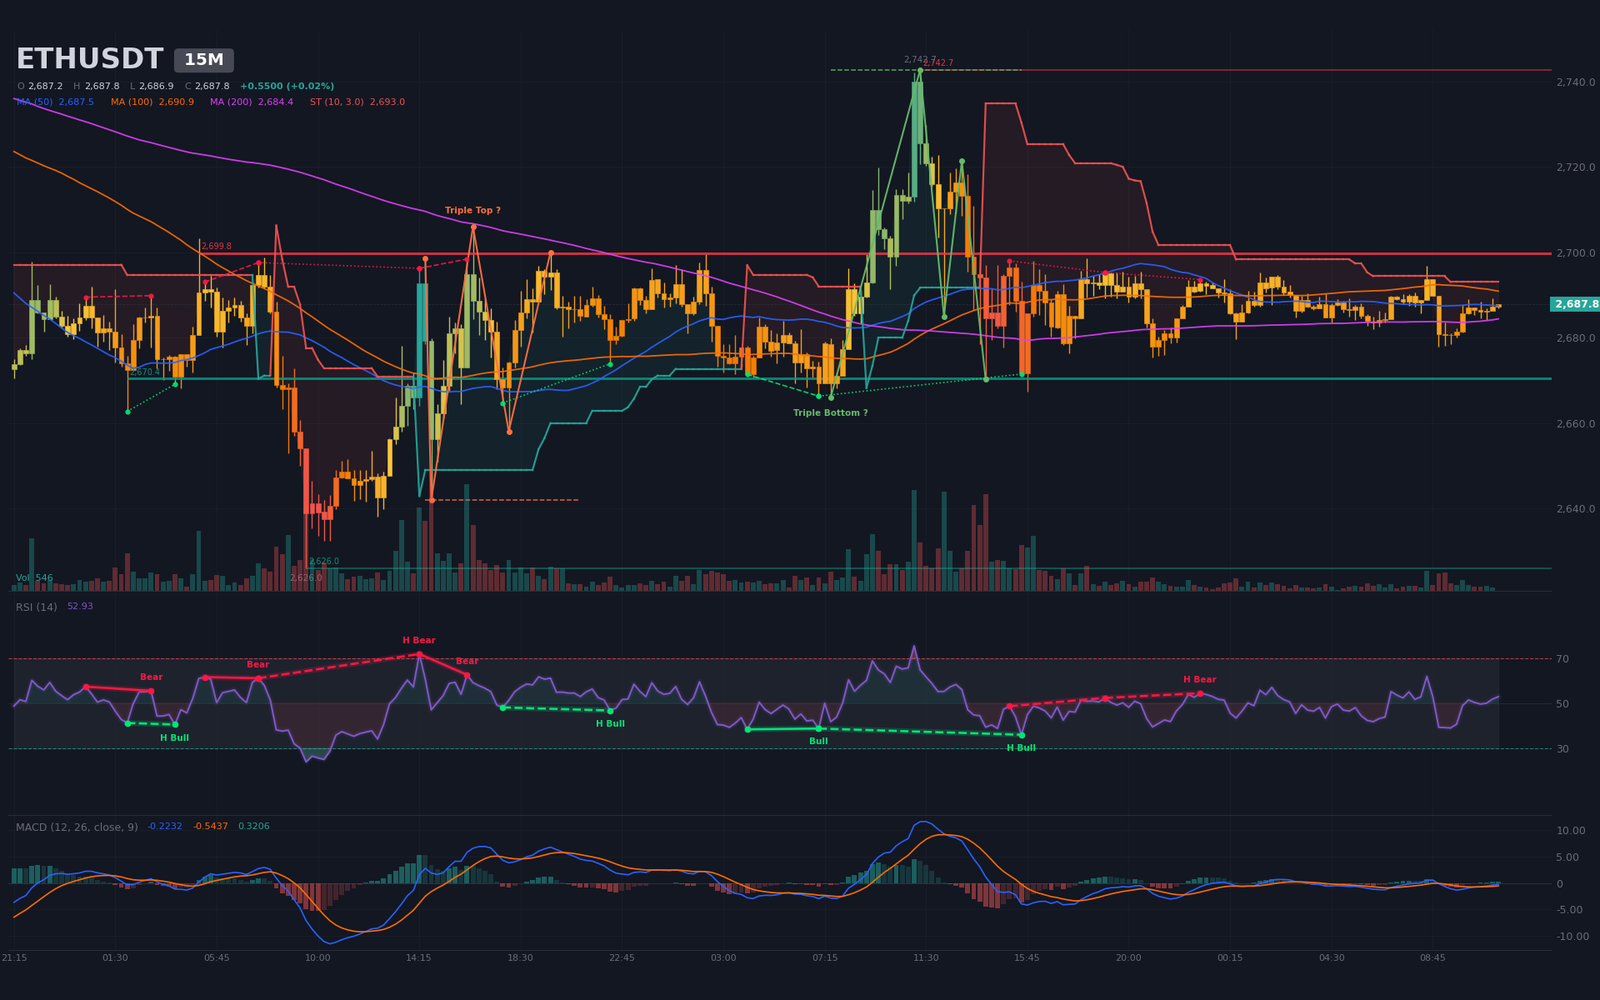
The intraday action trades within a compression range: high at $2,742.7 (September 25 11:15), floor at $2,626 (September 24 09:30). Identified supports lie at $2,670.4 (8 touches) and the immediate resistance at $2,699.8 (8 touches) — the upper edge of the current range. The 15-minute RSI at 53 exits an oversold zone (low at 38.9 at 02:15) without a fully formed bullish excess. The 15-minute MACD just logged a bullish crossover at 10:45 (3 candles): a fresh positive signal, but the histogram remains below zero (+0.32). The volume ratio of 0.05 betrays notoriously anemic activity.
The structure’s quantified bounds: range $2,626 – $2,742; central pivot $2,687.6; R1 $2,688.9; S1 $2,685.9. The 14-period ATR (Average True Range, a measure of average volatility) on the 15-minute timeframe stands at $3.72 (0.14% of price) — volatility extremely contained. The price hesitates below the $2,689-2,696 sell walls without an immediate catalyst: as long as the lower bound at $2,670 holds and the upper bound at $2,700 resists, the intraday structure remains neutral.
Multi-Timeframe Synthesis
The multi-scale reading reveals a hierarchical signal: the daily underlying trend stays positive, the 4H intermediate dynamics stay bearish, and the 15-minute intraday stays neutral. Price trades at the friction point between a structural impulse and a short-term distribution, within a crowded derivatives backdrop.
| Timeframe | Dominant Trend | RSI (14) | MACD | Chart Pattern |
|---|---|---|---|---|
| Daily (1D) | Bullish (consolidation) | 63 | Bullish crossover in place (6 c.) | Confirmed bullish double bottom |
| 4 hours (4H) | Bearish short term | 51 | Bearish crossover stabilizing | Confirmed bearish double top |
| 15 minutes | Neutral (range) | 53 | Recent bullish crossover (3 c.) | No active pattern |
Mapping Technical Levels and Pivots
The mapping combines classic daily pivots (base September 25), estimated liquidation concentrations, pattern-derived targets, SMAs, and swing levels. The short-term central pivot sits in the $2,688 – $2,700 zone (4H SMA20 + daily pivot), where price currently hesitates. Seven key levels articulate the reading of the upcoming sessions, from farthest to most immediate.
| Level | Price (USD) | Category | Technical Basis |
|---|---|---|---|
| R3 | 2,780 – 2,810 | Major resistance 3 | Daily swing high $2,806.8 (9/21) + liquidation pocket peak $2,783 + daily double bottom extension $2,975.9 |
| R2 | 2,740 – 2,760 | Major resistance 2 | 4H swing high $2,742.7 (9/25) + daily R1 $2,733.5 + sell wall $2,744.9 |
| R1 | 2,696 – 2,714 | Immediate resistance | Daily pivot $2,699.7 + 4H double top neckline $2,714.4 + 4H SMA20 $2,688 |
| P | 2,683 – 2,690 | Central pivot | Spot price $2,687.8 + 4H SMA20 $2,688 + best bid $2,686.1 ($17.0M) |
| S1 | 2,656 – 2,670 | Immediate support | Daily S1 $2,656.8 + 15m support $2,670.4 (8 touches) + 4H SMA50 $2,671.3 |
| S2 | 2,620 – 2,634 | Major support 2 | Daily S2 $2,623.1 + 4H support $2,620.5 (2 touches) + 4H swing low $2,633.7 (9/23) + liquidation pocket peak $2,620.4 ($44.9M) |
| S3 | 2,530 – 2,548 | Major support 3 | 4H support $2,548.2 (2 touches) + 4H support $2,531.6 (4 touches) + liquidation pocket peak $2,537.4 ($56.5M) |
Order Book and Liquidity Heatmap
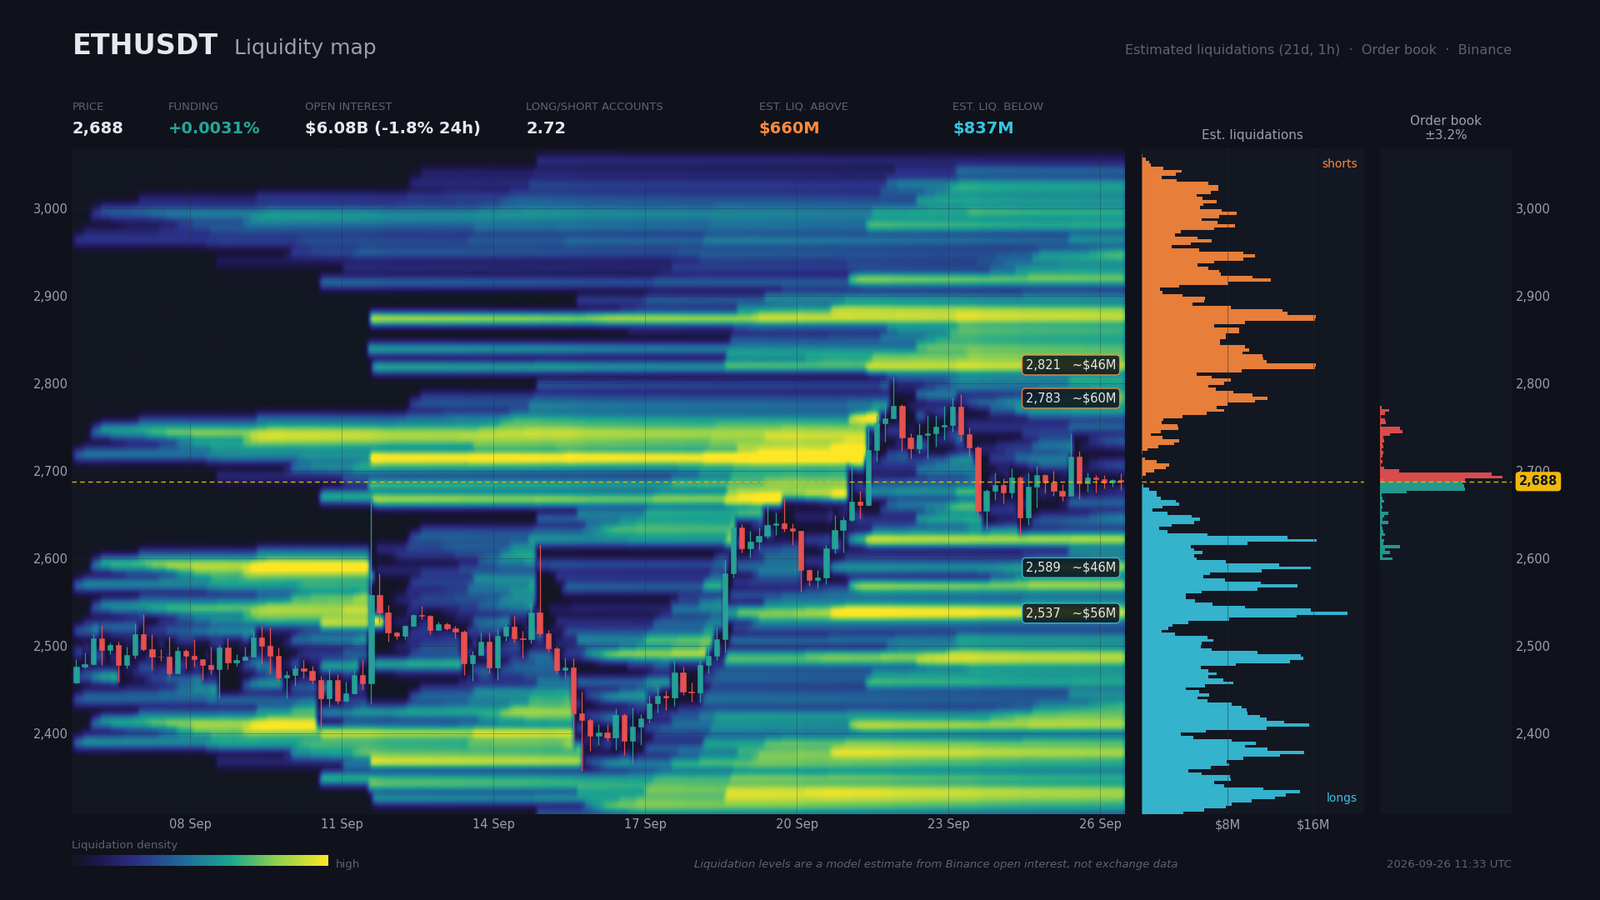
The visible Binance order book coverage is only 3.21% — beyond that, information is not published. The global imbalance stands at -7.5% in favor of asks. On the buy side, walls stack from $2,686.1 ($17.0M, -0.06%) down to $2,675.8 ($5.4M, -0.45%), with a dense concentration around $2,682-2,679 (≈ $52M cumulative). On the sell side, two large walls frame the $2,689-2,696 zone ($17.4M + $25.1M + $23.0M = $65.6M), forming a thick barrier just above the price. A bearish liquidity sweep (rapid hunt of clustered stop-loss orders) below $2,682 would mechanically trigger stops and expose the $2,670 / $2,656 zone.
On derivatives, the funding rate (the periodic payment exchanged between long and short perpetual contract holders to keep the contract price anchored to spot) at 0.0031% (3.4% annualized) stays neutral — no directional premium. Open interest at $6.08B contracts (-1.8% over 24h, -3.46% over 7 days): leverage drains, reducing the amplitude of the next sweep moves. The global long/short ratio of 2.72 (top traders 1.633; taker buy/sell 0.973) signals crowded long positioning on retail accounts while top desks remain moderately long — a setup exposed to a bearish short squeeze (rapid forced unwinding of crowded longs) on a negative catalyst.
The model-estimated liquidation zones skew the profile: $659.6M above (main cluster $2,774-2,795, peak $2,783, $60.2M, +3.54%) versus $837.2M below — a triple cluster at $2,537 / $2,589 / $2,620, a dominant bearish magnet. Consequence: as long as price stays below $2,742 (R2) and open interest keeps contracting, the statistical probability of a purge below $2,620 remains higher than a breakout above $2,783. The bullish Scenario A requires an OI expansion; otherwise, range trading prevails.
Calendar: Catalysts to Watch
The macro and crypto calendar over the next ten days concentrates the bulk of Ethereum’s directional potential. One appointment dominates: the Core PCE (Personal Consumption Expenditures, the Fed’s preferred inflation gauge) on September 30, consensus 0.3% MoM — an upside deviation would reopen the door to monetary tightening and weigh on risk assets. The NFP on October 2 (consensus 100k) constitutes the second major pivot.
- 30 sept. 14:30 (Zurich) — Core PCE MoM: consensus 0.3% / previous 0.2% — Fed stakes: a print above 0.3% would reignite the bearish purge, a moderate print would reignite the daily bullish leg.
- 30 sept. 14:30 (Zurich) — GDP QoQ final: consensus 1.6% / previous 2.1% — confirmation of US slowdown.
- 01 oct. 16:00 (Zurich) — ISM PMI: consensus 54.8 / previous 54.6 — manufacturing barometer, a print below 54 would confirm disinflation.
- 02 oct. 14:30 (Zurich) — NFP: consensus 100k / previous 162k — a break below 100k would amplify slowdown fears and paradoxically the easing thesis.
- 02 oct. 14:30 (Zurich) — Unemployment Rate: consensus 4.2% / previous 4.1% — a slip feeding the stagflation narrative.
Three Scenarios for the Coming Weeks
Three trajectories emerge over a four-to-six-week horizon, organized around dated catalysts and identified technical levels. The base case (Scenario B, 45%) is the prolongation of the current compression, as long as open interest keeps declining and funding remains neutral.
Scenario A — Bounce toward $2,780+ (probability 35%)
This scenario assumes survival above the 4H pivot ($2,688) and a 4H breakout above $2,742 (September 25), with possible confirmation after the Core PCE on September 30 if it lands at consensus. Trigger: 4H close above $2,742.8 combined with an intraday R3 breakout at $2,699.8. Trajectory: $2,688 → $2,714 (neckline) → $2,742 → $2,780 (R3 + liquidation pocket) → $2,810 (daily double bottom extension). Execution zone: $2,656 – $2,700 (S1 daily to daily pivot). Invalidation: daily close below $2,566.5 (loss of daily SMA20) or 4H close below $2,620 (range exit to the downside). Stop: 1× 4H ATR14 (35.8) below $2,656 = $2,620.2; R:R on target $2,810 = (122 / 68) = 1.79, above the operational threshold of 1.5.
Scenario B — Bearish compression $2,620 – $2,742 (probability 45%)
Base case in the absence of a directional catalyst before the NFP on October 2. Trigger: range trading between $2,670 (15m support) and $2,714 (4H double top neckline). Trajectory: $2,688 → oscillation $2,656-2,714 → neutral base case. In case of a hawkish Core PCE (signaling tighter monetary policy) on September 30: extension toward $2,620 (daily S2). Execution zone: $2,696-2,714 (short rejection zone). Invalidation: 4H close above $2,742 (Scenario A activated) or below $2,620 (Scenario C activated). Stop: 1× 15m ATR14 (3.7) above $2,718 or daily close above $2,750.
Scenario C — Breakdown toward $2,530 – $2,580 (probability 20%)
This scenario activates on a bearish NFP surprise (October 2), a post-Trump-Xi geopolitical escalation, or a forced liquidation shock. Trigger: 4H close below $2,620 (loss of daily S2 + 4H support + liquidation peak $2,620.4). Trajectory: $2,688 → $2,656 → $2,620 → $2,589 (liquidation pocket) → $2,537 (major pocket -5.6%, $56.5M). Execution zone: $2,620-2,634 (technical sell stop). Invalidation: daily close above $2,714 (recovery of double top neckline). Stop: 1× daily ATR14 (97.3) above $2,656 = $2,753; R:R on $2,537 = (151 / 65) = 2.3, an attractive asymmetric setup on a confirmed bearish catalyst.
Synthesis and Conclusion
Ethereum navigates a phase typical of a bullish structural impulse in correction: the daily structure remains prioritized (confirmed double bottom, 50/200 golden cross, price above all three SMAs), but the 4H short term displays a bearish distribution (confirmed double top, MACD below its signal). The liquidation imbalance ($837M below $2,620 vs. $660M above $2,774) constitutes a structural bearish magnet that only a return of risk appetite — via a soft PCE on September 30 and a soft NFP on October 2 — could neutralize.
The dominant technical strategy is to sell rallies toward $2,700-2,714 with a stop above $2,742 (target $2,620); tactically, do not buy below $2,656 without a daily reversal signal. Positioning stays defensive as long as the L/S ratio of 2.72 persists and open interest keeps contracting. Five critical levels organize the watchlist: $2,714 (4H double top neckline, active direction), $2,620 (daily S2 pivot + liquidation cluster, Scenario C activation), $2,742 (upper 15m range bound / 4H swing high), $2,780 (liquidation peak + daily R3, bullish magnet), and $2,537 (major bearish liquidation pocket).
Sources
- Bitget Hack Losses Climb to $387M: Here’s What Happened — Decrypt, September 25, 2026
- North Korean Hackers Linked to $388M Bitget Hack — Bitcoin Magazine, September 25, 2026
- Circle and Tether Freeze Stablecoins Tied to Bitget Hack — Decrypt, September 25, 2026
- ARK Invest brings $1.3 billion venture fund onchain through Securitize — The Block, September 24, 2026
- Four takeaways from Trump’s summit with Xi in Washington — Reuters, September 24, 2026
- Bond market alarms are ringing on Wall Street — CNBC, September 25, 2026
- A ‘death cross’ is coming for the dollar. Why Trump will be happy. — MarketWatch, September 25, 2026
- SEC Commissioner Hester Peirce to leave post on Oct. 2 — Cointelegraph, September 26, 2026
- Bitcoin ETFs Extend Winning Streak With Nearly $3B in Inflows — Bitcoin Magazine, September 25, 2026
- Bitcoin Rally Slows as $15.6 Billion Options Expiry Hits — Decrypt, September 25, 2026
Disclaimer: This article is for educational and informational purposes only. It does not constitute investment advice, a recommendation to buy or sell, or an invitation to trade any financial asset. Cryptocurrency markets are extremely volatile; any investment decision should be based on your own research (DYOR) and, where appropriate, the advice of a licensed financial adviser.

