


Bitcoin is currently trading around $77,450, following a spectacular breakout that pulled it out of a prolonged consolidation range between $57,000 and $64,000. This rally is no accident: it stems from the convergence of three major forces — a macroeconomic backdrop in the middle of a pivot, an unprecedented Swiss regulatory framework, and a multi-timeframe technical structure now approaching a critical decision point around the $80,000 threshold.
The Macro Tug-of-War: The Fed vs. Market Resilience
Since the approval of spot Bitcoin ETFs, institutional investors have increasingly treated the asset as a fully-fledged macro instrument, on par with equities or sovereign bonds. Its sensitivity to Federal Reserve signals has grown accordingly.
The June 2026 FOMC minutes, under new Fed Chair Kevin Warsh, came in more hawkish than expected: rates were held at 3.50%–3.75% for a fourth consecutive meeting, and 9 of the 18 committee members still projected at least one more hike before year-end. This tone kept Bitcoin capped under $64,000 resistance for an extended period. The 52-week correlation between BTC and the US Dollar Index (DXY) settled around -0.85, reaffirming Bitcoin’s role as a global liquidity barometer.
The picture grew more complex after a ceasefire collapse in Iran reintroduced an inflationary energy-price risk. On the other hand, weaker-than-expected US jobs data revived hopes of monetary easing, pushing bond yields and the dollar lower — a favorable backdrop for risk assets. Vocal pro-crypto positioning from prominent US political figures added a further confidence premium, contributing to roughly $190 billion added to the total crypto market cap within a few sessions.
Switzerland Sets the Regulatory Standard: FINMA Guidance 01/2026
While other jurisdictions — the US Clarity Act remains stalled in Congress — stay mired in legislative uncertainty, Switzerland’s FINMA published Guidance 01/2026 on crypto-asset custody on January 12, 2026. The framework mandates strict bankruptcy-remote segregation of assets, military-grade private key governance, and tight restrictions on delegating custody to foreign sub-custodians.
In practice, self-custody is no longer viewed as a realistic option for regulated institutions, pushing the market toward bank-grade third-party custodians. By largely removing systemic counterparty risk, this regulatory maturity acts as a structural catalyst for institutional capital flows — helping explain the strength of the support wall observed around $64,000.
ETF Flows and On-Chain Clusters: Mapping Institutional Capital
After weekly net outflows peaking at $1.55 billion in May-June and a Fear & Greed Index score of 10 (extreme fear) near $58,400, the market reached a textbook capitulation inflection point. Flows reversed sharply in early July, with $221.7 million in single-day net inflows into US Bitcoin ETFs.
On-chain analysis reveals two critical structural zones: a massive cost-basis cluster at $70,900 (142,820 BTC accumulated), which served as the launchpad for the current breakout, and a short-squeeze risk cluster at $83,500 (312,158 BTC in short positioning), which stands as the natural magnetic target for the ongoing move.
Order Book Heatmap: The $80,000 Magnet
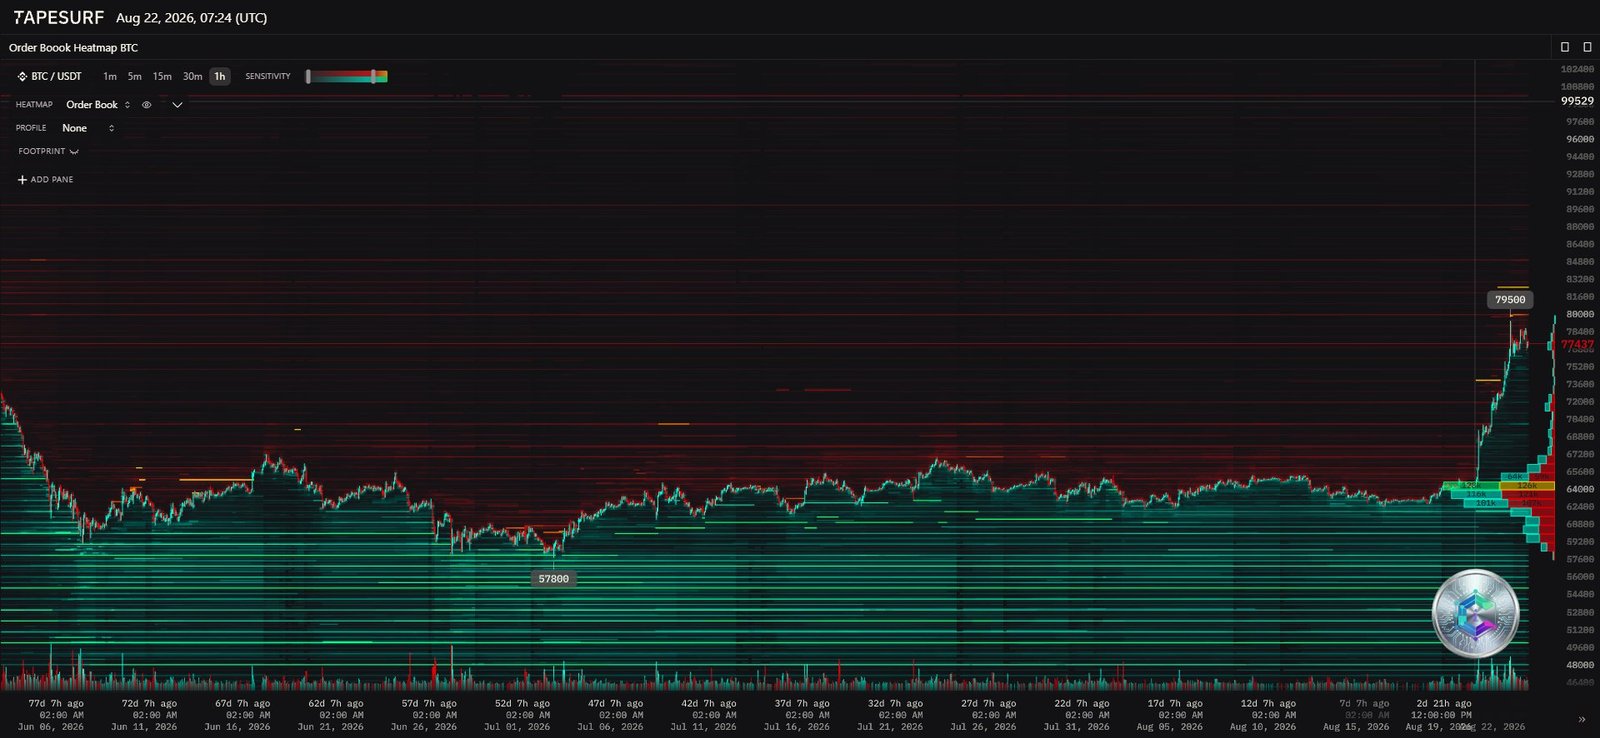
The market-depth heatmap shows a strongly asymmetric liquidity picture. A dense ask wall sits between $79,500 and $80,000, showing up as a sharply defined scarlet-red band. In such an impulsive uptrend, a wall like this behaves less like a rejection ceiling and more like a magnet: large institutional buyers need this exact counterparty depth to execute sizeable market orders without excessive slippage on their average entry price.
Below current price, the picture is more concerning: the $72,000–$76,000 zone shows a relative shortage of resting bids, a “liquidity void” created by the sheer speed of the recent rally. Should price be rejected at $80,000, this void could accelerate a fast correction back toward the more solid support at $70,900, or even $64,000.
Daily Chart: The Primary Trend Remains Bullish
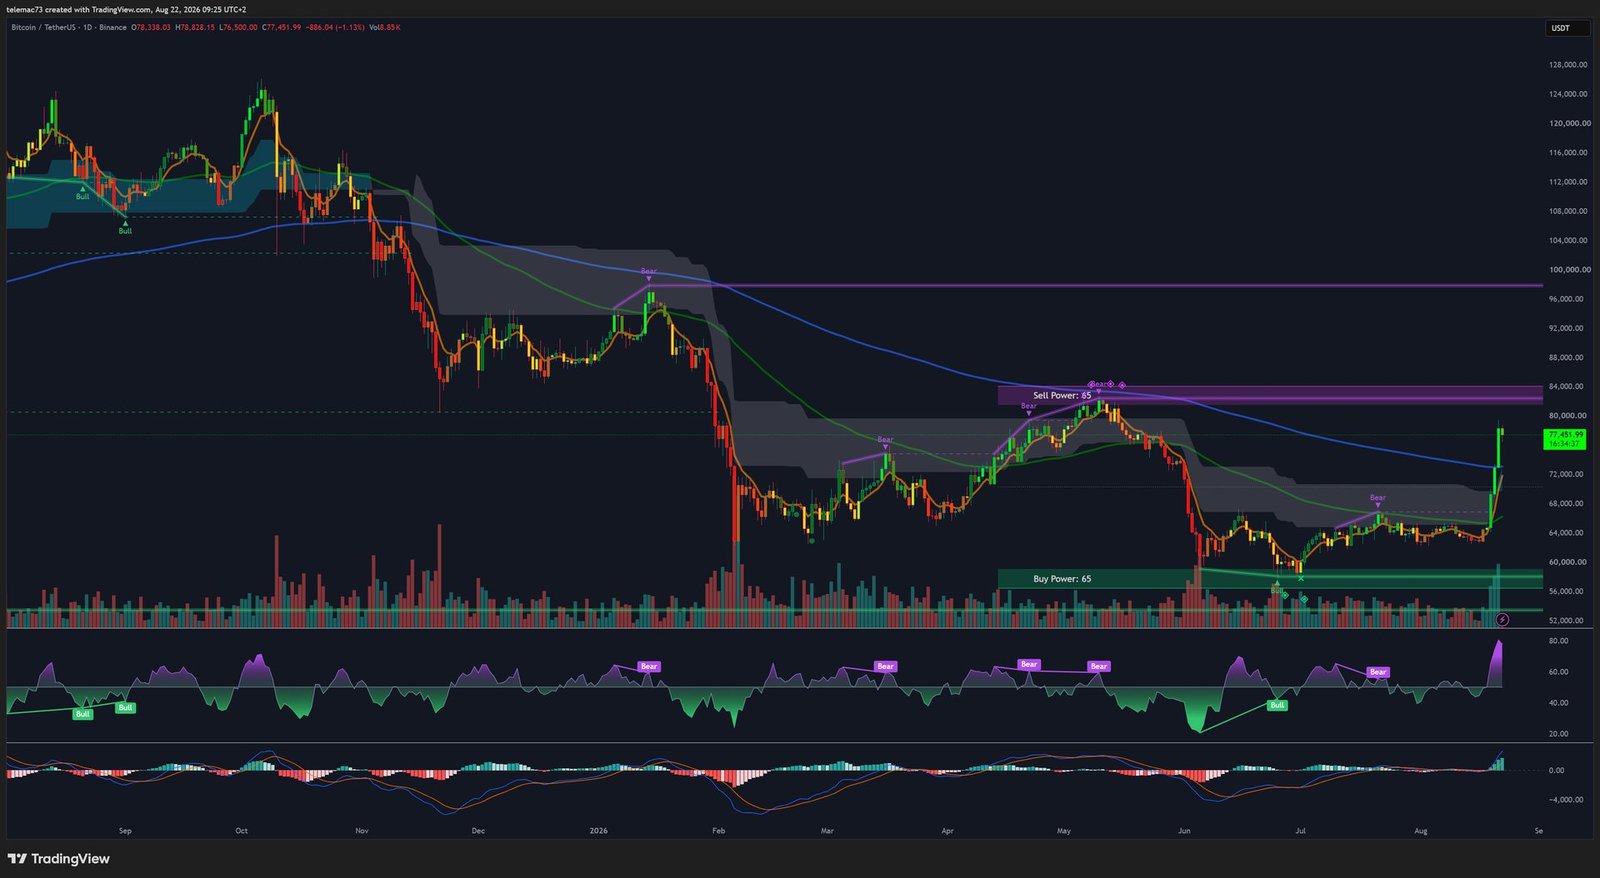
On the daily chart, Bitcoin confirmed a bullish paradigm shift by reclaiming all of its key simple moving averages (50, 100 and 200-day), with a firmly established Golden Cross. The MACD shows continuous positive expansion with no sign of exhaustion so far. The daily RSI is approaching overbought territory (70), though it’s worth noting that during Bitcoin’s typical parabolic phases, this indicator can stay pinned there for weeks without invalidating the trend.
Major resistance sits in the $80,000–$84,000 corridor, while the structural pullback support has now shifted up to the $65,000–$68,000 zone, a former ceiling turned support under the principle of polarity.
4-Hour Chart: Overheating That Calls for Caution
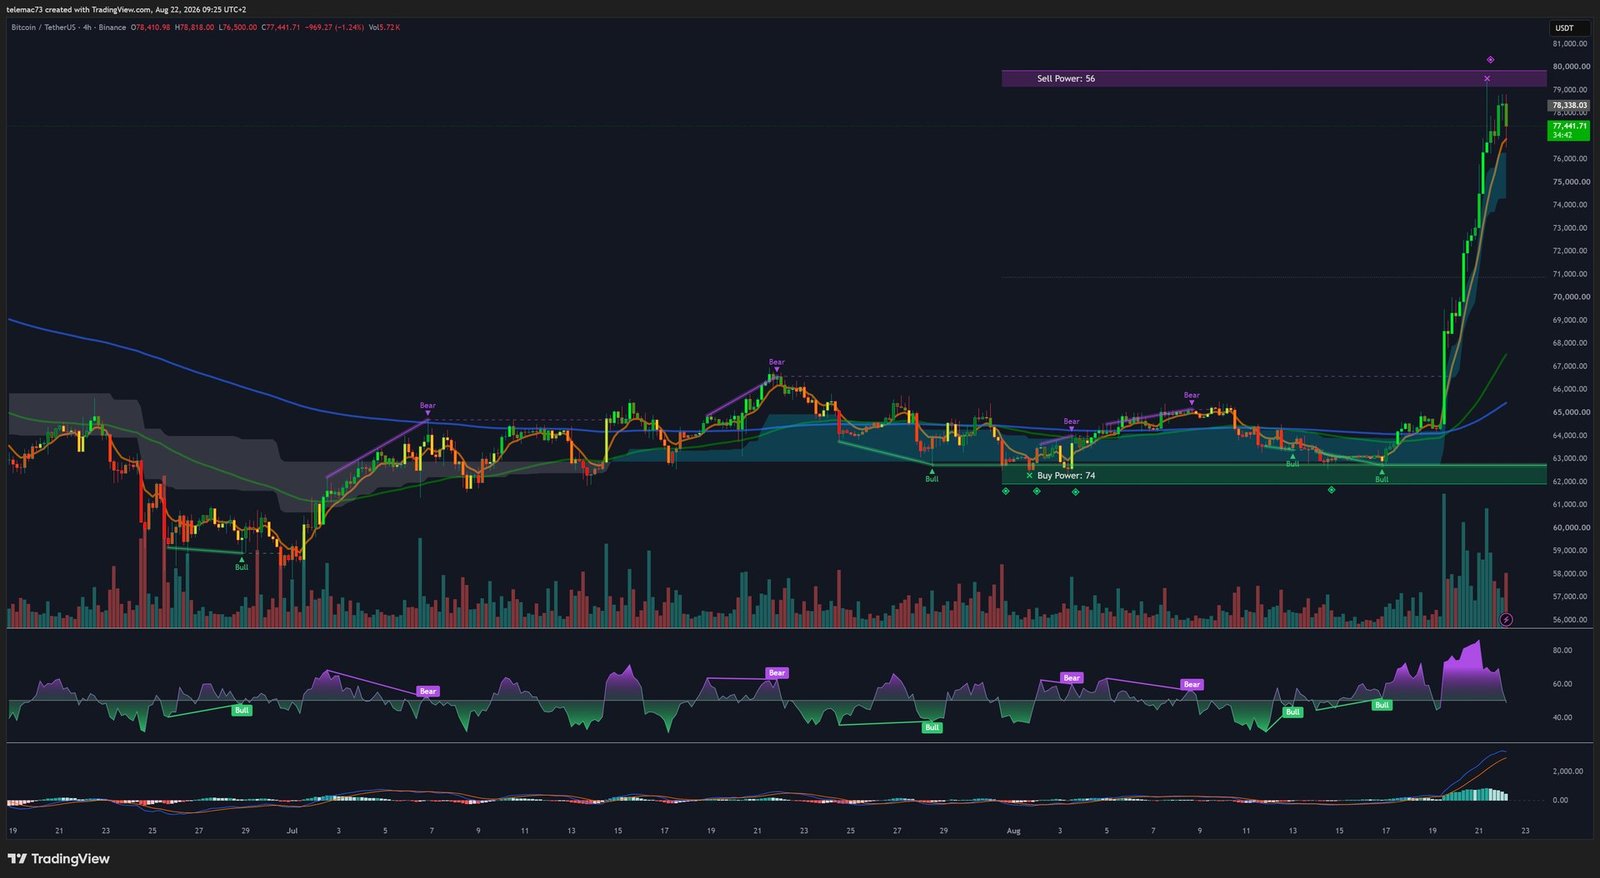
On the 4-hour timeframe, the rally has taken on a near-vertical shape, marked by wide-bodied candles consistently closing near their highs — a classic signature of a cascading short squeeze amplifying buy-side pressure. Every pullback phase has resolved as a bull flag, breaking upward without exception.
The 4H RSI sits in extreme overbought territory (above 80), and while the MACD remains positive, its histogram is visibly flattening at the top. The key technical risk is the possible formation of a bearish divergence should price print a new local high without momentum confirmation — a pattern that has historically preceded cascading profit-taking. The first supports to watch sit around $72,000.
15-Minute Chart: Compression Before the Decision
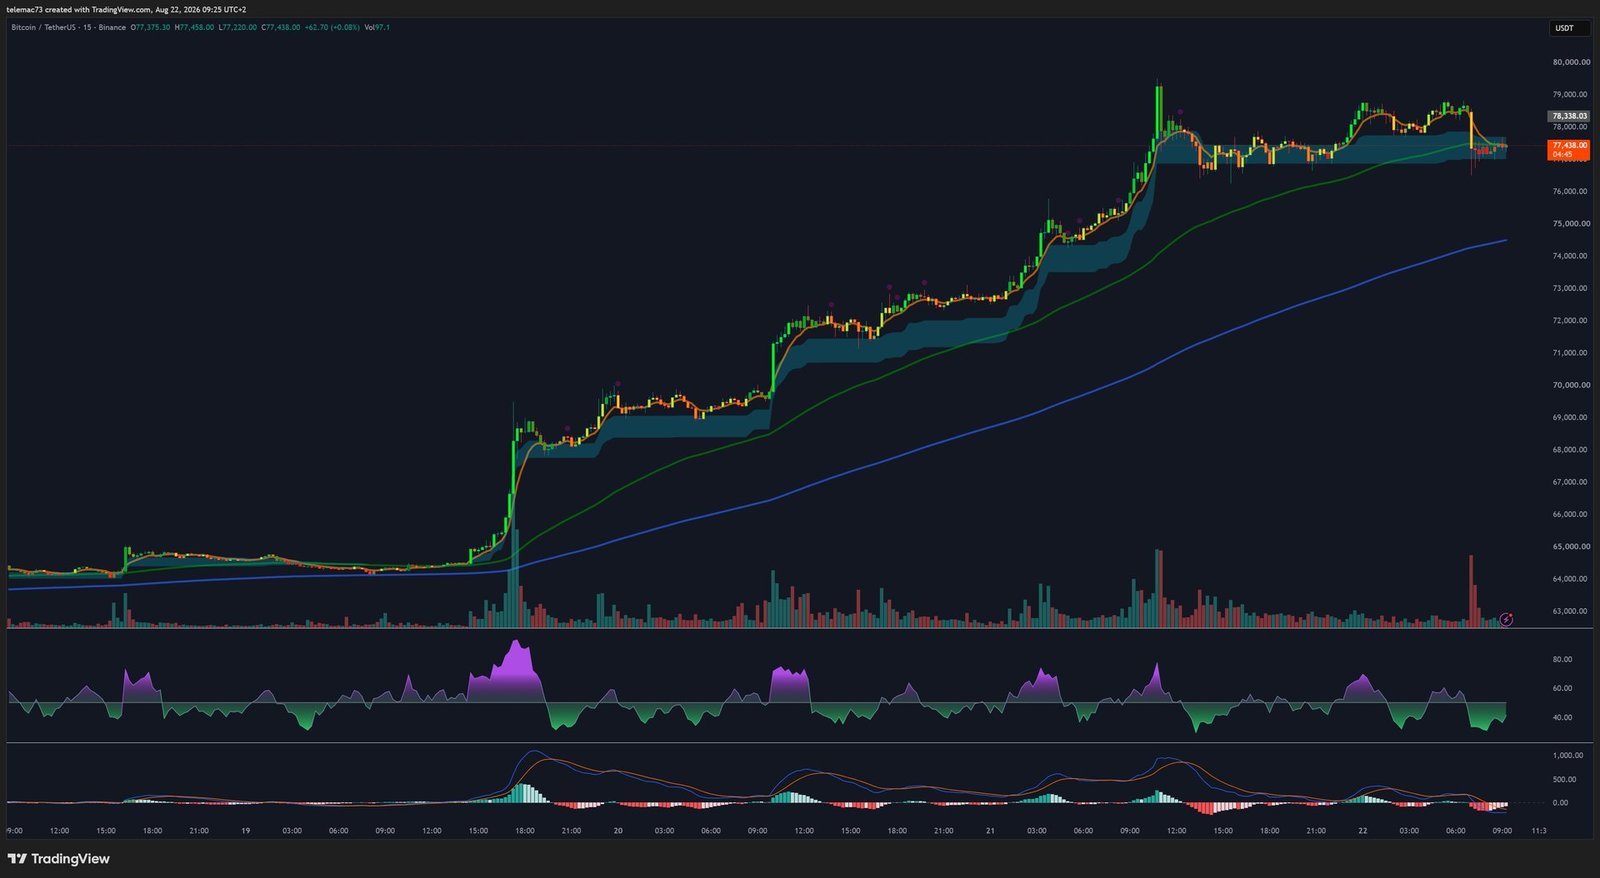
After a buying climax that briefly pushed above $78,000, price is now consolidating inside a symmetrical triangle around $77,400. Oscillators have normalized in a healthy fashion: the RSI has settled back around its 50 midline, and the MACD, after a local bearish crossover, is converging toward the zero line — the classic signature of an indecisive market pausing rather than reversing.
The short-term decision pivot sits at $77,000. Holding above it keeps the bullish structure intact and opens the door to a test of $80,000. A clean break below $76,500 would invalidate the pattern and could trigger a slide toward the liquidity void identified above.
Summary: Key Level Matrix
| Category | Level (USD) | Rationale |
|---|---|---|
| Ultimate macro resistance | $83,500 | On-chain short-squeeze cluster (312,158 BTC) |
| Key resistance | $79,500 – $80,000 | Massive ask wall on the order book heatmap |
| Short-term pivot | $77,000 | Base of the 15M compression triangle |
| Minor support | $72,000 | Former congestion zone on the 4H chart |
| Major support | $70,900 | On-chain cost-basis cluster (142,820 BTC) |
| Macro support | $64,000 | Former historical bid wall, now support via polarity |
Conclusion
Bitcoin sits at the intersection of a still-uncertain macro environment, an unprecedented degree of Swiss regulatory legitimization, and a technical structure approaching a major decision point. If buying pressure manages to break through the $80,000 wall, liquidation of the $83,500 on-chain cluster could open the path toward $90,000. Conversely, a rejection at that level could trigger a correction back toward the institutional foundations at $70,900, or even $65,000. Risk management around this threshold will likely determine the outcome of the current cycle.
Disclaimer: This article is provided for informational and educational purposes only. It does not constitute investment advice, a recommendation to buy or sell, nor a solicitation to trade digital assets. Cryptocurrency markets are highly volatile and carry a significant risk of loss. Always do your own research (DYOR) and consult a qualified financial advisor before making any investment decision.

