


Bitcoin has spent the past few days in a high-velocity, post-impulse digestion phase, trading between $85,350 and $86,300 after tagging an eight-month high of $87,391. This institutional-expansion regime reflects the market’s full absorption of the Federal Reserve’s latest rate hike and the procedural stall of the CLARITY Act in the US Senate. A net $433.03 million injection into spot ETFs on September 18 triggered a brutal short squeeze — over $262 million in short liquidations within a single hour — propelling price into a historic supply zone between $85,000 and $88,200.
Tactically, the market is consolidating above institutional ETF buyers’ average acquisition cost ($85,000), pushing the majority of those positions back into unrealized profit. The immediate setup pits a persistent underlying bullish momentum against pronounced overheating in daily and 4-hour momentum oscillators. Institutional desks should look for confirmation of an intraday compression breakout above $86,400 before targeting the $88,167–$90,000 zone, while closely watching the dynamic support pivot at $84,311.
Daily trend inflection and long-term moving-average reclaim
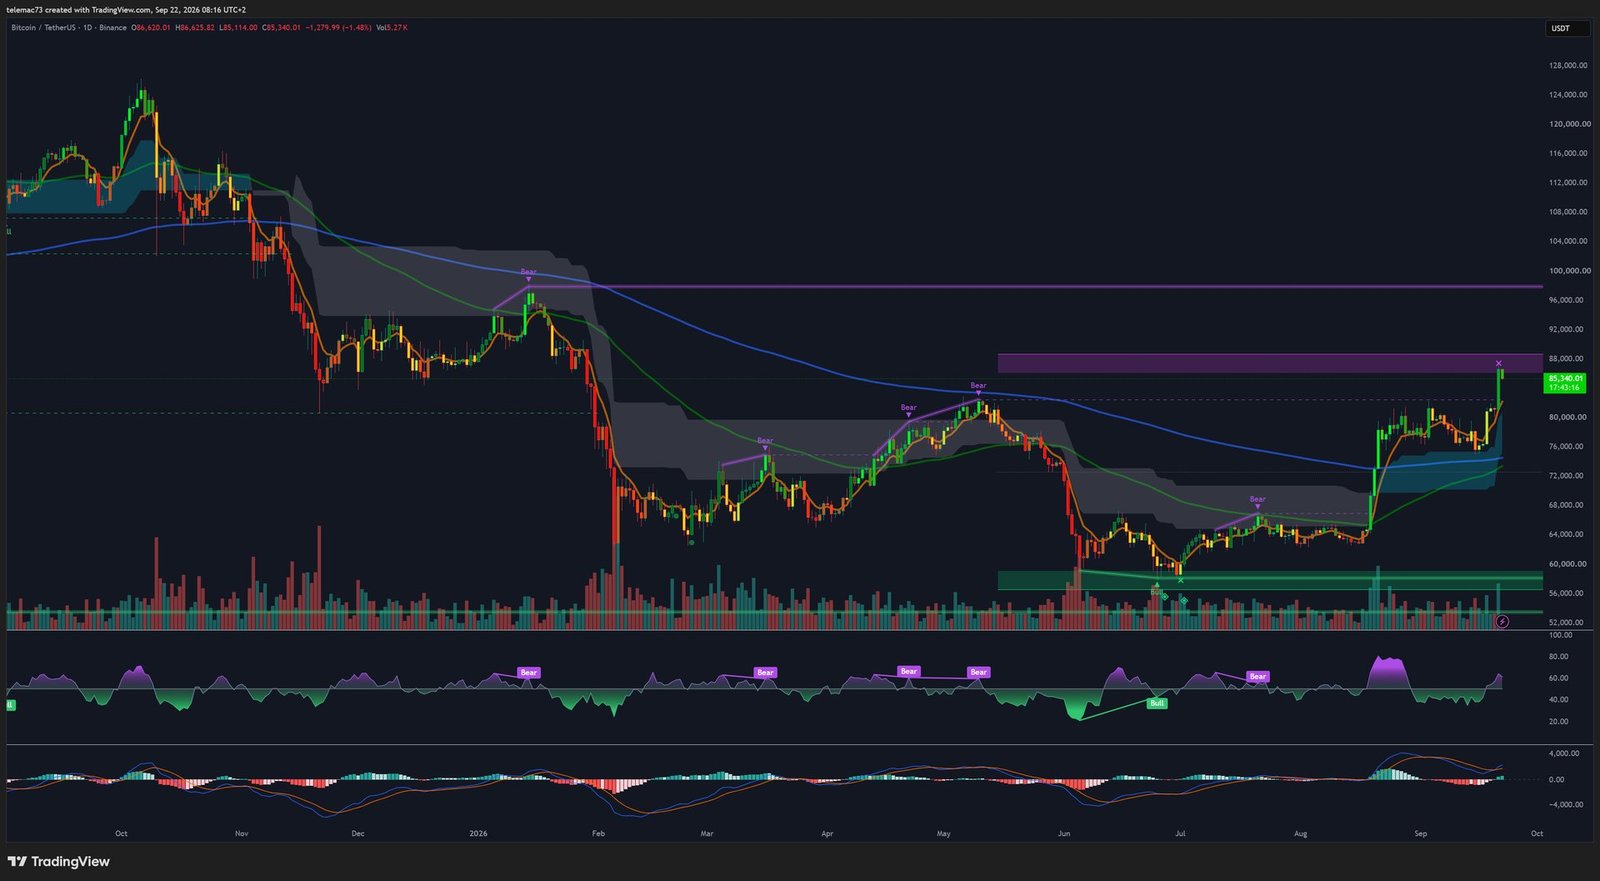
On the daily timeframe, the technical structure confirms a genuine regime shift, closing out the pullback sequence that began from the historic highs above $120,000 set in Q1 2026. The summer’s horizontal accumulation phase, confined between $56,000 and $60,000, built a robust institutional re-accumulation base. A steady sequence of higher lows validated throughout September supplied the thrust needed to break through intermediate distribution levels and restore an upward-oriented dynamic.
This recovery materialized through a vertical break of the 200-day simple moving average, which had been hovering around $76,200–$78,000. Clearing this psychological and algorithmic obstacle neutralized the underlying seller bias, while the fast 20- and 50-day exponential moving averages now trend with a strongly positive slope. This recovery sets the stage for a major Golden Cross — the fast moving averages crossing above the 200-day curve — confirming the handoff of liquidity from short sellers to passive institutional allocators.
This acceleration now places price directly against a major resistance block: a wide horizontal supply band stretching from $85,000 to $88,200, a legacy of a distributive congestion zone dating back to spring 2026 where substantial trading volume got trapped. The daily RSI (14) is running above 75, an extended overbought reading rarely seen over the prior two quarters, while the daily MACD confirms the strength of the move through a substantial widening between the momentum and signal lines. That said, the more than $11,000 statistical distance from the 200-day moving average signals that a sideways consolidation, or an orderly corrective pullback, remains necessary to digest the excess supply stacked below $88,200.
Parabolic extension on the 4-hour chart and momentum divergences
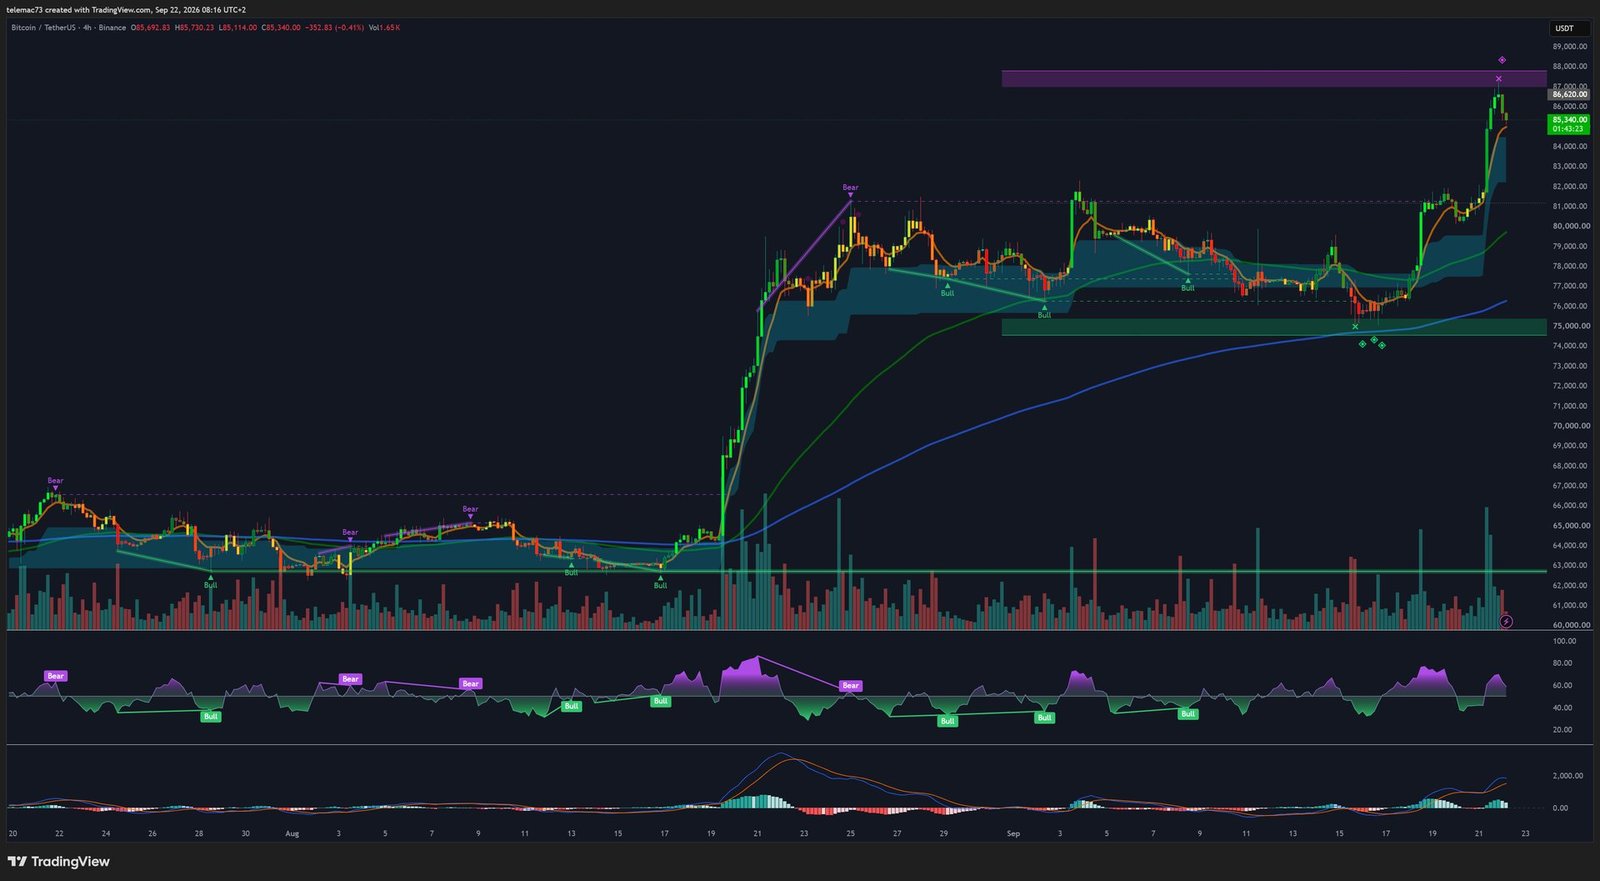
The 4-hour chart shows a near-parabolic impulse, launched from the post-FOMC low at $75,000 and amplified by a breakout from the intermediate volatility channel. This directional move cleared the $80,000 and $82,500 technical resistances without pausing, illustrating a one-sided order imbalance fed by forced buy-backs. The first real stall came at the $87,391 level, marked by a long upper wick reflecting direct impact against passive order-book supply.
4-hour momentum readings are now signaling a predictable kinetic deceleration after such an extension. The 4H RSI peaked above 82 before rolling over, forming an early bearish divergence: price printed a new local high at $87,391, but the oscillator’s corresponding peak came in relatively lower — a sign of fading aggressive buying pressure as price pushes into the upper distribution zone. The 4H MACD reflects the same loss of intensity: both lines remain anchored well above the zero line following the bullish cross triggered at $76,500, but the histogram shows a notable deceleration. Price is trading well above its 4H Ichimoku Kijun-sen ($84,311) and its 50-period moving average, while the 4H 200-period MA remains detached at $74,500. This over-extension calls for tactical stabilization within the $84,300–$87,400 range before any sustained attempt at new highs.
Intraday microstructure: bull-flag compression
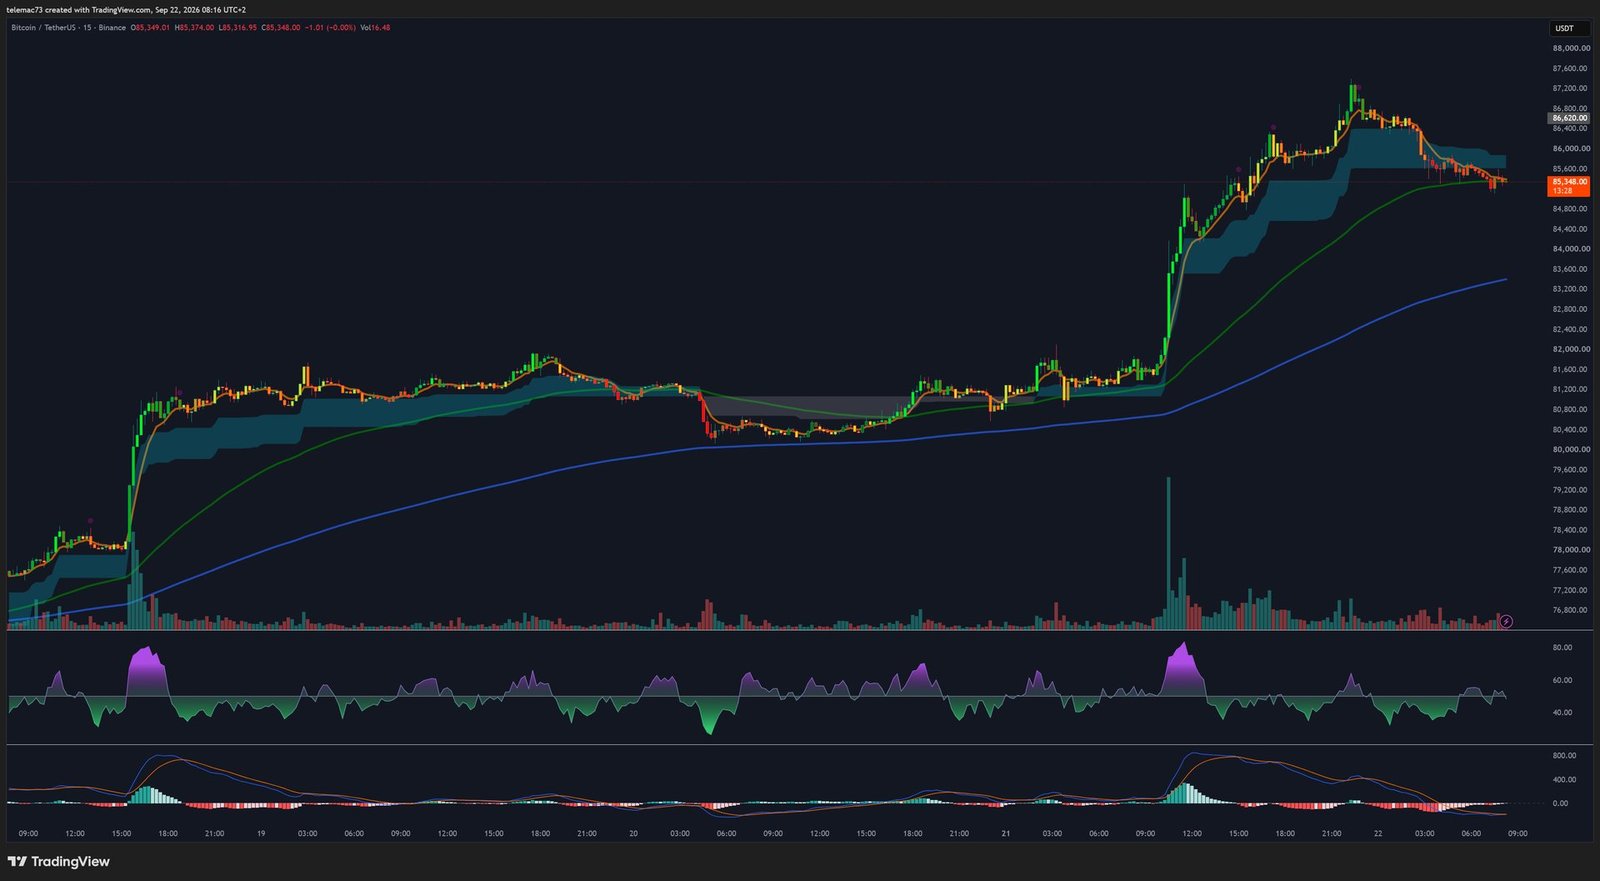
On the 15-minute timeframe, price action illustrates a shift from impulsive liquidation into an orderly continuation pattern. Since the $87,391 volatility peak, price has been trading inside a tight, regular descending channel, testing a local floor at $85,348 — a geometry that matches the structural properties of a bull flag. This pattern is holding above the $85,000 institutional pivot, with price compression against the $85,300–$85,400 horizontal support demonstrating marked resilience against profit-taking.
The unwinding of intraday oscillators strengthens the odds of a constructive resolution of the flag. The 15M RSI, after flirting with 88 during the run to $87,391, has pulled back into the 35–40 zone without price conceding more than 2.3% of its value — a hidden bullish divergence hinting at a potential restart of buying flow. The 15M MACD’s bearish cross, which occurred below $86,800, is also losing negative momentum, its histogram continuously contracting toward the zero line — a sign that very short-term selling pressure is running close to exhaustion.
| Timeframe | Dominant regime | Chart pattern | RSI | MACD signal | Support | Resistance |
|---|---|---|---|---|---|---|
| Daily (1D) | Bullish (major inflection) | Base and 200-MA breakout | 75.0 (extended overbought) | Expanding bullish cross | $76,200–$78,000 (200-MA) | $88,167–$88,200 |
| 4-hour (4H) | Parabolic bullish | Testing macro supply zone | 80.5 (early bearish divergence) | Positive, decelerating histogram | $84,311 (Kijun-sen) | — |
| 15-minute (15M) | Neutral / compression | Bull flag | 38.0 (reset to low neutrality) | Bearish signal, exhaustion phase | $85,348 | — |
Order-book liquidity mapping
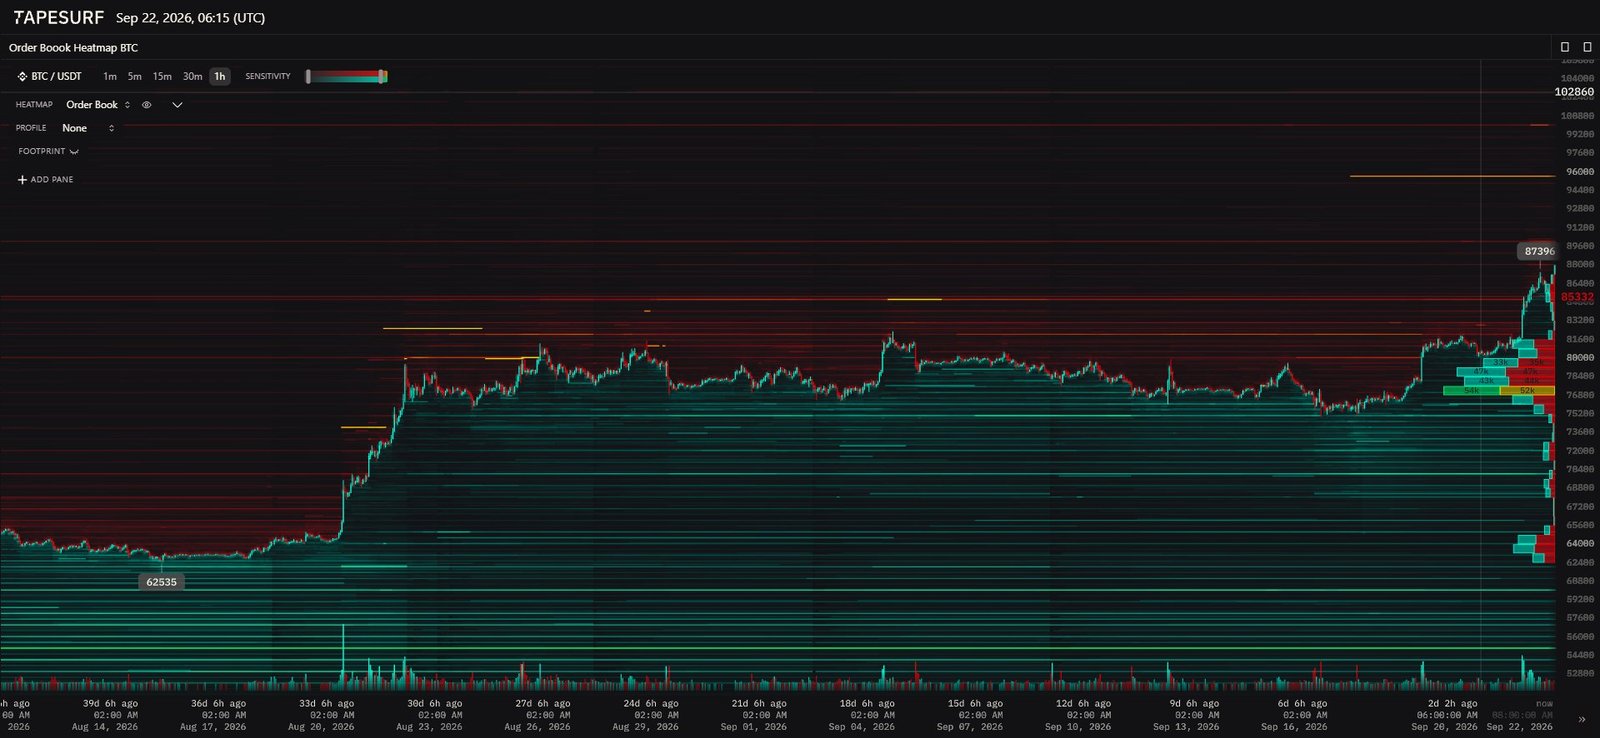
The BTC/USDT order-book heatmap, captured on September 22, 2026 at 06:15 UTC, provides an essential empirical validation layer by exposing the history and concentration of limit orders — a tool that helps separate genuine order walls from manipulative orders pulled as price approaches (spoofing).
Order placement reveals a massive passive resistance sitting directly above current trading levels. A first sell layer (ask wall) sits between $88,000 and $88,200, forming the immediate barrier capping the rally’s extension. Beyond it, a dense concentration of institutional distribution orders sits at the $90,000–$90,500 shelf, while a particularly thick liquidity belt blocks access to the $96,000–$98,000 range, confirming programmed profit-taking ahead of the symbolic $100,000 threshold.
Conversely, pending buy orders (bid walls) reveal a deep restructuring of underlying support: the heatmap’s most persistent bids have migrated to form a dense floor around $80,000, signaling that market makers and institutional capital have locked in this level as a structural base. Lower down, the old post-FOMC accumulation zone ($75,000–$76,500) retains very high passive order density, guaranteeing massive absorption in the event of an adverse liquidity shock. The executed-volume footprint during the $87,391 test shows that aggressive market buys were methodically absorbed by the sell wall; the subsequent stall and pullback to $85,350 reflects aggressive demand’s momentary inability to consume the full depth of the book.
Macro catalysts: FOMC, the CLARITY Act, and ETF flows
This expansion move stems from the alignment of several fundamental catalysts between September 15 and 22, 2026. The September 16 FOMC meeting delivered a unanimous 25-basis-point hike, setting the federal funds rate at 3.75%–4.00% — the first hike since July 2023, though already priced in by over 90% in futures markets. The accompanying dot plot, pointing to just one more hike by year-end 2026, acted as a powerful macro-easing signal.
That relief was reinforced by Bitcoin’s resilience in the face of the CLARITY Act’s rejection in the US Senate — landmark digital-asset legislation that failed to clear a procedural hurdle on September 15 (50-49, short of the required 60-vote threshold). While crypto-infrastructure equities dropped nearly 10%, Bitcoin quickly absorbed its pullback below $76,000 — a divergence highlighting its growing status as a macro asset increasingly decoupled from the regulatory risks facing decentralized ecosystems.
The dominant liquidity driver, however, remains the intensity of spot Bitcoin ETF subscriptions. Net inflows of $433.03 million on September 18 reversed the outflow sequence seen mid-month, creating an immediate supply shortage on OTC desks. This buying pressure pushed price past two key profitability metrics: the True Market Mean ($76,700), the average on-chain cost basis of active investors, reclaimed and consolidated as macro support; and ETF buyers’ average acquisition cost ($85,000), broken during the September 21 rally, putting the entire institutional cohort back into unrealized profit — a setup that sharply reduces the risk of capitulation selling.
| Catalyst | Date | Observed outcome | Liquidity impact |
|---|---|---|---|
| CLARITY Act rejection | Sept. 15, 2026 | 50-49 Senate vote (60 required) | Brief flush below $76,000, followed by clear decoupling from crypto equities |
| FOMC decision / dot plot | Sept. 16, 2026 | Unanimous 25bp hike (3.75%–4.00%) | Priced-in event; lifted macro uncertainty |
| Net spot ETF flows | Sept. 18, 2026 | +$433.03M net institutional inflow | Spot supply shock; reclaimed institutional break-even level |
| Derivatives short squeeze | Sept. 21, 2026 | $262M in short liquidations in one hour | Vertical push to $87,391; exhaustion of forward sell supply |
Strategic level map
| Tactical level | Price range | Technical role |
|---|---|---|
| Major resistance 3 | $96,000–$98,000 | Massive order wall; medium-term cycle extension |
| Major resistance 2 | $90,000–$90,500 | Institutional psychological threshold; heavy sell-limit concentration |
| Immediate resistance 1 | $88,167–$88,200 | Daily supply ceiling; sell-wall target |
| Central negotiation pivot | $85,400–$86,000 | ETF buyers’ average cost; 15M flag high |
| Tactical support 1 | $84,311 | 4H Ichimoku Kijun-sen; intermediate trend support |
| Volatility support 2 | $82,652 | Projected floor of the 3-day volatility channel |
| Structural support 3 | $80,000 | Old summer range high; major institutional bid wall |
Primary scenario: bullish continuation (estimated 70% probability)
This scenario hinges on a bullish resolution of the 15-minute compression structure. The necessary condition is continued preservation of the $84,311 support on a 4-hour closing basis, allowing oscillators to fully unwind without breaking the underlying impulse. Technical activation would come on a clean break above $86,400, confirmed by a re-acceleration of the 15M MACD histogram above zero. Such a break would trigger a quick retest of the $87,391 high, with any overshoot sweeping residual stop orders before probing the thick sell wall between $88,167 and $88,200. If spot ETF inflows remain positive, the move could carry enough fuel to clear that shelf and push directly toward the $90,000–$90,500 zone. This immediate outlook would be invalidated by a 4-hour close below the Kijun-sen pivot at $84,311.
Alternative scenario: pullback to macro support (estimated 30% probability)
This scenario envisions aggressive demand failing to absorb the limit orders sitting between $86,500 and $87,000, validating the bearish divergence seen on the 4H RSI. Under this path, a break of the flag’s local floor at $85,348 would trigger a deleveraging of short-term long positions. A confirmed loss of $84,311 would push price toward the lower bound of the volatility channel, estimated at $82,652. An intensification of macro pressure could extend the pullback down to a test of the $80,000 psychological and structural support — far from invalidating the underlying trend regenerated by the 200-day MA reclaim, a return to $80,000 would represent a textbook technical throwback, drawing on the massive passive bid wall identified on the heatmap. Final invalidation of the bullish macro structure would only occur on a confirmed break below $76,000, a level that would mark re-entry below the 200-day moving average and the abandonment of the True Market Mean.
Conclusion
Bitcoin’s market structure as of September 22, 2026 combines every hallmark of an institutional-scale trend recovery, solidly underpinned by the absorption of rate-hike pressure and by massive spot capital inflows. While the medium-term asymmetry leans firmly toward continued appreciation toward $90,000, the presence of a wall of passive sell orders between $88,000 and $88,200 rules out any late entry not backed by technical confirmation. Sound portfolio management calls for waiting either for a validated breakout of the intraday compression above $86,400, or for a tactical add at the support confluence between $84,311 and $82,652, to maximize capital efficiency against the liquidity zones identified on the order book.
Disclaimer: This article is provided for educational and informational purposes only. It does not constitute investment advice, a recommendation to buy or sell, or a solicitation to trade digital assets. Cryptocurrency markets are highly volatile and involve a risk of capital loss. Do your own research (DYOR) and consult a licensed financial advisor before making any investment decision.

