


Bitcoin enters early August 2026 in a rare and dangerous state of technical compression. Squeezed between a heavy institutional sell wall overhead and a floor of silently accumulating whales below, the asset appears to be hanging by a thread — caught between an uncompromising US monetary policy, a major security breach, and the worst seasonal window of the year. Here is the full anatomy of a market at a crossroads.
A hawkish Fed keeps tightening the screws on risk assets
At its July 2026 meeting, the Federal Open Market Committee held its benchmark rate in a 3.50%–3.75% range, a fifth consecutive pause marked by unusual internal fragmentation: three members formally called for an immediate 25 basis-point hike. Under Chair Kevin Warsh, the Fed has also abandoned detailed forward guidance, forcing markets to react to incoming data rather than to promises. That less predictable posture has pushed bond yields higher across the curve, mechanically compressing valuation multiples for high-beta assets like Bitcoin, whose correlation with the S&P 500 now sits near 0.89.
On the inflation front, supply shocks tied to escalating tensions in the Middle East pushed WTI crude to $113 in April before it stabilized above $84. Combined with the Fed’s moderation of Treasury bill purchases, this dynamic closes off the possibility of a near-term appreciation phase driven by central-bank balance-sheet expansion.
The Coldcard hack shatters confidence in self-custody
In early August, a fourth wave of sophisticated attacks compromised more than 4,500 Coldcard hardware wallets, resulting in the theft of over 1,367 BTC — roughly $88.6 million. The resulting panic triggered a mass migration: nearly 39,600 BTC left personal wallets for centralized exchanges in a single day, mechanically adding to latent sell pressure.
This retail capitulation stands in stark contrast to the behavior of larger entities. While the net position accumulated by long-term holders dropped 47% over two weeks, the number of whales (wallets holding over 1,000 BTC) has been rising again since July 23, echoing a quiet accumulation pattern already seen a month earlier.
ETF flows dry up amid the worst seasonality of the year
Weekly inflows into spot Bitcoin ETFs fell 55% heading into August, and July 31 alone saw a net outflow of $265.4 million. This institutional pullback coincides with the historically worst period of the year for Bitcoin: August carries a median return of -7.87% and has closed in the red every year since 2022 — a bias that systematic trading algorithms now factor directly into their risk models.
MicroStrategy: the end of the unconditional-accumulation myth
With 843,775 BTC on its balance sheet at an average cost of $75,476, MicroStrategy remains the world’s largest institutional holder, but its doctrine is shifting. Between July 27 and August 2, the company liquidated 1,638 BTC to fund its preferred-stock distributions, following a 3,588 BTC sale in early July. The message to the market is unambiguous: even the strongest conviction bends to the cost of capital. The firm’s average cost basis of $75,400 has effectively become a major psychological resistance level.
Order book microstructure: reading the heatmap
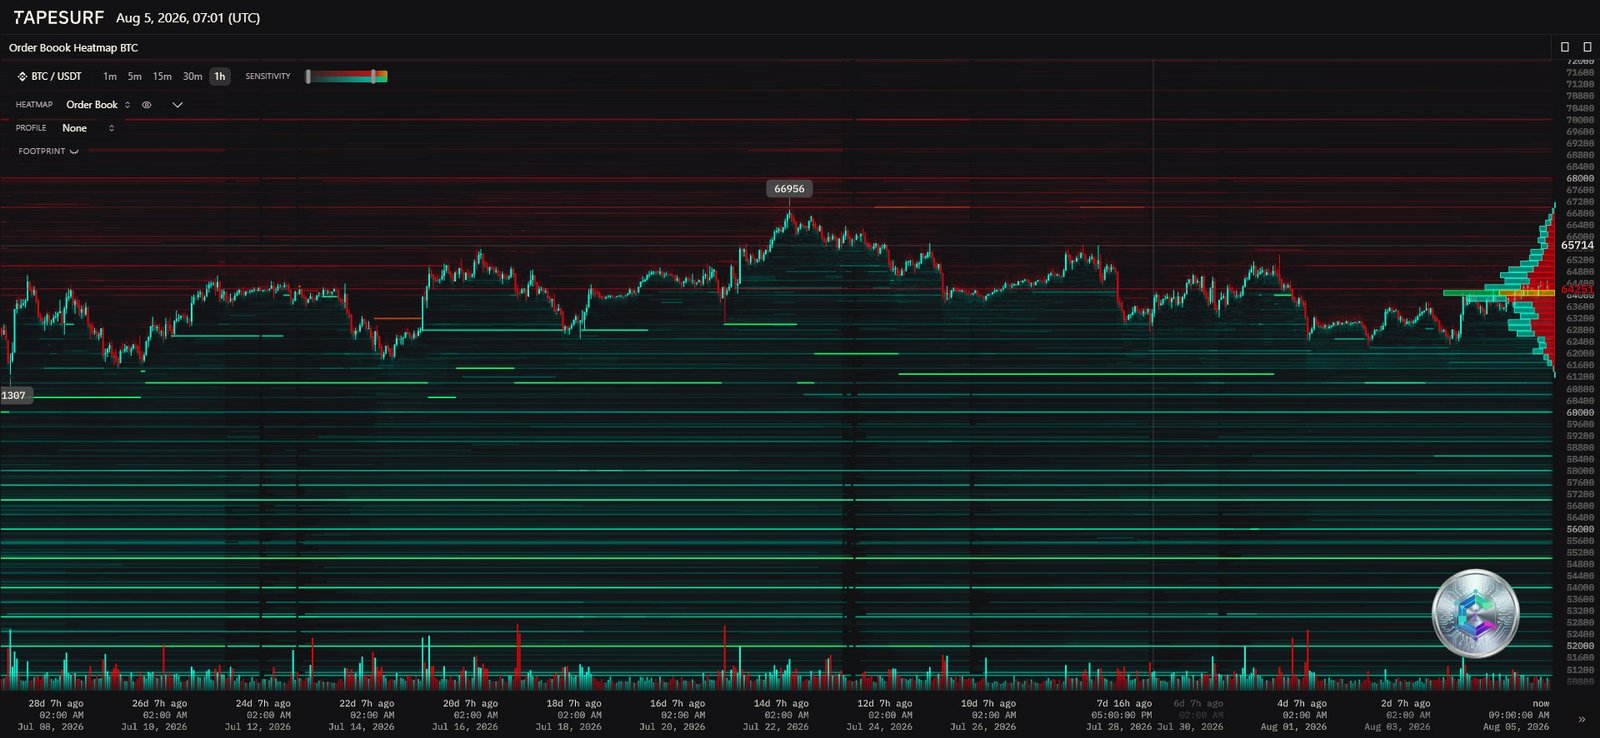
The order-book heatmap reveals a pronounced Point of Control (POC) around $64,000, acting as the market’s true center of gravity. Above it, dense sell walls stack up between $66,000 and $68,000, coinciding with the break-even zone for many buyers from the last bull cycle. Below, tiered liquidity floors appear at $63,000, $62,000, and especially near the $60,000 psychological threshold — an asymmetric structure of a heavy, nearby ceiling resting on deep but widely spaced floors.
Daily chart: a Head-and-Shoulders pattern under watch
On the daily timeframe, Bitcoin is tracing a textbook bearish reversal pattern — a Head and Shoulders — whose neckline sits between $66,885 and $67,000. The anemic volume behind the right shoulder constitutes a classic bearish technical divergence. The last-resort strategic support lies at $60,965; losing it would mathematically project a downside target near $41,266. On the upside, price has already broken below its 50-day EMA and remains capped by the 50-month moving average at $66,000, a historic demarcation line between bull markets and crypto winters. The daily RSI, below 40, is nonetheless printing slightly higher lows — a hidden bullish divergence suggesting selling pressure is gradually running out of steam.
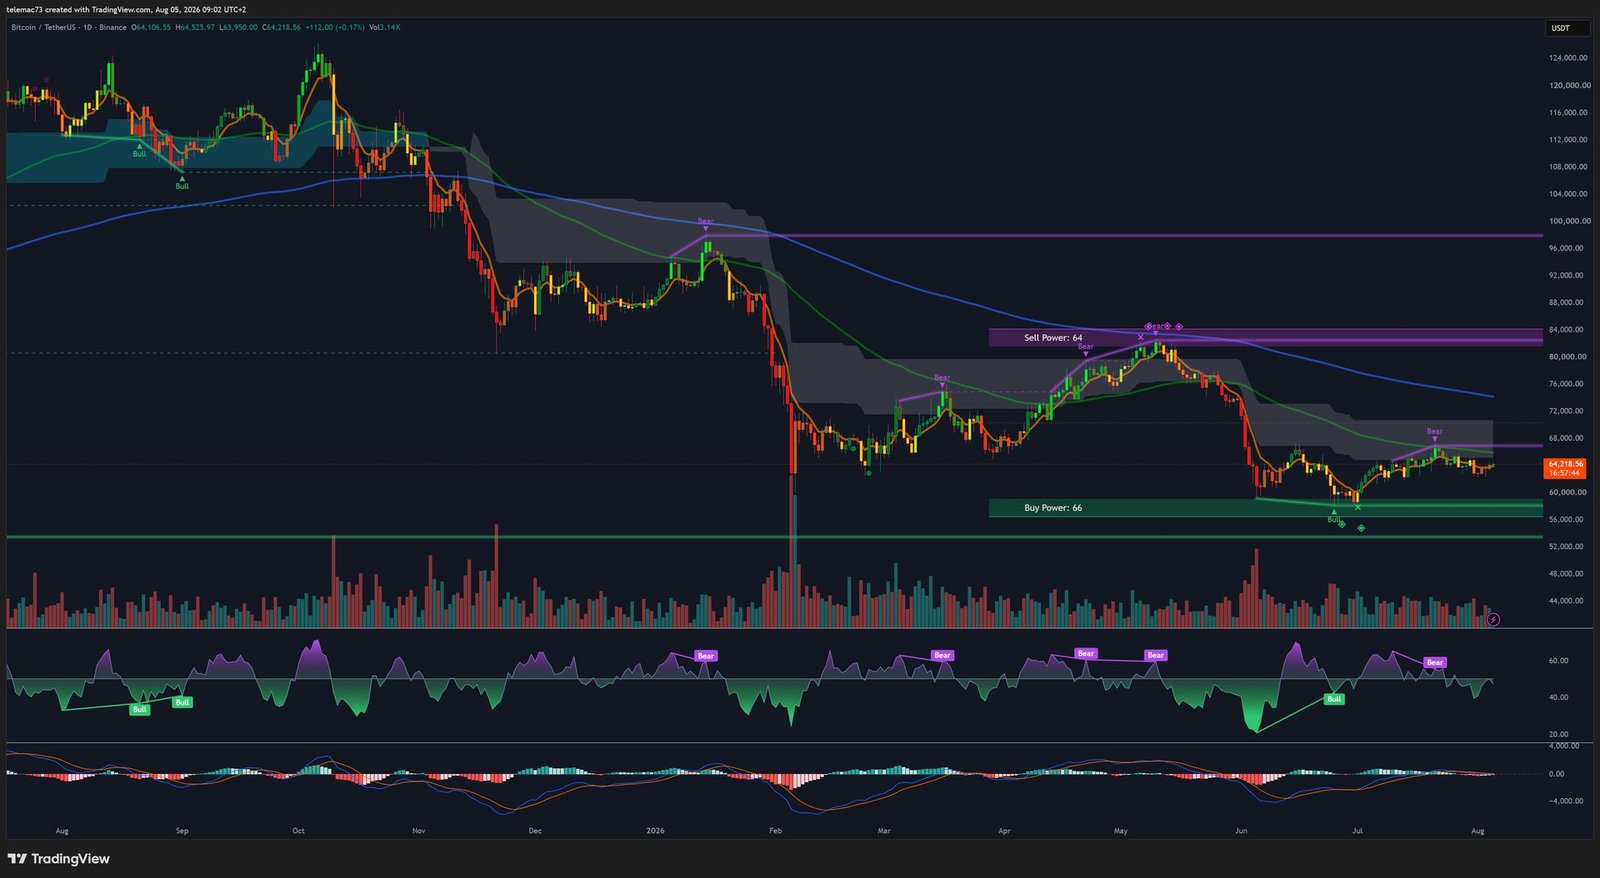
- $75,400 — Major resistance (MicroStrategy break-even)
- $70,900 — Secondary resistance (50% Fibonacci)
- $66,885 – $67,000 — H&S neckline / sell wall
- $64,500 — Equilibrium pivot (POC)
- $60,965 — Critical strategic support
- $57,800 — Extreme support (61.8% Fibonacci)
- $41,266 — Theoretical downside target (measured move)
4-hour chart: compressing inside a bear flag
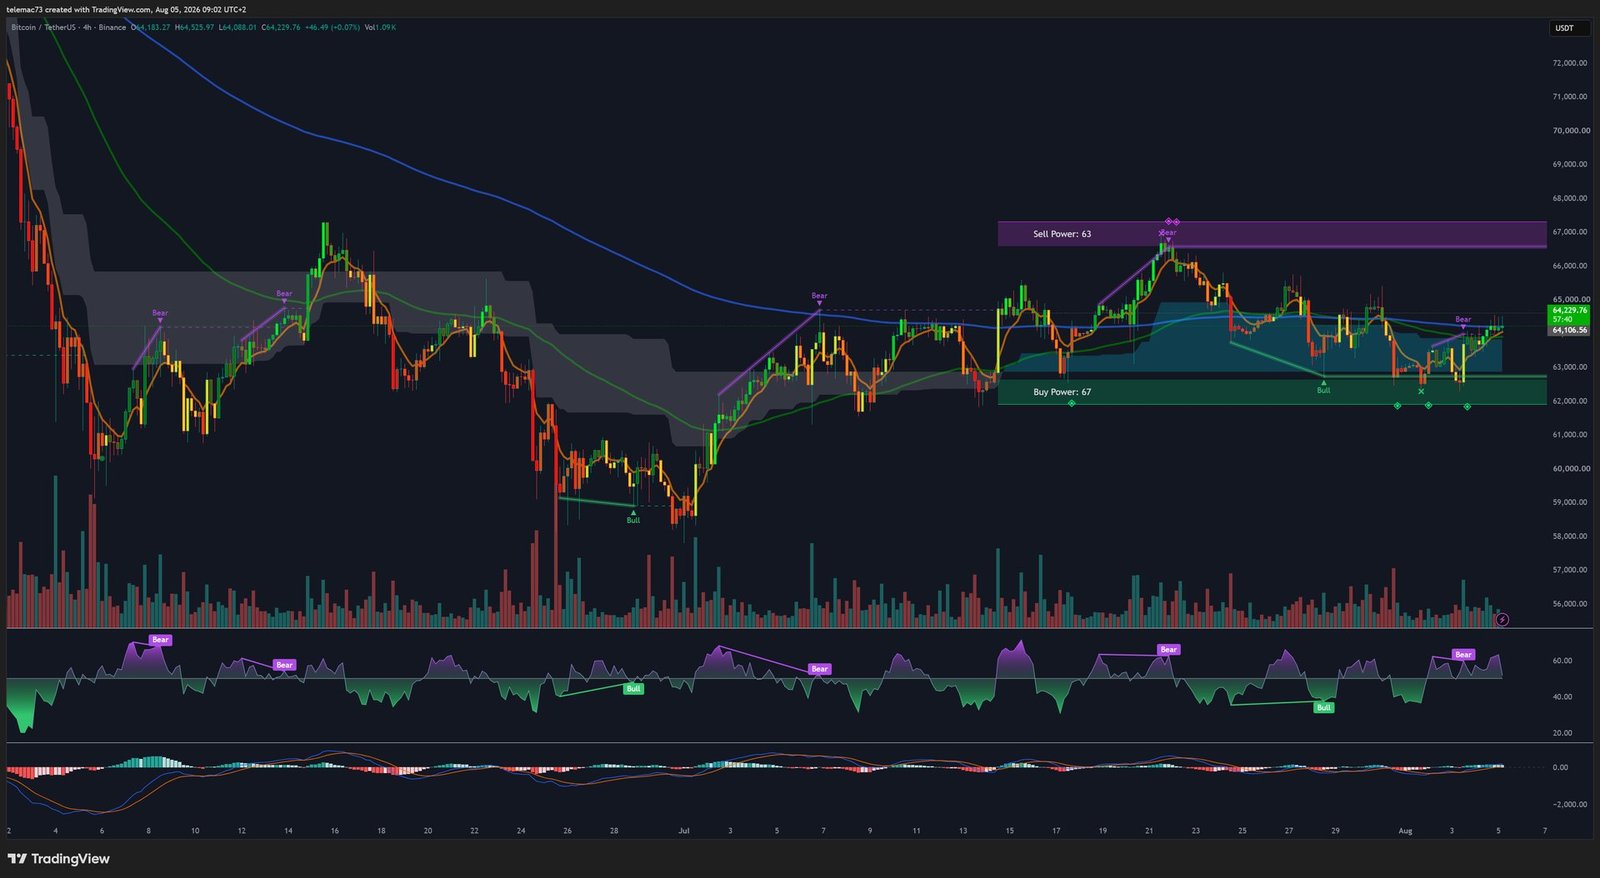
On the 4H timeframe, the market is compressing inside a descending triangle resembling a bear flag, with successively lower highs squeezing price against horizontal support between $62,000 and $63,000. Statistically, this type of pattern within a bearish macro trend more often resolves to the downside. The RSI is oscillating neutrally around 50 with no strong buying impulse, while the MACD is flashing a bullish “golden cross” below the zero line — a momentum-versus-structure divergence typical of liquidity-accumulation phases ahead of an explosive directional move.
15-minute chart: stop-loss hunt and intraday overheating
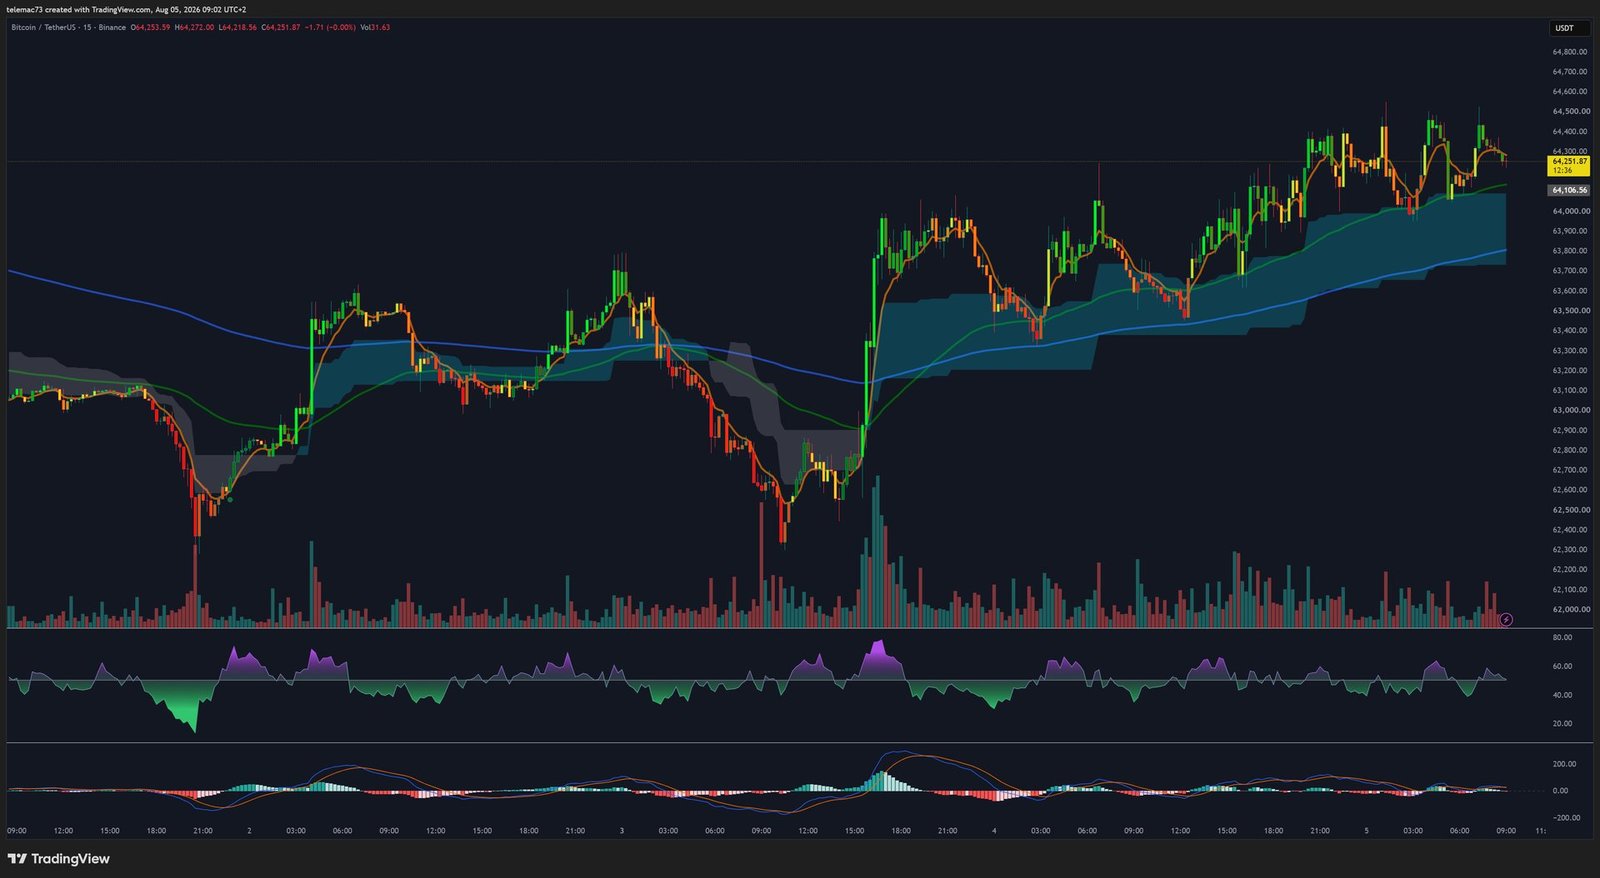
On the shortest timeframe, the market executed a textbook liquidity sweep around $62,500 before printing a series of higher highs and higher lows, forming several small bull flags. Price has stabilized above an intraday dynamic support between $63,800 and $64,000. But the speed of the bounce has pushed the 15-minute RSI into extreme overbought territory, while the MACD is flattening and approaching an intraday bearish crossover (“death cross”) — an exhaustion signal that could pull price back to retest the $64,000 pivot.
Takeaway: a market holding its breath before the break
Bitcoin’s current structure reflects a collision of opposing forces: a restrictive monetary environment draining speculative liquidity, a self-custody trust crisis feeding exchange supply, and an institutional pillar (MicroStrategy) shifting toward a utilitarian treasury strategy. Technically, the volatility compression visible across every timeframe — from 15 minutes to daily — makes a calm sideways resolution unlikely.
To invalidate the bearish bias, Bitcoin would need to durably reclaim the $67,000 resistance zone, likely requiring an exogenous catalyst such as a surprise Fed pivot or a banking-system shock. Conversely, failure to defend the $64,500 pivot would expose the critical $60,965 support, whose breakdown would open the path toward $57,800 — or even $41,266 in a cascading liquidation scenario.
Disclaimer: this article is provided for educational and informational purposes only. It does not constitute investment advice, a recommendation to buy or sell, or a solicitation to act in the financial markets. Cryptocurrencies are highly volatile and risky assets. Always do your own research (DYOR) and consult a licensed financial advisor before making any investment decision.

