



Bitcoin is currently going through one of the tightest compression phases of its recent history. Trapped below the psychological $64,000 barrier, the digital asset keeps getting rejected against a wall of technical and institutional resistance, even as it paradoxically benefits from an increasingly favorable macroeconomic backdrop. Between persistent ETF selling pressure, a tightened market microstructure, and the prospect of Federal Reserve monetary easing, a multi-timeframe analysis reveals a market under extreme tension, on the verge of a major directional resolution.
A double-edged macroeconomic backdrop
Assessing Bitcoin’s market structure today requires a cross-reading of multidimensional technical analysis and institutional flow dynamics. Long perceived as a decorrelated asset, Bitcoin now shows marked sensitivity to global liquidity conditions, increasingly trading as a high-beta expression of technology indices such as the Nasdaq. This growing integration into traditional finance is reshaping price action, replacing yesterday’s idiosyncratic volatility with tight algorithmic correlation to equity markets.
At the Jackson Hole summit, Federal Reserve Chair Jerome Powell unambiguously signaled that the time had come to begin a rate-cutting cycle, with futures markets now pricing in up to 100 basis points of cumulative cuts over the next three FOMC meetings. Monetary easing should theoretically erode the dollar’s advantage and benefit non-sovereign stores of value such as gold or Bitcoin, which historically maintains a negative correlation with the DXY and real interest rates.
This favorable scenario, however, clashes with a much darker reality. Financial markets recently went through a summer volatility storm, triggered by a weaker-than-expected US jobs report that pushed the CBOE volatility index (VIX) above 65%, causing a brutal unwind of FX carry trades. Despite US inflation showing signs of moderation (annual CPI at 3.4%, core at 2.5% in July), the absence of a sustained bullish reaction in the crypto market shows that improving macro conditions have not yet translated into robust institutional demand. Persistent geopolitical tensions, notably around the Strait of Hormuz, also keep a risk premium in place that curbs appetite for risk assets.
ETF flows: the anatomy of a slow bleed
To understand the price’s current inability to break free from its lower consolidation zone, it’s essential to analyze the mechanics of capital flows tied to US-listed spot Bitcoin ETFs. These instruments, once expected to drive massive adoption, are currently the main engine behind systemic selling pressure.
Net flows recorded weekly outflows of $526.26 million, marking an eighth consecutive week of withdrawals. Net flows were negative in 54% of trading sessions in 2026, compared to just 31% in 2024, with year-to-date cumulative flows sitting around $4.5 billion in the red — the first negative calendar year ever recorded for this product complex. Total assets under management for the sector have fallen from a peak of $104 billion to $80 billion.
Institutional psychology plays a central role here. The estimated cost basis for IBIT, the market’s flagship product, sits around $83,080, creating a massive “overhang” of unrealized losses estimated at $17.61 billion. Rather than aggressive capitulation buying that would trigger a violent washout low, the market is undergoing what can be described as a slow bleed, marked by the absence of marginal buyers able to sustain pushes above $64,000. Adding to this pressure is latent supply from miners and corporate holders strategically liquidating during rebounds.
What the order book heatmap reveals
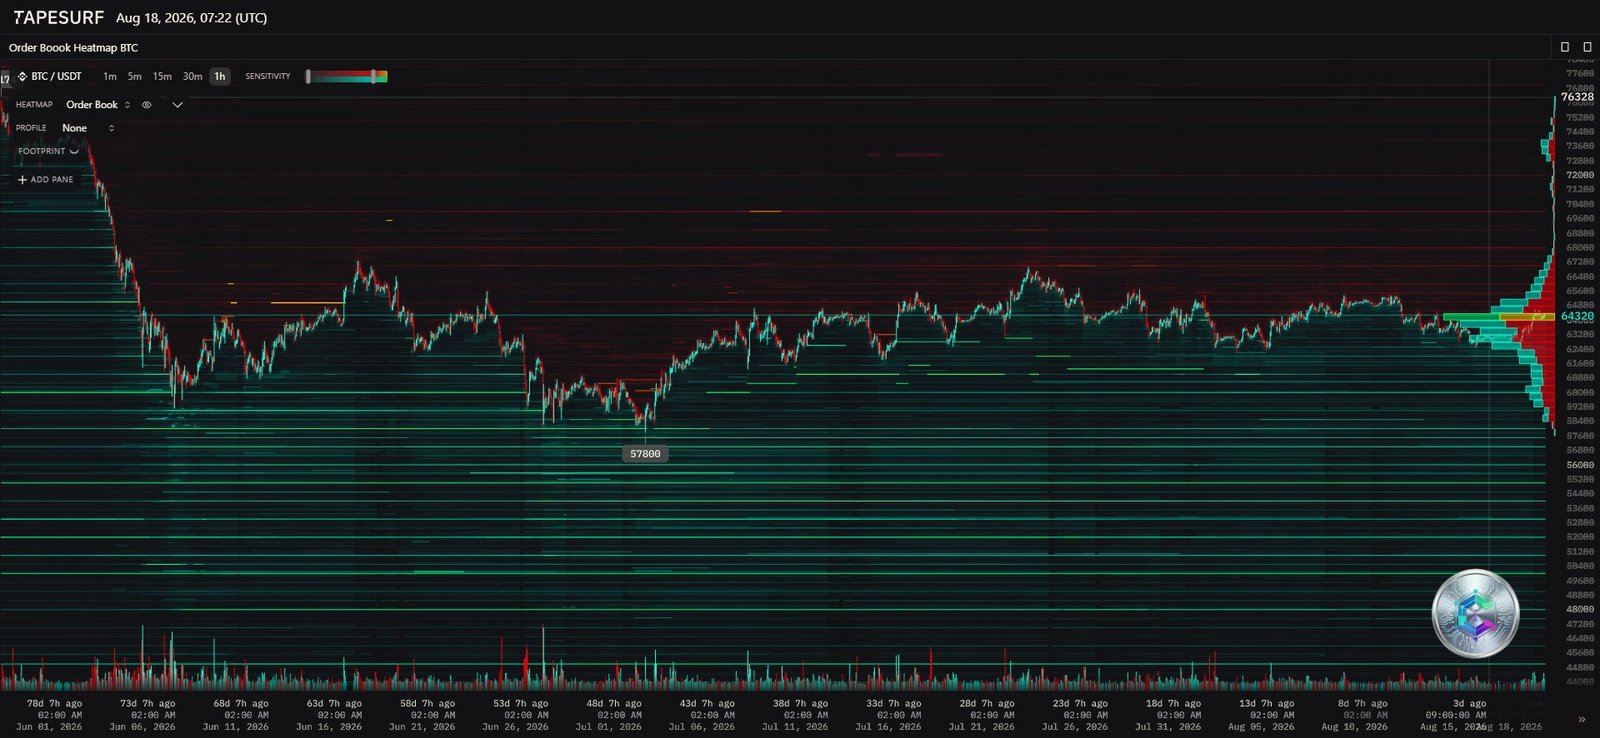
Studying the order book heatmap allows analysts to decode the real intentions of institutional players and market makers, beyond simple past price action. It visualizes the density of resting limit orders, revealing walls of absorption and distribution.
Around the current level (roughly $64,300), dense selling bands stretch from $64,500 to $67,000, technically explaining the recurring failures of bullish pushes: these liquidity clusters act as magnets for short-squeeze algorithms, but their depth instantly absorbs the market’s kinetic energy. Conversely, substantial liquidity protects the $63,000 zone, with a major concentration of buy orders around $62,000. The most critical signal, however, lies in the relative void beneath that level: in the event of a breakdown, the next significant friction point sits only around $57,800 — the current yearly low — an asymmetric downside risk worth watching closely.
Daily timeframe: the weight of structural resistance
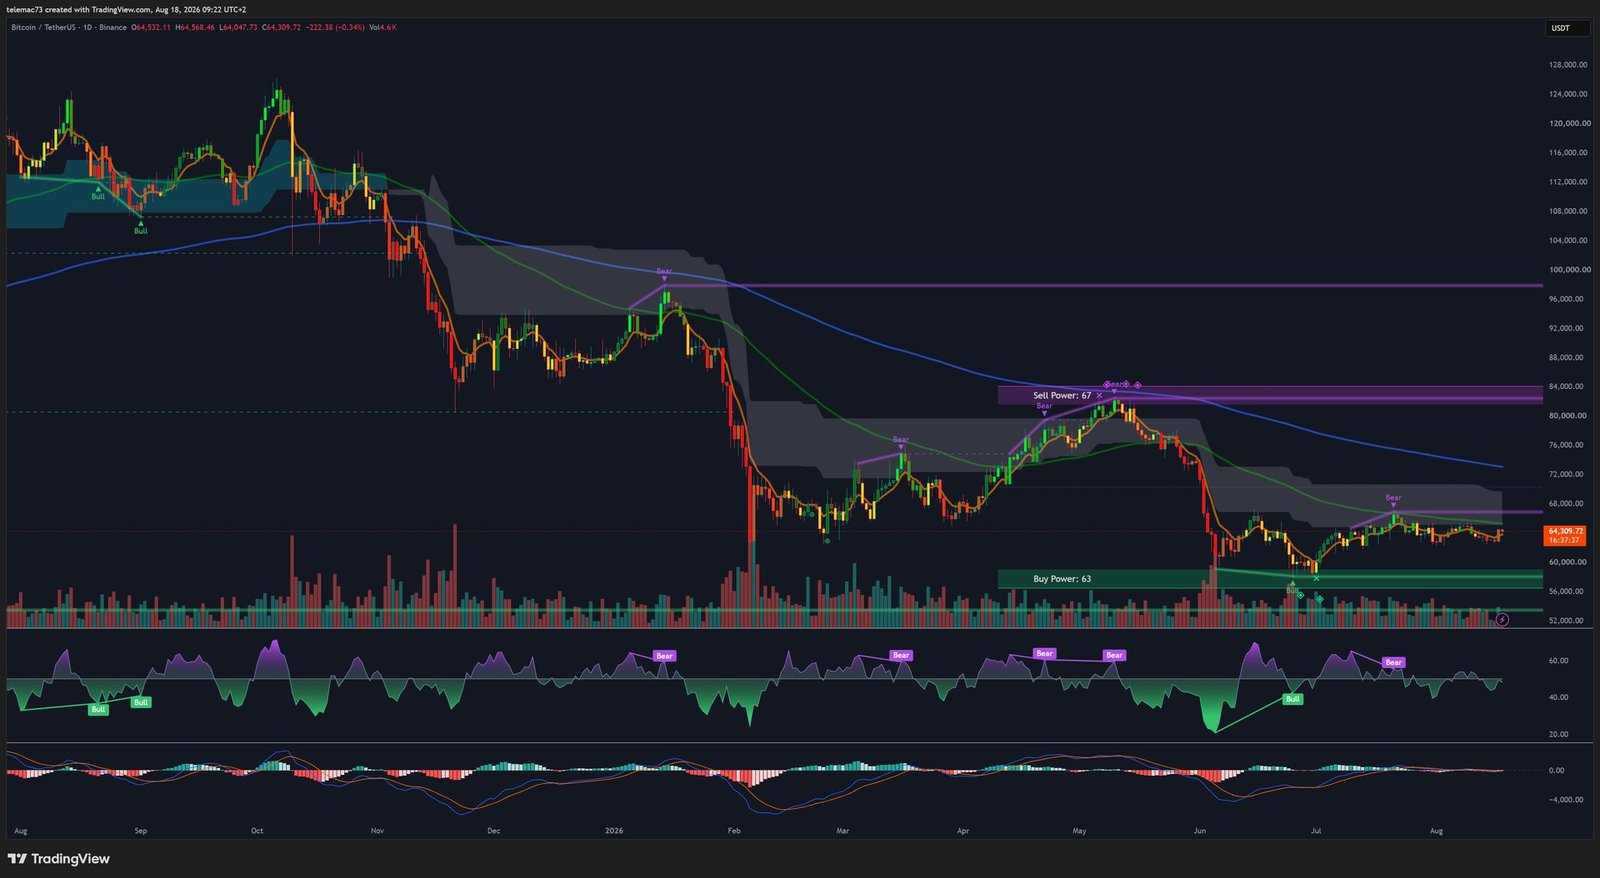
On the daily timeframe, Bitcoin is locked in an unmistakably bearish structure. August’s sequence of closes documents a gradual erosion: $64,905 on August 8, followed by successively lower highs down to $62,976 on August 14, then stagnating around $63,000 through August 16. This 8-session, $1,900 slide, unaccompanied by any isolated capitulation candle, confirms a pattern of slow demand attrition rather than a panic collapse. On a yearly comparison, the picture remains severe: Bitcoin trades roughly $54,217 below its value twelve months ago, a 45.7% decline from its October 2025 all-time high of $126,199.
The moving average architecture corroborates this selling bias: price trades below the 20-EMA ($63,713), 50-EMA ($64,265), 100-EMA ($66,334) and 200-EMA ($71,578), each of which has flipped from historical support into dynamic resistance. The 50-day SMA sits at $63,392 and the 100-day SMA at $67,628. From a classical charting standpoint, the setup fits within a broad bear flag initiated from May’s highs, with a Fibonacci resistance confluence between $65,000 and $65,520. Some hope remains, though: a CME futures gap generated in November 2024 remains open between $78,000 and $80,000, potentially acting as a long-term gravitational pull.
The 4-hour chart: compressed volatility and a decision triangle
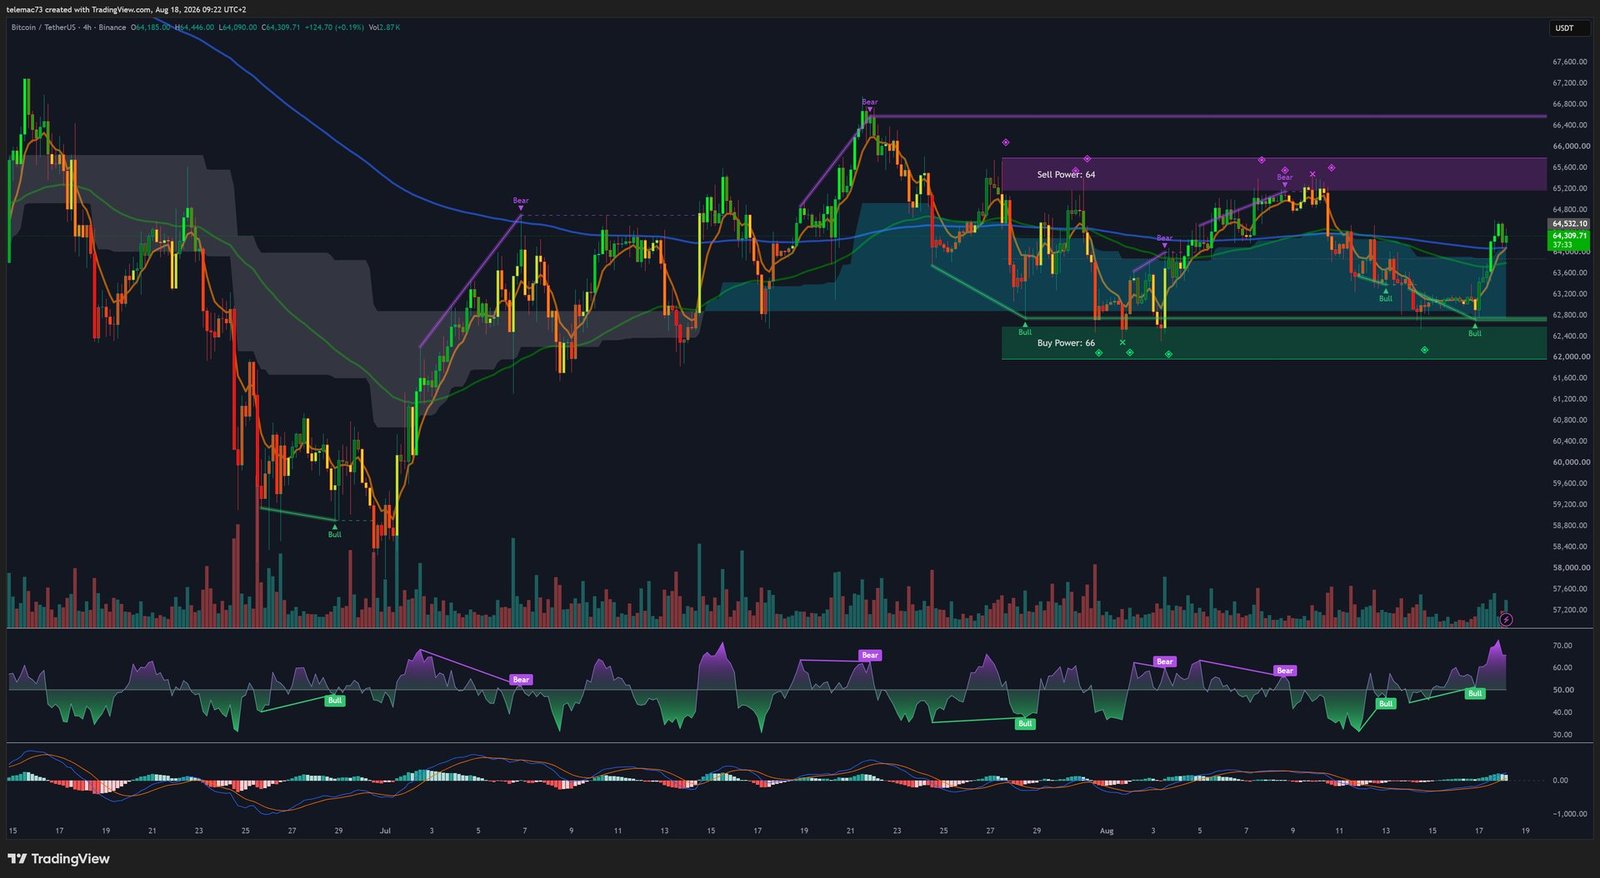
The 4-hour chart highlights an acute consolidation phase, with an asymmetric compression triangle: consecutively lower highs meeting relatively flat lows, a sign of passive buyers vigorously defending a specific floor. That floor rests on a critical base between $62,000 and $62,500, reinforced by the 200-week SMA ($62,867) — considered the ultimate demarcation line between a secular bull market and a crypto winter.
Volatility, measured by the width of the recent trading range, has fallen to anemic levels, with compression down to roughly $845, clearly visible in the tightening of Bollinger Bands. This buildup of kinetic energy signals that an imminent resolution — whether a bullish breakout or a bearish breakdown — will likely arrive with considerable velocity and volume.
Intraday noise on the 15-minute chart
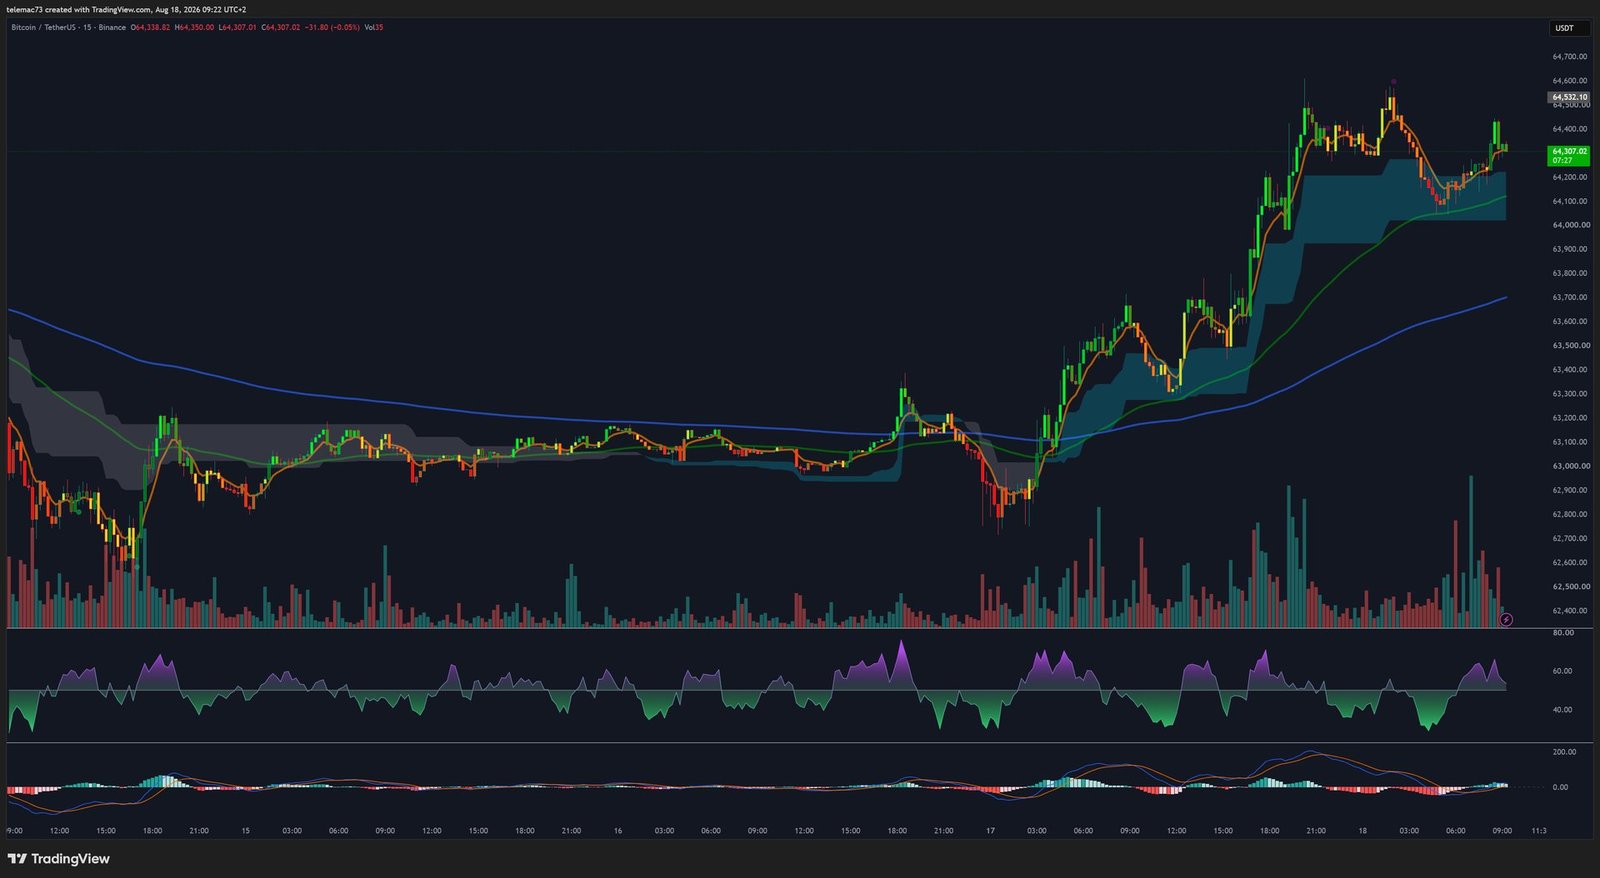
On the 15-minute chart, a succession of choppy micro-structures is visible. Bullish momentum attempts often materialize as brief short squeezes before running into the order walls identified on the heatmap. Intraday bull flags are systematically invalidated here: as soon as price approaches the rejection zone between $64,000 and $64,200, supply pressure absorbs demand. The struggle has produced staircase-like minor resistance shelves around $63,130 and $63,247, significantly capping relief rallies.
Oscillators and momentum: mixed signals
The weekly RSI hovers around 38-40, a downward-leaning level that hasn’t yet reached extreme exhaustion territory (below 30). In August 2024, a comparable oversold reading served as a catalyst for a 33% expansion in two weeks, propelling the asset from $49,000 to over $65,000. On the 4-hour chart, a possible bullish divergence is forming: while price prints lower lows, the RSI traces a sequence of higher lows — a signal that needs confirmation via a clear “elbow up” on upcoming closes. On the 15-minute chart, the oscillator reflects the market’s choppy nature, swinging around its neutral 50 zone without ever settling durably into overbought territory.
The weekly MACD remains deeply negative, reflecting uninterrupted seller dominance at the macro scale. On the daily, the histogram shows a slow contraction of its negative amplitude — a sign of gradually exhausting downside velocity — but the MACD and signal lines remain tangled below zero, awaiting a robust golden cross. On the 4-hour chart, erratic and repeated MACD crossovers confirm the classic signature of a market trapped in a sideways compression phase.
Bitcoin vs. Ethereum: a notable decoupling
During recent corrections, Bitcoin held up relatively well with a contained 8.5% decline, while Ethereum collapsed by 21.8%. This decoupling stems from excessive speculative positioning on ETH ahead of spot ETP approvals, creating structural fragility exacerbated by leverage. Ethereum’s transition toward Layer 2 solutions, while successful in terms of adoption, drastically reduces fee revenue on the main layer, generating valuation uncertainty. Grayscale’s broad digital asset sector index (CSMI) fell 13.2%, confirming that liquidity withdrawal is systemic rather than isolated to Bitcoin alone.
Summary table of critical technical levels
| Level | Estimated price (USD) | Significance |
|---|---|---|
| Absolute macro resistance | $84,410 | Major psychological barrier on the daily, “Sell Power” block |
| Institutional CME gap | $78,000 – $80,000 | Residual liquidity imbalance on CME futures (Nov. 2024) |
| Long-term dynamic resistance | $71,578 | 200-day EMA, underlying trend |
| Pivot resistance | $65,000 – $65,520 | Fibonacci 61.8% / 78.6% confluence and 50-day EMA |
| Short-term acceptance zone | $64,095 | Prior month’s equilibrium price |
| Intraday resistance | $63,713 | 20-day EMA |
| Minor support shelves | $63,130 – $63,247 | Local friction zones (15m) |
| Secular institutional support | $62,300 – $62,867 | 200-week SMA, 4H buy block |
| Yearly floor (ultimate support) | $57,800 | Yearly low, liquidity void below $62,000 |
Conclusions and strategic scenarios
The analysis of the Bitcoin ecosystem, from intraday microstructure to global macroeconomic dynamics, reveals an asset caught in a technical and fundamental vise. The repeated failure to climb above $64,000 stems from the combination of structural moving-average resistance, massive psychological pressure from the IBIT ETF overhang, and an impenetrable wall of limit orders stretching up to $67,000.
Bullish scenario: a strong, decisive daily close above $64,095, backed by expanding volume and a return of net positive ETF flows, would invalidate the 20-day EMA as resistance and open the path toward the 50-day EMA ($65,744), then the $68,400 band. The macro backdrop of a Fed rate-cutting cycle provides a fundamentally supportive setting for this scenario.
Bearish scenario: if the erosion of institutional demand persists, the 200-week SMA support ($62,867) could give way, triggering a cascade of stop-loss orders and exposing the market to a liquidity void toward the ultimate floor at $57,800.
Ultimately, the market demands strict strategic discipline: participants should avoid chasing ephemeral rallies until a technical acceptance above $64,500 is confirmed by a tangible recovery in demand across both derivatives and spot markets.
Disclaimer: this article is provided for purely educational and informational purposes. It does not constitute investment advice, a recommendation to buy or sell, or a solicitation to trade digital assets. Cryptocurrency markets are highly volatile and carry significant risk of capital loss. Always do your own research (DYOR) and consult a licensed financial advisor before making any investment decision.

