


Bitcoin trades at $77,315 this Saturday, 11.5% below the $87,385 peak reached on September 21. The last low, $76,270, was printed on October 30 on the H4 chart, as the Binance hack weighed on sentiment. The period low of $57,759 (date not provided) sits 34% lower. The market is in a distribution phase followed by a correction, and October is on track to be the worst month since 2014, with a 7.7% decline (Cointelegraph, October 30).
The dominant event is the Binance hack, roughly $6.3B according to Bitcoin Magazine (October 31). TRM Labs attributes it to the North Korean group TraderTraitor, around $3B has been frozen by stablecoin issuers, and Binance has set aside more than $6.34B to compensate users (Decrypt, October 30). Price fell to about $76,400, roughly 6% below its post-Fed level. The Fear & Greed Index sits at 30, down from 71 a month earlier (AMBCrypto, October 30): sentiment is weak, but not capitulating.
On the macro side, the Fed held rates steady, but Dallas Fed’s Lorie Logan says at least 50 basis points of further hikes are needed (MarketWatch, October 30). The ECB kept its deposit rate at 2.5% while flagging rising inflation risks (Reuters, October 29). US core PCE came in at 3.6% month over month, in line with consensus but accelerating from 3.4%. The Nasdaq fell 2.9% on Friday (CNBC, October 30), and that risk aversion weighs on an asset still tightly correlated with tech. The SEC’s proposal on crypto asset custody, open for comments until December 7 (Sullcrom, October 22), is a medium-term file.
Taken together, these factors support a short-term bearish bias. The week ahead, with midterm elections and the jobs report, should deliver the verdict.
Multi-Timeframe Technical Analysis
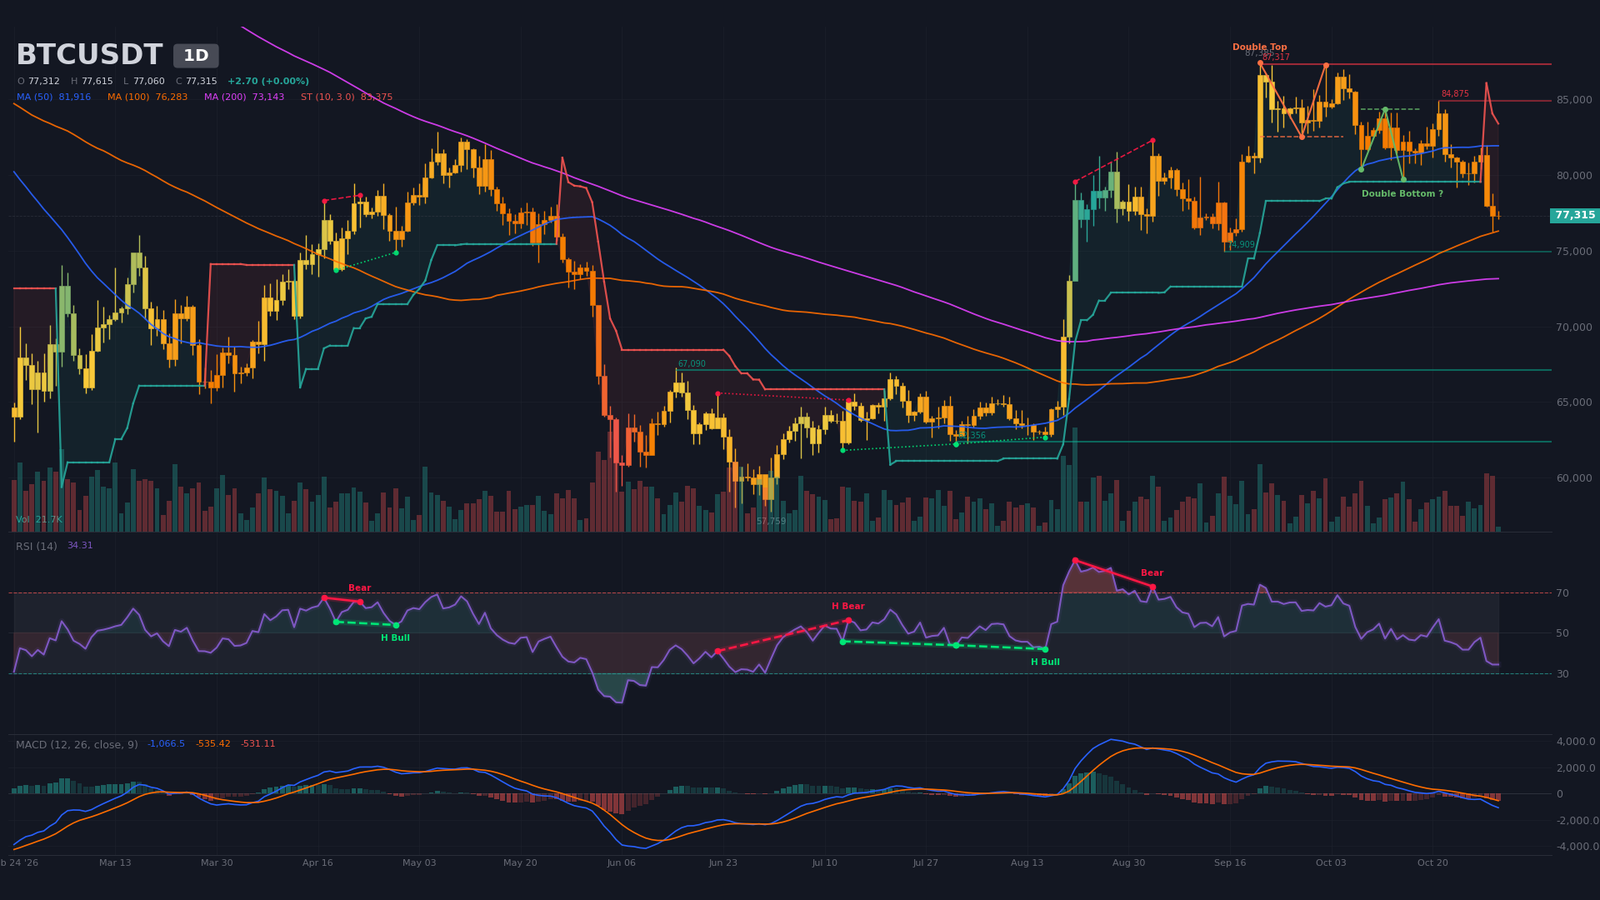
Daily Timeframe (1D): Confirmed Double Top, Target Nearly Reached
The medium-term trend is bearish. The double top at $87,385 (September 21) and $87,250 (October 2) is confirmed, with a neckline at $82,500 and a target at $77,683. Price now trades at that level, so the pattern’s objective is nearly consumed. The SuperTrend remains bearish at $83,375. Price sits below the SMA20 ($81,060) and SMA50 ($81,916), but above the SMA100 ($76,283) and SMA200 ($73,144). No 50/200 crossover is detected. A bullish double bottom (neckline $84,340, target $88,642) is flagged but unconfirmed.
RSI (14) is near 34, in the low zone without oversold extremes, after about 36 the previous session. The regular bearish divergence from August 21 to September 3 is old and already played out. MACD sits below zero and its signal line, with a negative histogram expanding since the bearish crossover on September 29 (32 candles). Today’s volume, at 16% of the 20-period average, is provisional and meaningless on a Saturday morning.
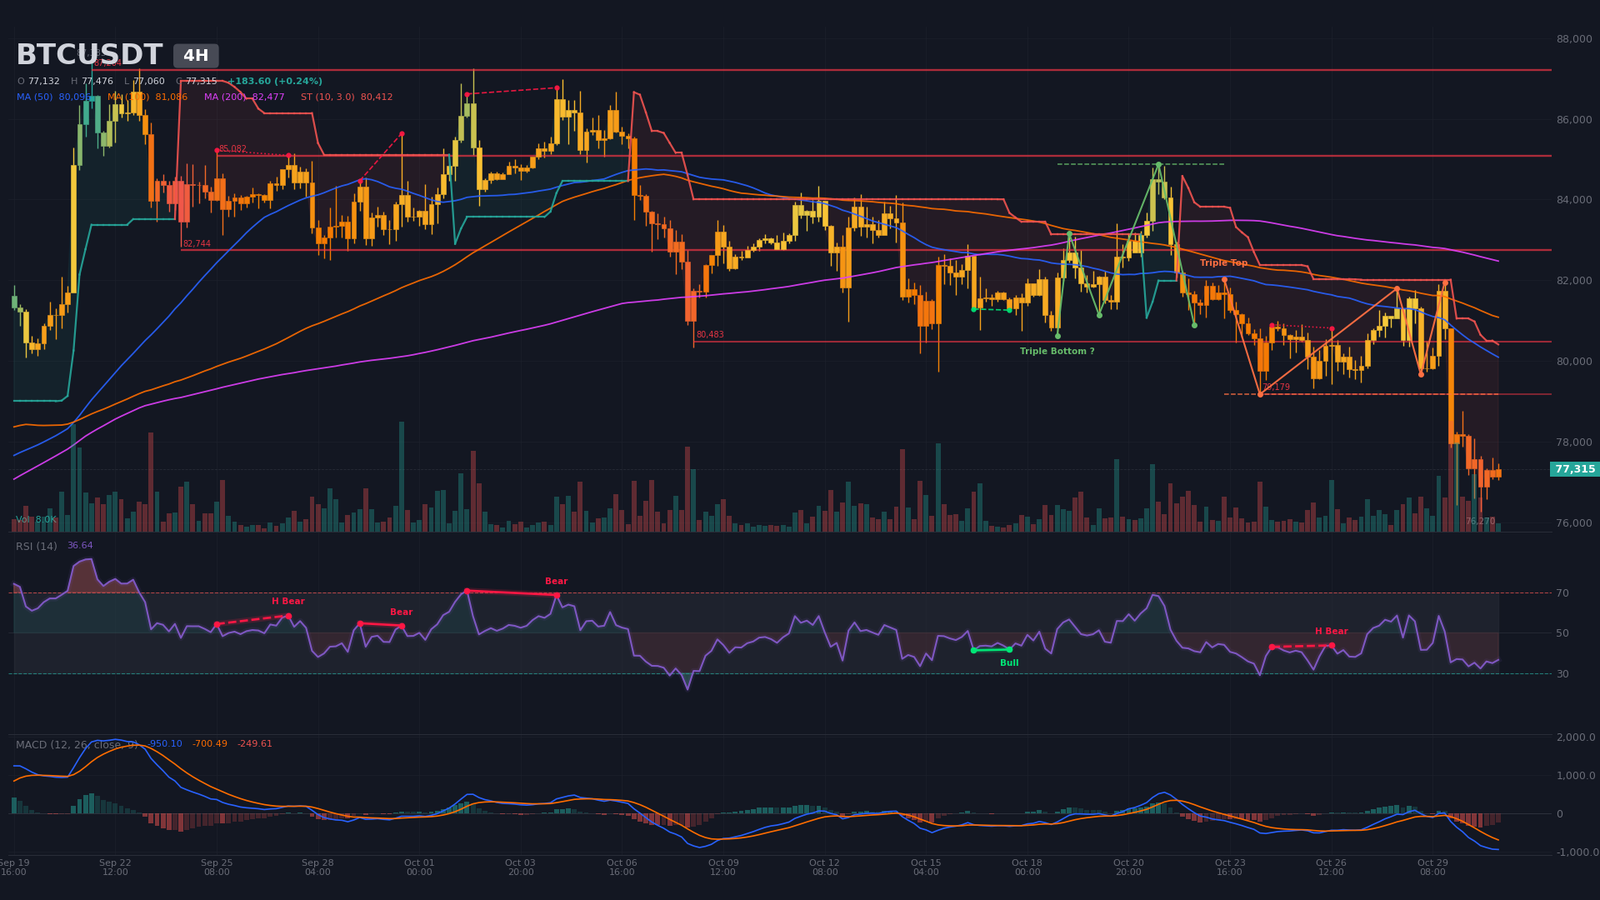
Intermediate Dynamics (4H): Confirmed Triple Top Below All Averages
The H4 confirms and amplifies the daily picture. The triple top, with a neckline at $79,180 and a target at $76,428, is confirmed; the $76,270 low slightly overshot that objective. Price is below the SMA20 ($79,351), SMA50 ($80,096) and SMA200 ($82,477), and the bearish SuperTrend sits at $80,412. Structure remains one of lower highs: $81,954 on October 29, then nothing above $78,777. A bullish triple bottom (neckline $84,875) remains unconfirmed.
RSI is near 37, after a low near 32 during the sell-off. MACD, below zero, crossed bearish on October 29 at 20:00; its histogram stays negative but is contracting. A hidden bearish divergence, a continuation signal, is flagged between October 24 and 26. Volume, at 25% of average, is provisional. The key point to watch is seller exhaustion: the October 30 lower wicks at $76,270 and $76,444 have not been extended.
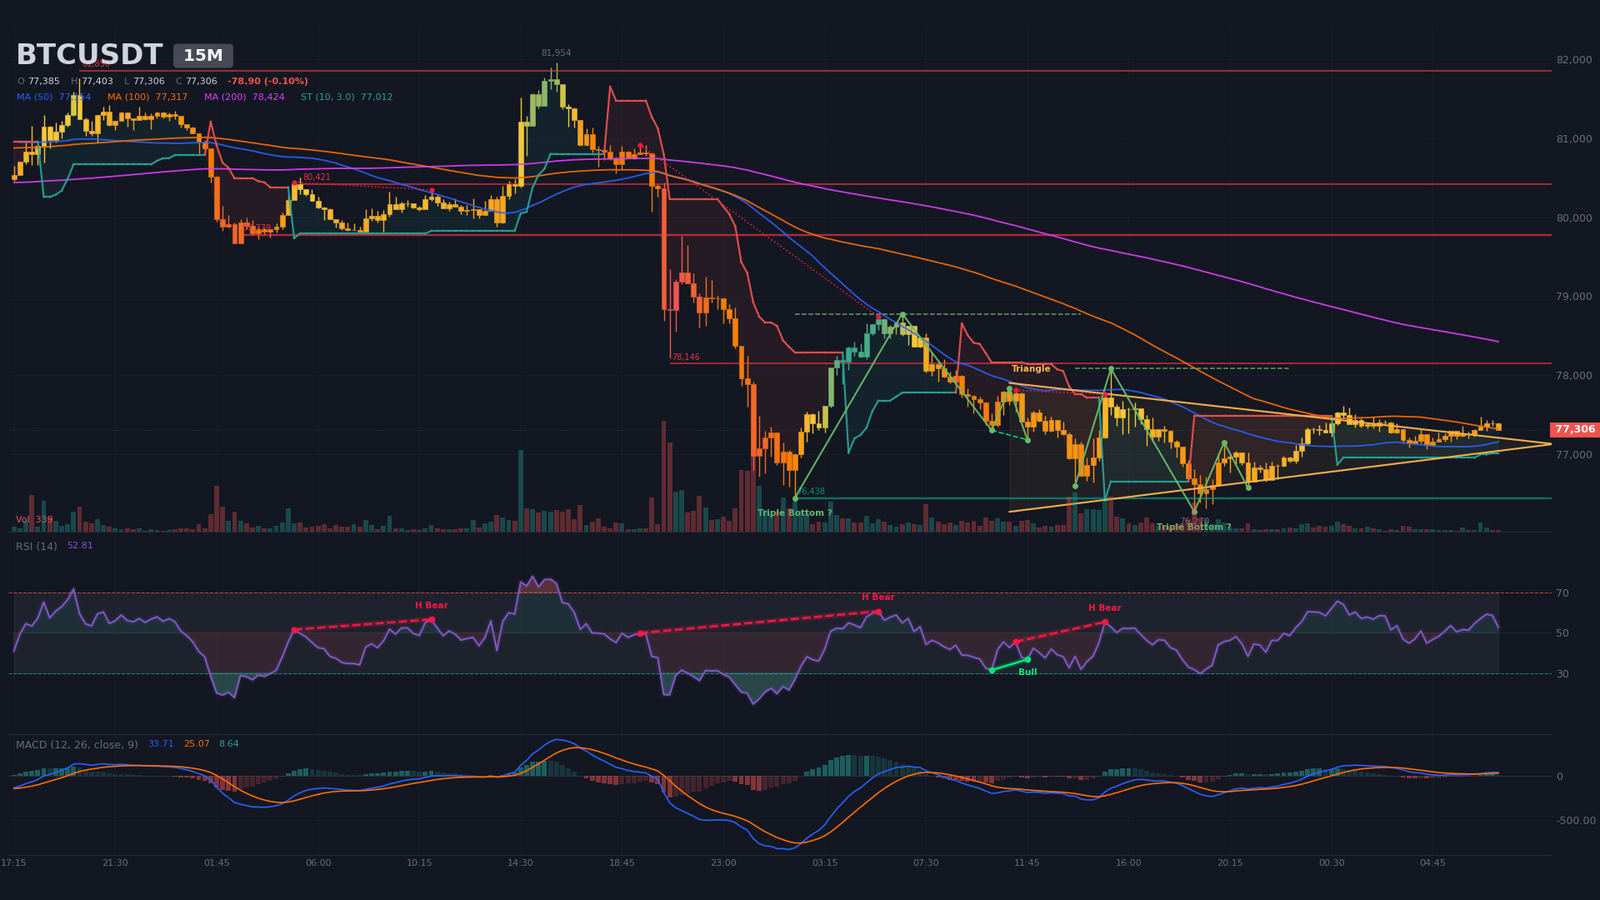
Intraday Structure (15m): Symmetrical Triangle in Compression
A symmetrical triangle has been detected since October 30 at 11:00, with an upper boundary at $77,308 and a lower boundary at $76,927. Its apex, estimated around 09:49 on the chart timestamp, is imminent. Price, at $77,306, is pressing the upper boundary, above the SMA20 ($77,259) and SMA50 ($77,154), and below the SMA200 ($78,424). The SuperTrend is bullish at $77,012, RSI sits near 53, and MACD is above zero after a bullish crossover on October 31 at 06:45. Volume at 61% of average signals compression without conviction. An upside break targets $78,100, then $79,780; a close below $76,930 opens $76,440, then $76,270.
Multi-Timeframe Synthesis
| Timeframe | Dominant trend | RSI (14) | MACD | Chart pattern |
|---|---|---|---|---|
| Daily (1D) | Bearish (correction) | ~34 | Below zero, bearish crossover on September 29, histogram expanding | Confirmed double top |
| 4 hours (4H) | Bearish | ~37 | Below zero, bearish crossover on October 29 | Confirmed triple top |
| 15 minutes (15m) | Neutral (compression) | ~53 | Bullish crossover on October 31 | Symmetrical triangle |
Key Levels and Pivot Map
Levels combine the classic daily pivots, detected support and resistance, pattern targets and necklines, moving averages and estimated liquidation pockets. No Fibonacci extension is used, as no clean reference impulse exists. The short-term central pivot sits near $77,450.
| Level | Price (USD) | Category | Technical basis |
|---|---|---|---|
| Major resistance 3 (R3) | $84,300 – $85,500 | Resistance | Daily double-bottom neckline ($84,340), Daily resistance $84,875, estimated short liquidation pockets ($84,270–$85,536) |
| Major resistance 2 (R2) | $82,500 – $83,400 | Resistance | Daily double-top neckline ($82,500), H4 resistance $82,744, estimated short pocket ($82,845–$83,162), Daily SuperTrend $83,375 |
| Immediate resistance (R1) | $78,100 – $79,200 | Resistance | M15 resistance ($78,146), Daily R1 ($78,636), H4 triple-top neckline ($79,179) |
| Central pivot (P) | $77,300 – $77,500 | Pivot | Daily pivot ($77,453), H4 pivot ($77,277), M15 triangle upper boundary ($77,308) |
| Immediate support (S1) | $76,100 – $76,450 | Support | October 30 low ($76,270), Daily S1 ($76,130), M15 support ($76,438, three touches), H4 triple-top target ($76,428) |
| Major support 2 (S2) | $74,900 – $75,400 | Support | Daily support ($74,909), Daily S2 ($74,947), estimated long pocket ($75,327–$75,406) |
| Major support 3 (S3) | $73,100 – $74,500 | Support | Estimated long pocket ($74,140–$74,456, about $94M), pocket ($73,506–$73,665), Daily SMA200 ($73,144) |
Order Book and Liquidity Heatmap
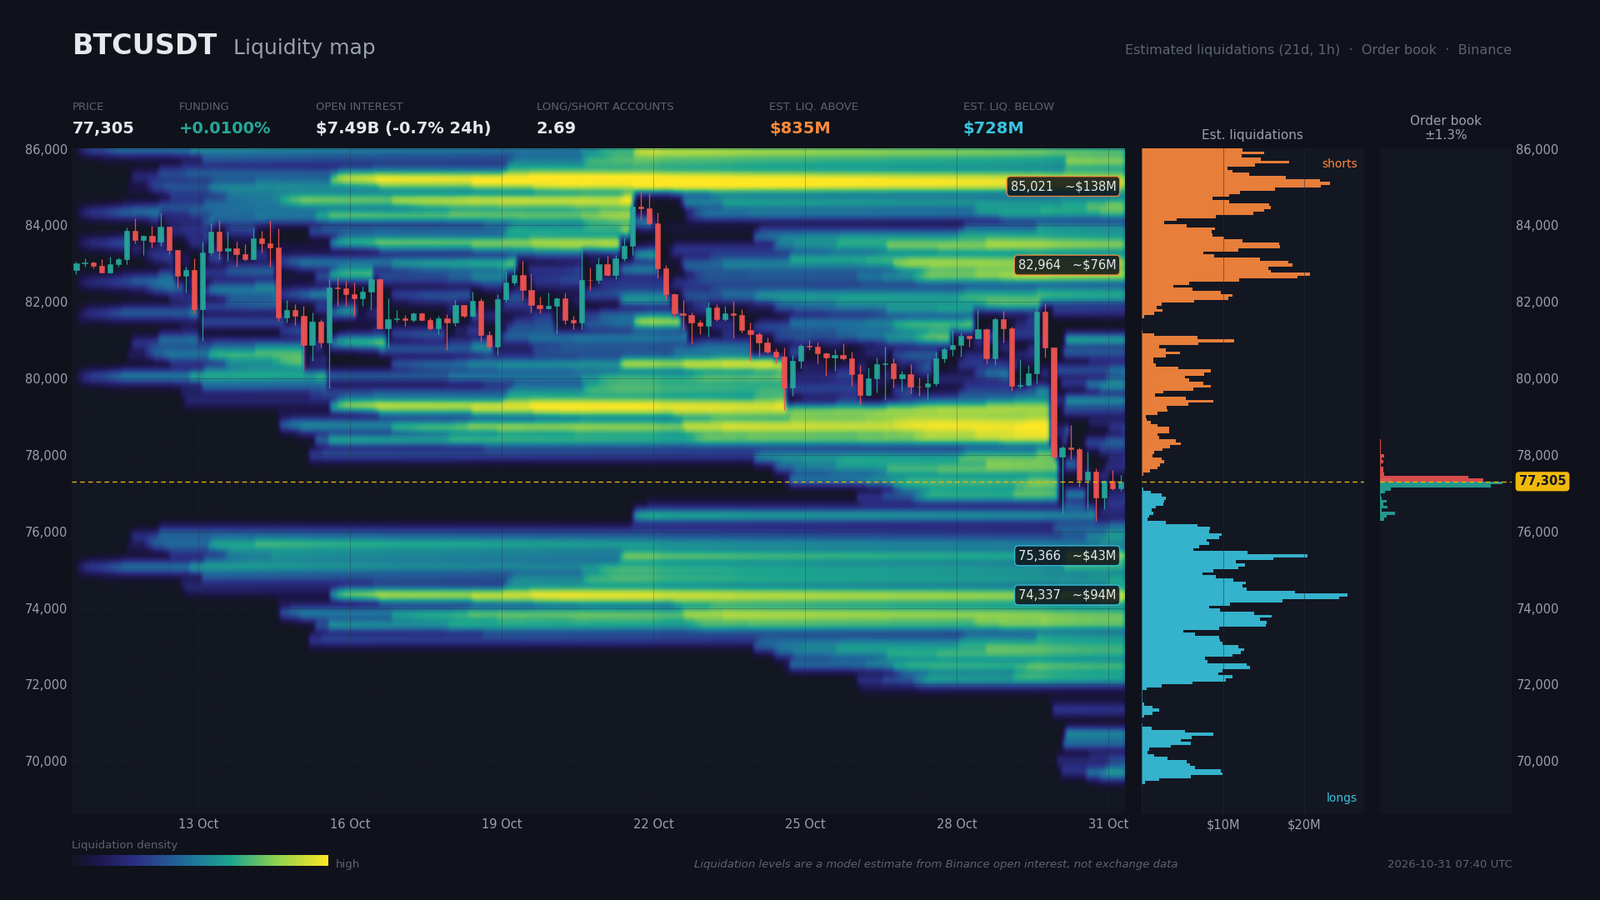
Real order book coverage is limited to 1.3% around the price. Sell walls sit at $25.7M at $77,345 (+0.05%) and $22M at $77,424 (+0.15%), facing buy walls of $30.5M at $77,266 (0.05% below) and $27.5M at $77,187 (0.15% below). Buyers hold a 17.6% imbalance within 2% ($75.7M versus $53.1M), but walls this close to price can be pulled quickly and feed the M15 compression.
Estimated liquidation zones (an open-interest model, not measured data) cluster above the price on the short side, for an estimated $835M, including $84,903–$85,536 (about $138M, +10%) and $82,845–$83,162 (about $76M, +7.3%). On the long side, for an estimated $728M, they sit at $74,140–$74,456 (about $94M, 3.8% below) and $75,327–$75,406 (about $43M, 2.5% below). Funding is neutral to slightly positive at 0.01% (10.9% annualized), and open interest of $7.49B is stable (down 0.74% over 24 hours), with no sign of a mass purge. The retail long/short ratio at 2.69 shows a crowd positioned for upside, while large traders are more measured at 1.75. The taker buy/sell ratio of 0.953 signals net selling pressure.
Mechanically, the setup favors a liquidity sweep of longs toward $75,300–$74,400, while a clean break above $78,100 could trigger a short squeeze. A rebound toward $82,800–$83,200 would be the bullish magnet, but it is further away.
Calendar: Catalysts to Watch
Recent releases were in line or slightly stronger, including the PCE, the ECB decision and German GDP, while China’s manufacturing PMI slipped back below 50 at 49.3. The decisive event remains the November 6 jobs report, preceded by the midterm elections on November 3.
- Monday, November 2, 02:45 (Zurich) — RatingDog China manufacturing PMI (consensus 51.6, previous 52.1), and at 16:00 ISM Manufacturing Employment (54.7, previous 52.7): a weak Chinese print would weigh on risk assets.
- Tuesday, November 3, 01:00 (Zurich) — US midterm elections, with JOLTS at 16:00 (7.1, previous 7.079): a political and fiscal repricing against the backdrop of the Fed path.
- Wednesday, November 4, 11:00 (Zurich) — eurozone flash inflation (consensus 3.9, previous 0.6, figures as provided), and ISM Services at 16:00 (54.8, previous 54.9): a hot print would reinforce hike bets.
- Thursday, November 5, 13:00 (Zurich) — Bank of England decision (hike vote: consensus 7, previous 3), a signal of global monetary tightening.
- Friday, November 6, 14:30 (Zurich) — US nonfarm payrolls (consensus 65,000, previous 29,000) and unemployment (4.2%): a strong surprise would reinforce Fed hike bets, negative for Bitcoin.
Three Scenarios for the Coming Weeks
The three scenarios cover the horizon up to the November 6 payrolls release. The probabilities are the analyst’s weightings.
Scenario A — Rejection below resistance, then bearish resumption (probability 50%)
Catalysts: the November 3 elections and the November 6 payrolls. Trigger: a rebound toward $78,100–$79,200 that gets rejected, or a break below $76,930 on M15. Path: $76,270, then $74,900–$75,400, the Daily support and estimated long pocket. A stop at $79,450 leaves about $1,050 of room, at least 1× H4 ATR ($1,025), with a risk/reward ratio (R:R) near 2.0 toward $76,300 and near 3 toward $75,400. Execution zone: selling between $78,100 and $78,700. Invalidation: H4 close above $79,200.
Scenario B — Technical squeeze toward the neckline zone (probability 30%)
Catalyst: China’s PMI and the ISM on November 2. Trigger: an M15 close above $77,310, then above $78,150. Path: $78,640, then $79,180, the target of the M15 triple bottoms at $79,681. The rebound would stall at the H4 SMA20 ($79,350) and the $79,780–$80,480 zone. Execution zone: tactical buy on a pullback to $77,200–$77,300, short-term trading only. Invalidation: M15 close below $76,930.
Scenario C — Bearish invalidation and reversal (probability 20%)
Trigger: H4 close above $80,500, after a dovish macro surprise or a weak payrolls print. Path: $82,500–$83,400, the estimated short pocket, the Daily neckline and the SuperTrend, then the Daily double bottom (neckline $84,340, target $88,642, hypothesis). Execution zone: buy on a confirmed recovery above $80,500. Invalidation: H4 close back below $79,200.
Synthesis and Conclusion
The current phase is distribution followed by correction. The targets of both bearish patterns, $77,683 on the daily and $76,428 on H4, have been reached, which opens room for a technical rebound, but no bullish structure is confirmed. The Binance hack and restrictive macro weigh on the market, while large-holder accumulation, a Fear & Greed reading of 30 and stable open interest prevent capitulation.
The dominant technical strategy is to sell rebounds below $79,200 or on a confirmed break of $76,270. The protection level is an H4 close above $79,200, then above $80,500. Weekend liquidity is thin, which calls for caution until November 2. Critical levels: $76,100–$76,450, $77,300–$77,500, $78,100–$79,200, $74,900–$75,400 and $82,500–$83,400.
Sources
- Binance Hack: Why Bitcoin Didn’t Crash Like It Did in 2018 — Decrypt, October 30, 2026
- Bitcoin risks worst October in 12 years as tech sell-off spreads to gold — Cointelegraph, October 30, 2026
- What to Know About the $6.3 Billion Binance Hack — Bitcoin Magazine, October 31, 2026
- Binance investigating hack as suspicious outflows reach up to $5.8 billion — The Block, October 29, 2026
- Binance Sets Aside $6.34B to Cover Hack Losses, CEO Says ‘Your Assets Are Safe’ — Decrypt, October 30, 2026
- The Fed held interest rates steady, but these officials see more hikes coming soon — MarketWatch, October 30, 2026
- ECB keeps rates unchanged but points to mounting inflation risk — Reuters, October 29, 2026
- Midterms, Apple earnings, jobs report. Wall Street faces a big week ahead just as investors dump tech — CNBC, October 30, 2026
- ‘Crypto moves forward regardless’ – Why Grayscale is looking past the U.S. midterms — AMBCrypto, October 30, 2026
- Bitcoin Whale Wallets Reach Record 20,338 as Large Holders Defy October Slide — BigGo Finance, October 16, 2026
- SEC Proposes Significant Changes to Custody Rules and Introduces Framework for Custody of Crypto Assets — Sullcrom, October 22, 2026
- Tether’s excess reserves nearly double to $8B as Q3 profit hits $1.5B — Cointelegraph, October 30, 2026
- Binance Hack Shows Why Offshore Exchanges Need US Oversight, CFTC Chair Says — Decrypt, October 30, 2026
- MSTR Q3 2026 Earnings Call: Analyst Q&A — Bitcoin Magazine, October 31, 2026
- Economic and crypto calendar (supplied) — Zurich time, October 31, 2026 (URL not provided)
Disclaimer: This article is for educational and informational purposes only. It does not constitute investment advice, a recommendation to buy or sell, or an invitation to trade any financial asset. Cryptocurrency markets are extremely volatile; any investment decision should be based on your own research (DYOR) and, where appropriate, the advice of a licensed financial adviser.

