

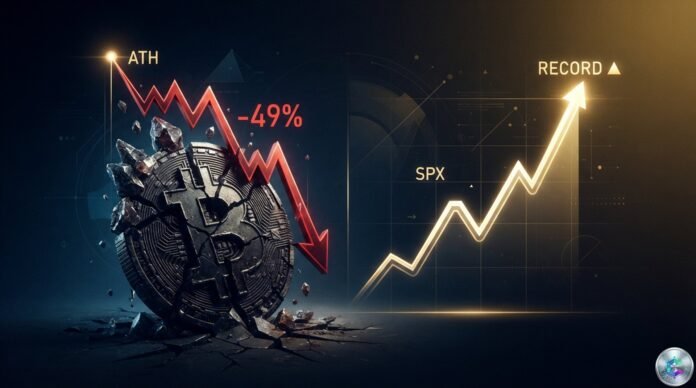
Bitcoin is ceding ground as equity markets surge. While the S&P 500 and the Dow Jones hit fresh all-time highs on the back of AI-related enthusiasm, BTC is hovering around $64,000, down roughly 49% from its October 2025 peak. A growing disconnect that puts the cycle’s dynamics into question.
🔑 Key takeaways
- Bitcoin trades near $64,000, down ~49% from the $126,296 ATH reached on October 6, 2025.
- The S&P 500, Dow Jones, and MSCI All-World index closed at record highs the same week.
- Previous bear cycles corrected by 77% to 94%; the current cycle sits at the low end of that range (47-49%).
- The average mining production cost (~$78,000) sits above the spot price, signaling a capitulation phase.
- Analysts point to a statistical bottom window around October 2026, ~365 days after the peak.
Crypto lags behind equities
August 2026 highlights a sharp decoupling between the crypto market and global equity indices. Over seven days, Bitcoin remained essentially flat around $64,000, while major U.S. and Asian benchmarks smashed through their records. The MSCI All-World index gained 0.4%, moving within reach of a new closing high, while the APAC benchmark rose 2.2%, boosted notably by South Korea, where SK Hynix jumped 6.4% in pre-market trading in Seoul.
Across major cryptos, weekly moves were muted, often negative. Ethereum dropped roughly 2% to $1,864, XRP slipped close to 1% to $1.07, Dogecoin hovered just below $0.07, and Tron lost less than 1% to $0.33. Solana held near $73.60. Only BNB (+5% on the week to $598) and Hyperliquid (HYPE, +3% to ~$56) managed to stand out.
| Asset | Price (Aug 2026) | Weekly change |
|---|---|---|
| Bitcoin (BTC) | ~$64,000 | Flat |
| Ethereum (ETH) | $1,864 | -2% |
| BNB | $598 | +5% |
| Solana (SOL) | ~$73.60 | Flat |
| XRP | $1.07 | -1% |
| Dogecoin (DOGE) | < $0.07 | -1% |
| Tron (TRX) | $0.33 | < -1% |
| Hyperliquid (HYPE) | ~$56 | +3% |

A disconnect that reveals internal dynamics
Three consecutive sessions of falling oil prices, easing rate expectations, and stock buybacks failed to lift cryptos. According to CoinDesk’s analysis, the current resistance levels are driven primarily by factors internal to the digital asset market rather than by global macroeconomics.
“Crypto’s resistance appears more driven by internal market dynamics than by macroeconomic factors. A market that does not rally on the basis of a potential deal and still does not bounce on its confirmation is telling you buyers have rotated to other sectors.”
CoinDesk, analysis dated August 5, 2026
The contrast with November 2024 is striking. Back then, Donald Trump’s election victory triggered the so-called “Trump trade”: Bitcoin hit a new record above $77,000, up ~10.6% over seven days and 70% year-to-date. The S&P 500, Dow Jones, and Nasdaq gained 4.66%, 4.61%, and 5.74% respectively on the week, with Tesla leading the pack (+29% weekly, market cap back above $1 trillion).
Bitcoin bear cycles: a recurring pattern
The current correction is not a historical anomaly. The three previous Bitcoin bear cycles all posted far steeper drawdowns: -94% in 2011, -84% between 2017 and 2018, and -77% between November 2021 and December 2022 (from ~$69,000 to ~$15,500). The fourth cycle, whose peak was recorded on October 6, 2025 at $126,296, currently sits at the lower end of the historical range.
| Cycle | Peak | Trough | Drawdown |
|---|---|---|---|
| Cycle 1 (2011) | ~$31 | ~$2 | -94% |
| Cycle 2 (2017-2018) | ~$20,000 | ~$3,200 | -84% |
| Cycle 3 (2021-2022) | ~$69,000 | ~$15,500 | -77% |
| Cycle 4 (ongoing) | $126,296 (Oct 2025) | In progress | -47 to -49% |
According to Galaxy Research, each successive cycle has shown shallower drawdowns. This softening trend is attributed to the arrival of institutional players, notably through spot Bitcoin ETFs, which have brought more stable liquidity and more sophisticated hedging mechanisms.
Current pressure factors
Three forces are weighing simultaneously on the BTC price. First, spot Bitcoin ETF outflows reached a record of roughly $4.4 billion, weakening the structural buying support. Second, the Fed’s restrictive monetary policy continues to weigh on risk assets, with inflation proving more persistent than expected.
Third, mining pressure is intensifying. The average cost of producing one Bitcoin is now estimated at around $78,000, while the hashprice (daily revenue per unit of computing power) sits at just $29. This configuration pushes many miners into operating losses, forcing them to liquidate part of their reserves to cover costs. Compounding the situation, MicroStrategy (now Strategy) holds about 481,770 BTC acquired at a high average cost; its preferred share class STRK has fallen below par, reflecting investor anxiety over a possible forced-selling risk.
Technical signals and outlook
Several on-chain indicators outline a configuration of advanced stress, but not yet terminal capitulation. The MVRV ratio stands around 0.25, close to but still far from the 0.8-1.0 zone historically tied to cycle bottoms. The NUPL sits at 0.20, with 54% of supply in profit. Long-term holder addresses hold a cycle-record 16.3 million BTC, and the Fear and Greed Index dropped to 11 in June, a level of extreme fear.
| Indicator | Current value | Historical bottom zone |
|---|---|---|
| MVRV | ~0.25 | 0.8 – 1.0 |
| NUPL | 0.20 | < 0 |
| Supply in profit | ~11.1M BTC (54%) | Convergence with supply in loss |
| Supply in loss | ~8.9M BTC | Convergence with supply in profit |
| LTH (155d+) | 16.3M BTC (record) | Continuous rise |
Analyses cited by 21jingji and cls.cn point to a consolidation range of $58,000 to $68,000 in the short term, with a statistical bottom expected around October 2026, ~365 days after the October 2025 peak, in line with the average of previous cycles. Over the long term, miners diversifying into AI and the structural maturity of the market (ETFs, institutional custody) leave the next expansion cycle in 2027-2028 looking favorable.
Conclusion
Bitcoin is going through a slow capitulation phase, typical of mid-bear cycles: mining pressure, ETF outflows, persistent divergence with equity indices. Two scenarios dominate for the coming months: a prolonged consolidation between $58,000 and $68,000 leading to a late bottom around October 2026, or an accelerated capitulation triggered by a macroeconomic shock or stress on MicroStrategy/Strategy, potentially pulling the price toward the $50,000 area. In either case, current levels are approaching historically profitable accumulation zones for patient investors.
Sources
- CoinDesk – Bitcoin flat at $64,000 as stocks print records
- STCN – Chinese crypto market coverage
- Bit.com – Bitcoin cycles analysis
- CLS – Technical analysis and ETF flows
- 21jingji – Mining pressure and on-chain indicators
- Moomoo Community – Bitcoin drops 50% from ATH
This article is published for informational and educational purposes only. It does not constitute investment advice. Do your own research (DYOR) before making any decision.

