


Bitcoin (BTC) has just delivered one of the most spectacular moves of its recent history, brushing against the symbolic $80,000 mark in the closing days of August 2026. This is no ordinary bout of volatility: it is the product of a rare alignment between a major macroeconomic shock, a rapidly shifting market microstructure, and an unprecedented wave of liquidations. Here is a full read of the move, from the macro backdrop down to the smallest intraday timeframes, including a breakdown of the liquidity heatmap.
The macro trigger: the US Treasury reshuffles the deck
On August 19, 2026, the US Treasury Department, through Secretary Scott Bessent, announced a doubling of its long-term bond buyback operations, raising the cap from $2 billion to at least $4 billion per operation, effective September 9, 2026. The buybacks primarily target maturities of 10-20 years and 20-30 years.
The announcement immediately compressed bond yields: the 30-year yield, which had been sitting near a two-decade high of around 5.34%, fell back to roughly 5.19%. A Bloomberg index tracking Treasuries with maturities beyond 20 years jumped 1.7% in a single session, its sharpest daily gain since February 2025. In modern financial architecture, the risk-free rate acts as the gravitational force that anchors the valuation of every asset class: a sharp drop mechanically lowers the opportunity cost of holding non-yielding assets such as gold or Bitcoin, while weakening the US dollar.
The impulse quickly spread across the entire crypto ecosystem: Ethereum gained between 9% and 18% depending on the trading window, while Solana, XRP, BNB and Cardano rode the broader risk-on wave. Crypto-linked equities followed suit, led by Coinbase and Robinhood. This backdrop was reinforced by a more favorable US regulatory climate, amid talk of a strategic BTC reserve and expectations around the CLARITY Act, gradually turning short-term speculative flows into long-term institutional allocations.
Reading the heatmap: where does the real liquidity sit?
Unlike candlesticks, which only show the history of executed prices, the liquidity heatmap maps order book depth and reveals the latent intentions of large players. It highlights the buy and sell walls that act like magnets or barriers for price.
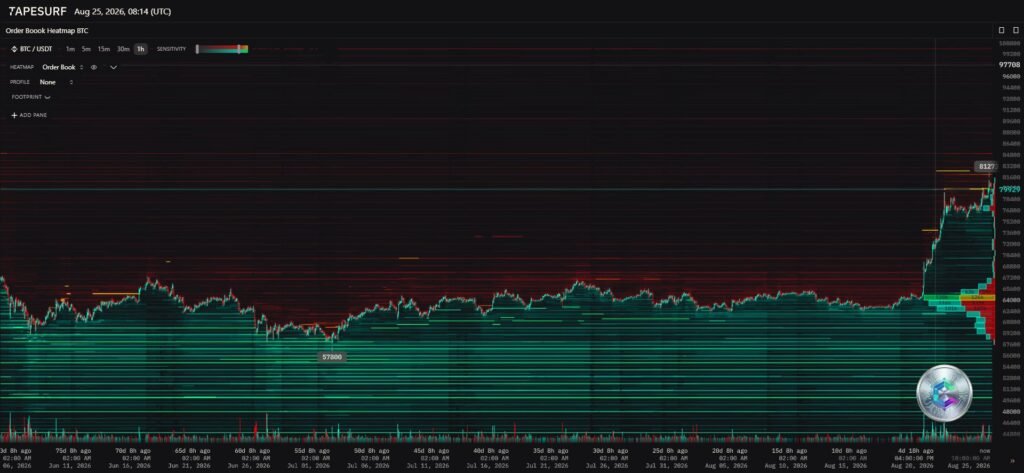
The $57,500 level held for weeks as an absolute floor, underpinned by quiet but massive accumulation: on-chain data shows roughly 43,000 BTC accumulated by whale wallets over sixty days, worth close to $2.64 billion, even as broader market sentiment stayed depressed. This methodical absorption gradually drained the market of natural sellers.
Since the breakout, buy-side liquidity has migrated higher, with new support bands forming around $72,000 – a dynamic “cushion” that could absorb a short-term pullback. On the other side, the $80,000-$84,000 range concentrates a dense institutional sell wall, likely fed by miners covering operating costs after a 20%+ weekly rally, as well as institutional profit-taking.
Two scenarios now compete at this wall: absorption via continued ETF spot demand ($1.11 billion in net inflows between August 17 and 20), which would open the door to a new price discovery phase above $82,000; or a microstructural rejection – a classic “stop hunt” – where price briefly probes the zone before a sharper pullback aimed at rebalancing buyers and sellers.
| Price level (USD) | Liquidity type | Interpretation |
|---|---|---|
| ~$81,000 | Ask orders (sell) | Extreme supply concentration, primary resistance |
| ~$72,000 | Bid orders (buy) | Recently formed algorithmic support, reload zone |
| ~$63,000 | Historical pivot | Median realized price, former summer support |
| $57,500 | Macro floor | Historical whale buying density |
Daily chart (1D): the return of an institutional bull market
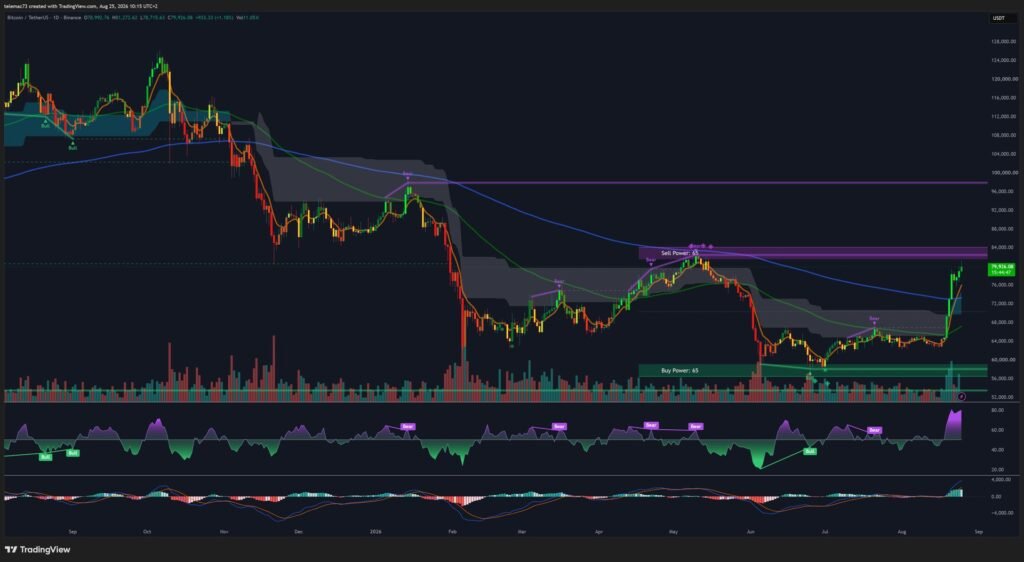
The daily chart offers the macro perspective needed to judge the primary trend. The most striking structure of recent months is a classic, historically reliable reversal pattern: the inverse head and shoulders. Three successive troughs, with a deeper central low flanked by two shallower shoulders, defined a critical neckline around $66,600. Its decisive breakout acted as the technical trigger for the current parabolic move, forcing the capitulation of short positions leaning on that resistance.
Price also broke sharply above its 100- and 200-day moving averages – the latter universally regarded as the dividing line between bull and bear markets. A key algorithmic support now sits around $62,000, a zone that lines up with the on-chain median realized price – the average acquisition cost of all circulating coins. As long as price stays well above it, the risk of broad panic selling remains limited.
On the oscillator side, the daily RSI has pushed into extreme overbought territory, well past the classic 70 threshold. In the context of a macro structural breakout, this doesn’t necessarily signal an imminent reversal but rather a shift in volatility regime, where price-inelastic demand pushes buyers to accept increasingly higher premiums. The MACD confirms this reading with a clean bullish crossover (golden cross) and an expanding histogram, evidence that trend acceleration remains active on the macro timeframe.
4-hour chart: the mechanics of the short squeeze
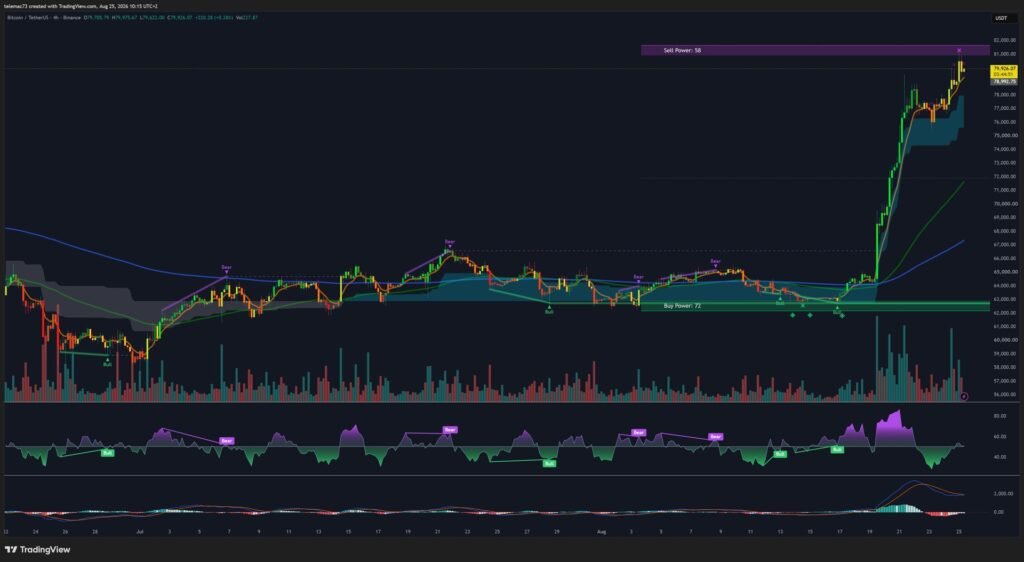
The near-vertical rally visible on the 4-hour chart is largely explained by a textbook short squeeze. Before the bounce, as price struggled around $64,000 amid thin liquidity, a significant number of leveraged traders had built short positions, betting on a rejection below the old $65,000 resistance. The Treasury announcement trapped those positions: each forced liquidation triggered an automatic market buy, fueling the next leg higher in a self-reinforcing feedback loop.
The scale of the episode is striking: over $460 million in short positions liquidated as price broke above $71,000, followed by more than $1 billion within 24 hours, before an estimated total ranging between $2.7 and $3.5 billion in liquidated derivatives positions across the entire move – the 7th-largest liquidation event in crypto history, adding roughly $280 billion in market capitalization in a single day.
On the chart, this phase translated into a series of small bull flags, each resolving quickly to the upside. But the flip side of this mechanical ascent is marked technical overheating: the 4H RSI shows extreme saturation and price trades at an unusually wide distance from its short-term moving average, like a fully stretched elastic band. The MACD histogram is also flattening, a sign that the liquidation-driven acceleration is starting to fade. The resistance zone identified just above $81,000 confirms that further upside will now hinge on the depth of organic spot demand rather than the mechanical effect of liquidations alone.
15-minute chart: digestion and oscillator reset
On the intraday timeframe, the market’s post-$79,000 breakout phase shows typical digestion, taking the shape of a compression triangle or a high-tight flag. This structure results from the interplay between smart money taking partial profits on positions opened around $60,000, and retail demand driven by fear of missing out (FOMO) absorbing that supply. The short-term moving average acts as a dynamic support, with price bouncing off it with notable precision.
Notably, the 15-minute RSI has managed a full “reset” back toward neutral territory (around 50), giving the market the energy needed to attempt another leg higher without carrying excess leverage. The MACD, meanwhile, shows a mild “death cross” well within positive territory – a signal that, within a parabolic uptrend, reads more as a minor distributive pause than a genuine reversal, and one that has historically marked an accumulation opportunity inside the broader bull flag.
On this timeframe, three pivot levels stand out for short-term order routing: resistance (R1) around $80,500, matching the latest local swing high; a control point around $79,500, the current equilibrium zone; and support (S1) around $78,200, the immediate floor of the ongoing consolidation.
Institutional flows and risk factors
The rally isn’t built on derivatives unwinding alone. Spot Bitcoin ETFs recorded nearly $1.11 billion in net inflows over three sessions, including single days of $517.2 million and $103.3 million, pointing to systematic accumulation from traditional finance. These flows mechanically remove BTC from exchange circulation, tightening available supply. Ethereum ETFs saw a comparable spillover effect, pulling in roughly $291 million, a sign of the market’s broader maturation.
Two vulnerabilities still deserve close monitoring. First, a possible “low-volume liquidity trap”: before the Treasury-driven impulse, several on-chain analytics platforms had already warned of a market rising mainly on liquidations rather than genuine order book depth – a structurally fragile setup should ETF flows suddenly reverse. Second, the macro catalyst itself is a double-edged sword: an overly accommodative easing of financial conditions could reawaken inflationary pressures and force the Federal Reserve to tighten its tone, triggering a rotation out of non-yielding assets and a potential correction toward the macro pivot at $66,600.
In summary
Bitcoin’s move in late August 2026 illustrates the collision between a supportive macro tailwind – the US Treasury intervention and falling bond yields – and a heavily imbalanced market microstructure, in which several billion dollars in short positions were wiped out. The daily chart confirms the return of a fundamental institutional bull market; the 4-hour chart flags short-term overheating that calls for caution; and the 15-minute chart shows buying pressure still managing, for now, to absorb profit-taking.
What happens next will largely be decided at the liquidity wall identified between $80,000 and $84,000. As long as organic accumulation – ETF and on-chain flows – keeps outpacing mechanical liquidation-driven buying, pullbacks should continue to be treated as strategic opportunities rather than reversal signals.
Disclaimer: This article is provided for informational and educational purposes only. It does not constitute investment advice, a recommendation to buy or sell, or a financial solicitation of any kind. Cryptocurrency markets are highly volatile and carry a risk of capital loss. Always do your own research (DYOR) and consult a qualified financial advisor before making any investment decision.

