


Bitcoin (BTC/USD) is standing at a strategic crossroads. The technical compression visible across multiple timeframes is coinciding with a global monetary pivot of rare magnitude. This analysis combines order-book liquidity mapping, multi-timeframe chart study, and the macroeconomic backdrop to map out the scenarios ahead.
A Macro Backdrop Turning Favorable Again
After a prolonged period of restrictive policy, the US Federal Reserve cut its benchmark rate by 50 basis points, bringing the upper bound to 5.00%. Futures markets are now pricing in aggressive further easing, with a terminal rate projected around 3% by 2025. This shift mechanically boosts available liquidity, compresses bond yields, and weakens the US dollar — a combination that has historically favored assets with inelastic supply, such as Bitcoin.
This move is not confined to the United States. The ECB, the Bank of Canada, the Swiss National Bank, and the Bank of England have all begun easing cycles. The People’s Bank of China, for its part, delivered the largest cut in its history to medium-term lending rates. Global money supply (M2) is hitting new record highs — a phenomenon that has historically coincided with Bitcoin’s major bull cycles.
| Central Bank | Recent Policy Action | Anticipated Impact on BTC |
|---|---|---|
| US Federal Reserve | 50 bps cut to 5.00%, -125 bps projected by end 2025 | Dollar weakness, rotation into risk assets |
| People’s Bank of China | Historic MLF rate cut from 2.3% to 2.0% | Massive liquidity injection across Asia |
| ECB, SNB, BoE | Easing cycles underway | Expansion of global money supply (M2) |
This picture is nonetheless tempered by residual risks: a softening US labor market, threats from an unwind of the yen carry trade, and Bitcoin’s lingering sensitivity to its status as a high-beta risk asset in the event of a recessionary shock. Still, an economic contraction could accelerate the monetary response of central banks, reinforcing Bitcoin’s medium-term narrative as a hedge against fiat devaluation.
Institutional Flows and Regulatory Infrastructure
The market is emerging from a long, volatile consolidation phase fueled by government sell-offs and Mt. Gox trustee distributions. Underlying institutional demand, however, shows clear signs of resurgence: spot trading volumes have risen roughly 20%, while futures open interest jumped 12% week-over-week, a positioning pattern typically seen ahead of monetary easing.
On the regulatory front, the SEC’s proposed “innovation exemption” is setting the stage for the most favorable US environment since 2021. Meanwhile, Vanguard, the world’s second-largest asset manager, has opened access to crypto funds and ETFs on its platform — a development that significantly widens on-ramps for both institutional and retail clients. On-chain, illiquid supply continues to tighten, a sign that large wallets are back in active accumulation mode.
Liquidity Mapping: What the Heatmap Reveals
The order book offers a predictive read on where liquidity will be tested. Above current price, a dense wall of sell-side liquidity extends from around $64,500 up to roughly $69,000, explaining why the market has struggled to break out cleanly: every buy-side impulse is absorbed by substantial institutional inventory.
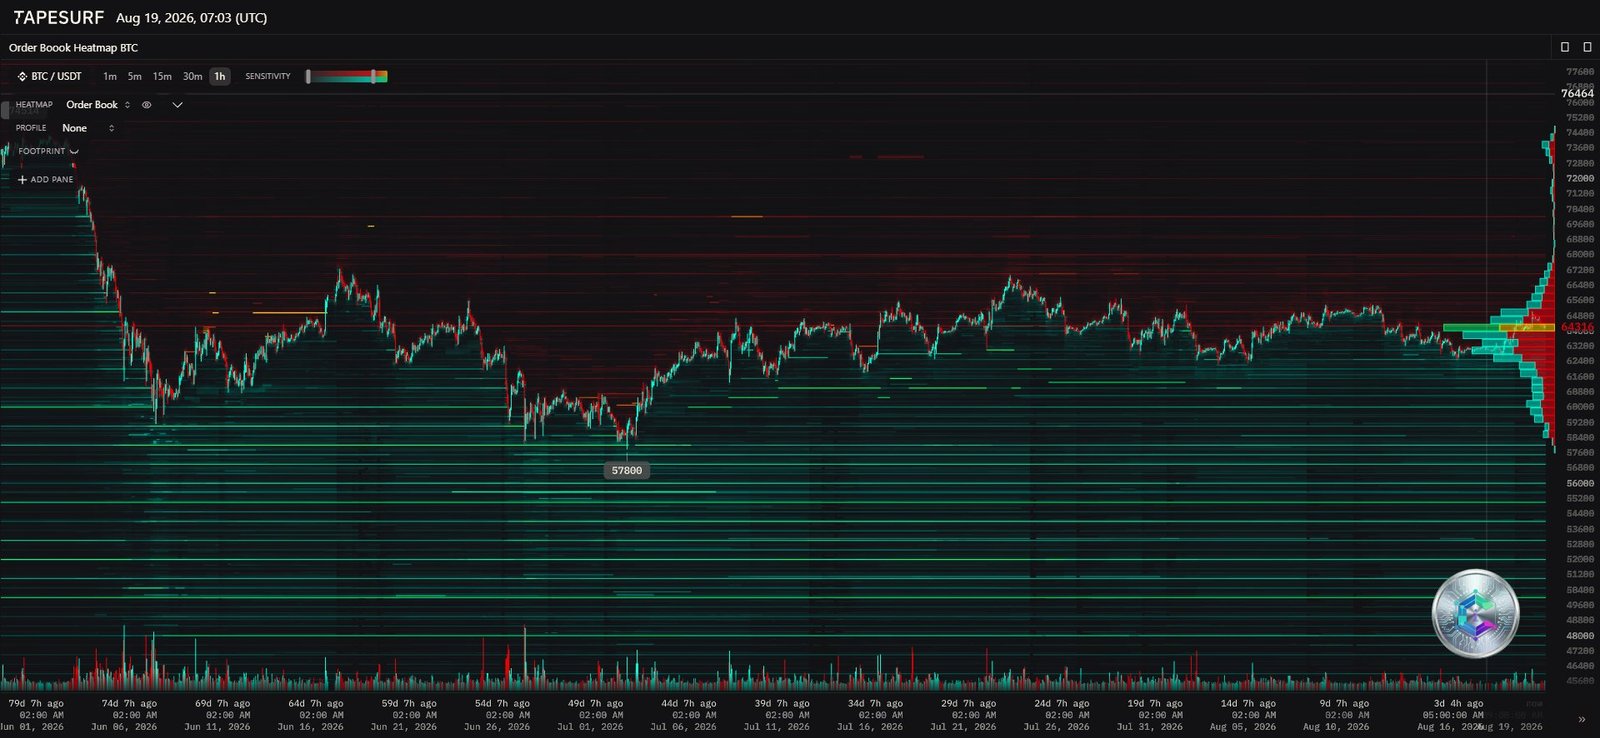
On the buy side, immediate support around $62,000 remains comparatively thin against the upper wall. Further down, however, a massive concentration of buy orders sits at $57,800, acting as a genuine liquidity sink. This asymmetry confirms that institutional players will defend the market below $60,000, but will demand further confirmation before releasing price beyond $65,500.
Multi-Timeframe Price Action
The Macro View — Daily Chart (D1)
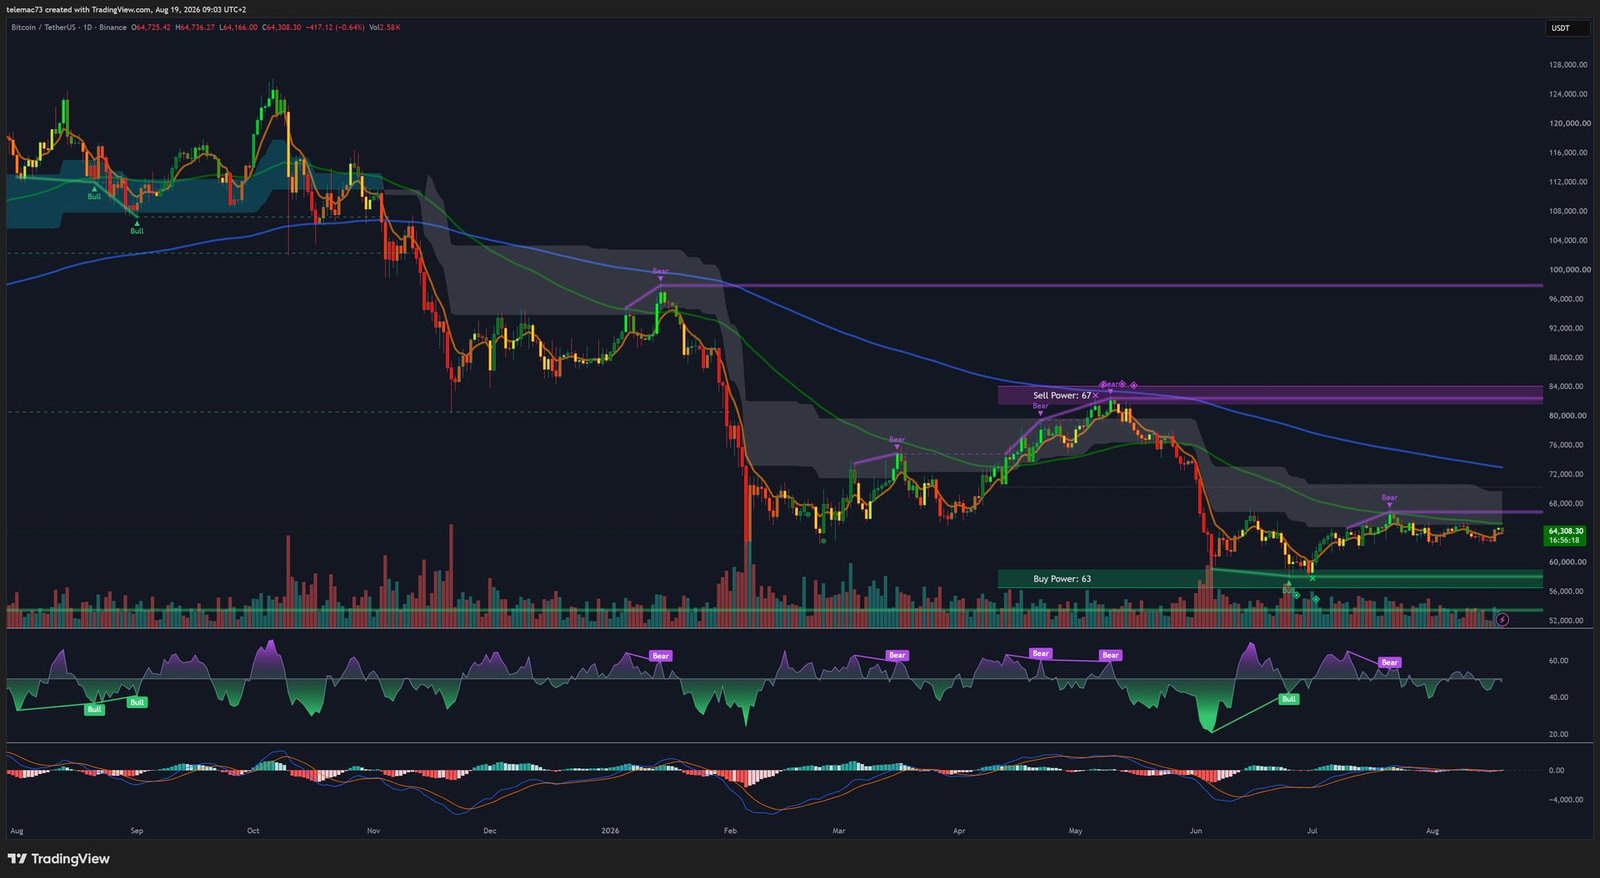
Since the March 2024 all-time high above $73,757, the market has endured a severe distribution phase before stabilizing into a broad consolidation range. BTC currently trades slightly above the critical support band around $59,635 and the summer lows. The daily RSI, having rebounded from 34 to 51, confirms the end of oversold conditions without yet signaling a decisive bullish push. On the MACD, a prolonged convergence below the zero line hints at a forming Golden Cross — a potential trigger for large-scale algorithmic buying if confirmed.
The Intermediate Trend — 4-Hour Chart (H4)
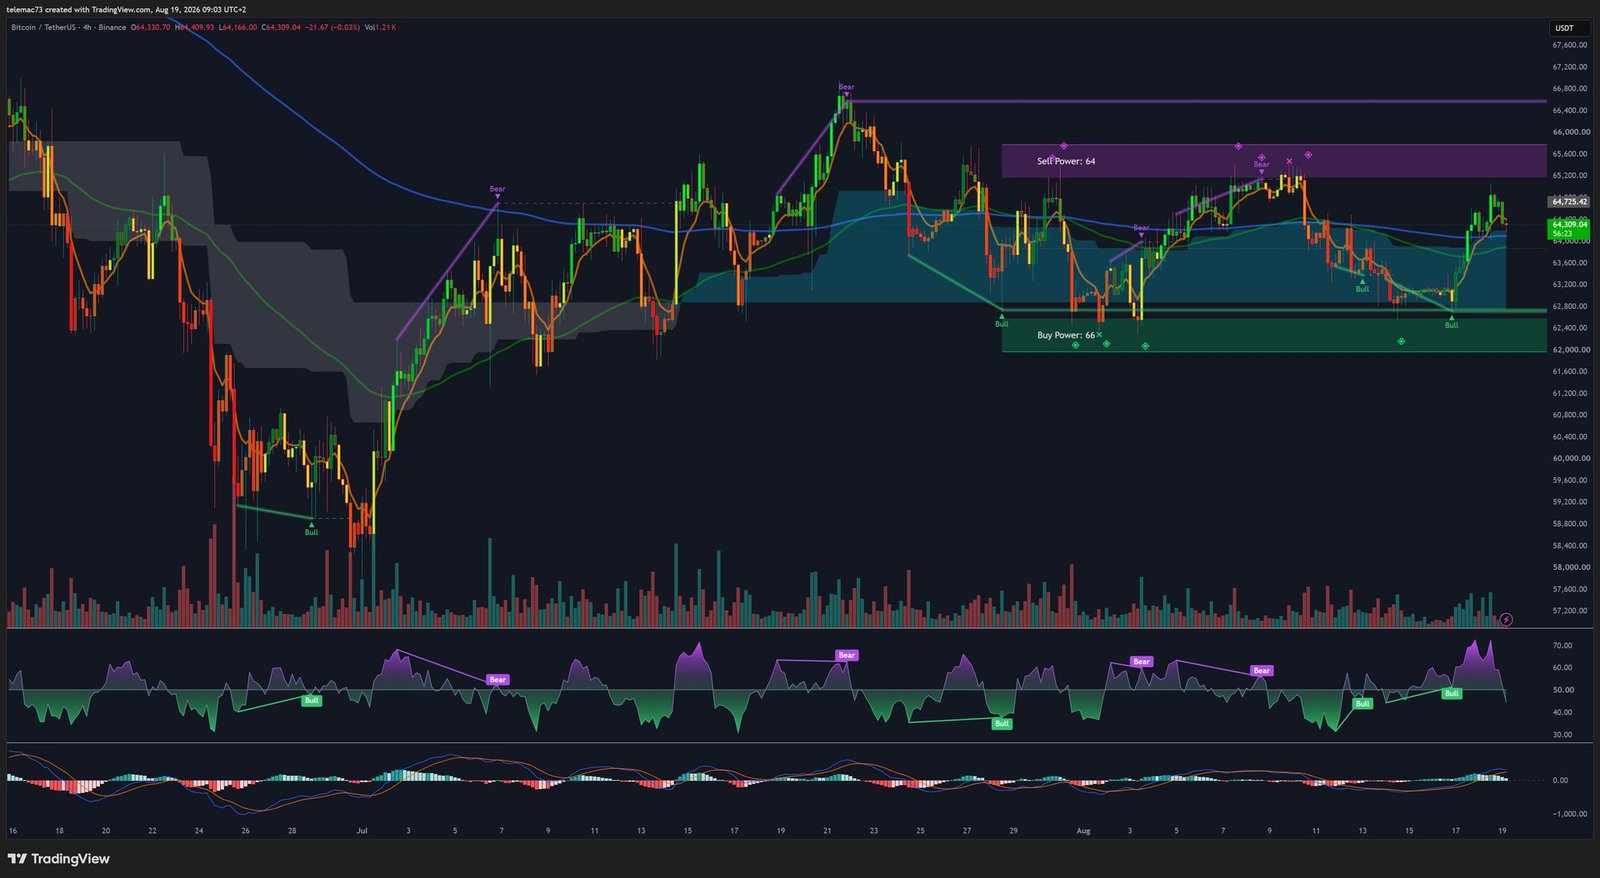
The H4 chart shows a broad ascending compression triangle: a rising trendline has supported price since $62,000, while a horizontal resistance around $64,400 has capped every breakout attempt — a zone that lines up exactly with the wall visible on the heatmap. This kind of volatility compression typically precedes a sharp directional move. Fast exponential moving averages have completed a Golden Cross over the 200 SMA, offering dynamic support around $63,000 as long as price holds above it.
Intraday Execution — 15-Minute Chart (M15)
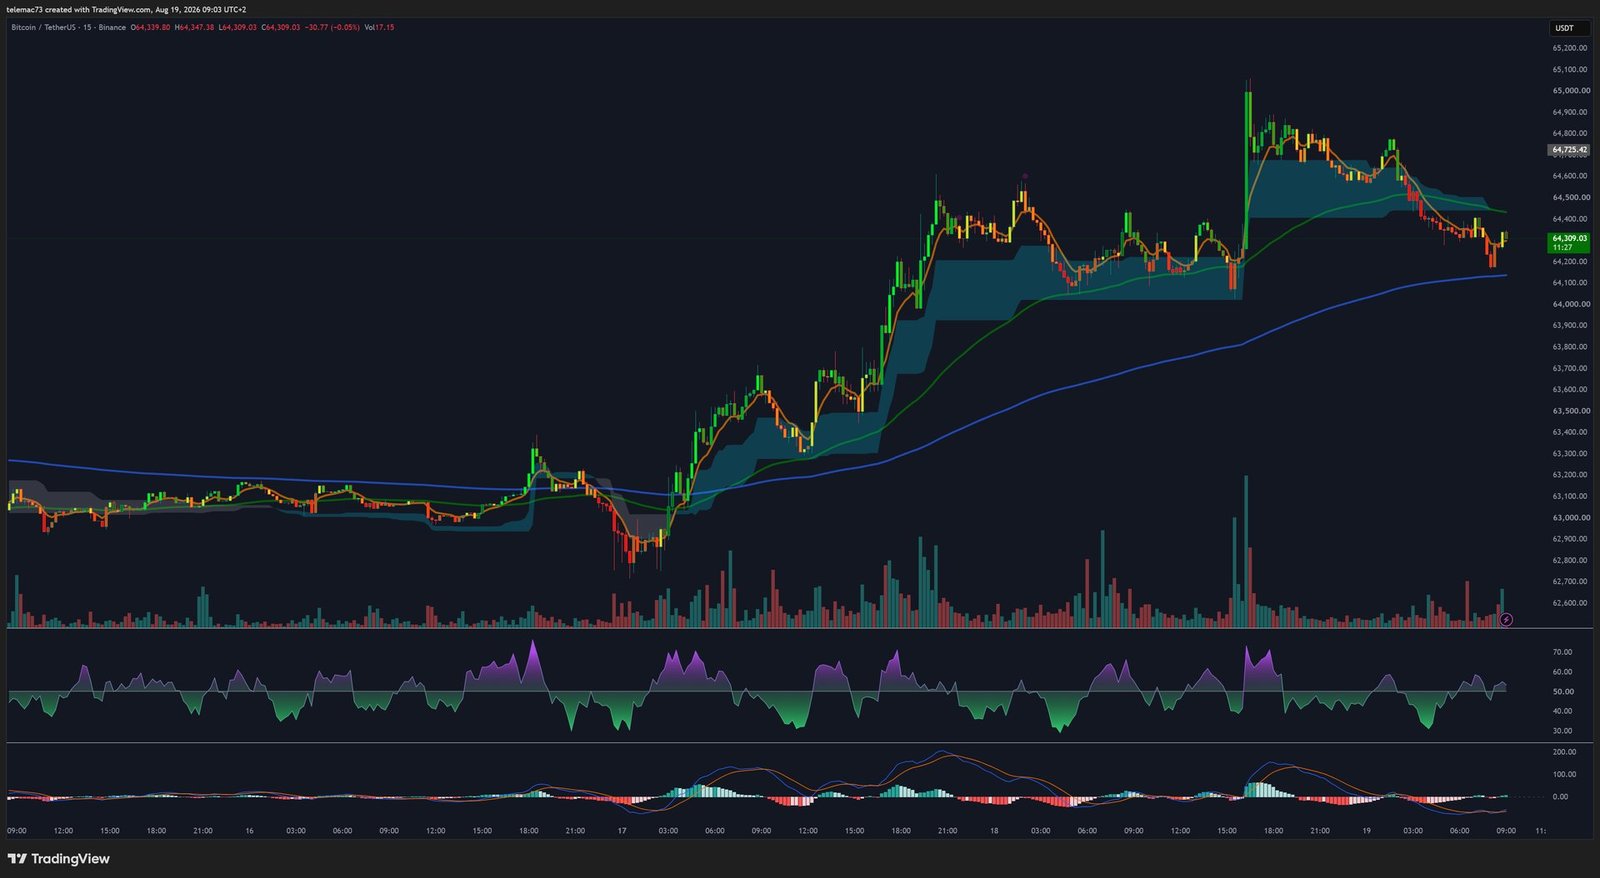
On the short-term scale, a sharp “V” rejection near $62,800 demonstrated the presence of institutional buyers absorbing the dip. After spiking into overbought territory above $64,700, the market corrected, with RSI settling back into a neutral 45-50 range. The absence of a clear bearish divergence on the last push higher is encouraging: the pullback looks structural rather than the start of a trend reversal.
| Timeframe | Indicator | Current Signal |
|---|---|---|
| Daily (D1) | RSI | Rebound from 34 to 51 — Neutral to bullish |
| Daily (D1) | MACD | Convergence below zero, Golden Cross forming |
| 4-Hour (H4) | Structure | Ascending triangle beneath major resistance |
| 4-Hour (H4) | Moving Averages | Golden Cross confirmed, support at $63,000 |
| 15-Minute (M15) | RSI & Volume | Overbought purge, back to equilibrium |
Key Levels and Directional Scenarios
- Major Resistance: $73,757 — the March 2024 all-time high; a break here would invalidate any long-term bearish structure.
- Key Resistance: $69,000 — historical distribution zone and the H4 triangle breakout target.
- Pivot Zone: $64,500 — the current battleground, where the triangle resistance and the heatmap wall converge.
- Intermediate Support: $62,000 — base of the H4 ascending trendline.
- Major Support: $59,635 — upper boundary of the summer lows.
- Liquidity Sink: $57,800 — the absorption level identified on the heatmap in the event of capitulation.
Scenario 1 — Bullish Breakout (High Probability)
Combined liquidity injections from China and the Fed’s accommodative stance eventually outweigh seasonal fears. Price breaks through the $65,400 wall, triggering a short squeeze that propels the market toward $69,000, with a test of the all-time high plausible in Q4.
Scenario 2 — False Breakout and Extended Consolidation (Moderate Probability)
A breakout attempt fails against aggressive institutional supply. The H4 MACD flips into a Death Cross, price re-enters the triangle, and the market continues oscillating between $60,000 and $65,000 while awaiting a clearer macro catalyst.
Scenario 3 — Capitulation Toward the Liquidity Sink (Low Probability)
A severe exogenous shock — geopolitical escalation, an inflation surprise, or a disorderly carry-trade unwind — breaks the $62,000 support. Cascading liquidations drive price directly toward the $57,800 sink, testing the survival of the macro bull thesis.
Bottom Line
The current market calls for strategic patience. Quiet accumulation is justified by substantial macro fundamentals — expanding global money supply, the Fed pivot, improving ETF infrastructure — but tactical execution demands waiting for clear confirmation of a breakout from the compression triangle before optimizing the risk/reward setup.
Disclaimer: This article is published for educational and informational purposes only. It does not constitute investment advice, a recommendation to buy or sell, or a solicitation to trade digital assets. Cryptocurrency markets are highly volatile; always do your own research and consult a qualified financial advisor before making any investment decision.

