


Bitcoin is going through one of its tensest phases of the year this July 2026, squeezed in a range between $62,500 and $67,000. Between an oil shock, a hawkish pivot at the Fed, and regulatory gridlock in Washington, the leading crypto asset is navigating largely blind. Our team went through the daily, 4-hour and 15-minute charts, along with the order book heatmap, to build a full picture of the current situation.
A macro backdrop under heavy pressure
Escalating tensions between the United States and Iran sent a shockwave through global markets. Even after a partial mid-month easing, oil remains firmly above $90 a barrel, with spikes beyond $100. This energy surge is reviving inflation fears and pushing US bond yields to their highest levels in 18 months, an environment that mechanically weighs on risk assets like Bitcoin.
On top of that, the Federal Reserve has shifted tone dramatically. Under Chair Kevin Warsh, the Fed has dropped its usual forward guidance and is holding rates in a restrictive 3.50%–3.75% range. Futures markets are now pricing in roughly a 38% chance of another hike before year-end — a “higher for longer” scenario that starves the crypto market of the liquidity it needs for a sustained recovery.
Regulatory limbo: the Clarity Act and the GENIUS Act
The “Clarity Act,” meant to bring a clear legal framework for crypto in the US, has stalled in the Senate, unable to secure the 60 votes needed to close debate. Prediction markets like Polymarket have slashed the odds of passage this year from 55% to just 35%. Meanwhile, the “GENIUS Act” threatens to fragment stablecoin liquidity through strict KYC rules, which could widen spreads and thin out order book depth.
Institutional flows and liquidation cascades
Bitcoin is also suffering from growing contagion out of the tech sector, particularly AI stocks. The recent correction in AI-related equities pushed several institutional funds to de-risk by liquidating their crypto positions, typically the most liquid holdings in their portfolios.
On the spot ETF side, flows paint the picture of nervous, unconvinced capital: seven consecutive positive sessions pulled in nearly $999 million between July 14 and 22, before a sharp reversal saw over $465 million in net outflows the week ahead of the FOMC meeting. The market’s inability to durably clear $65,500 also triggered a liquidation cascade: more than 165,000 traders were forcibly closed out within 24 hours, wiping out roughly $682 million in capital across the crypto market.
The heatmap: a quiet battle between buyers and sellers
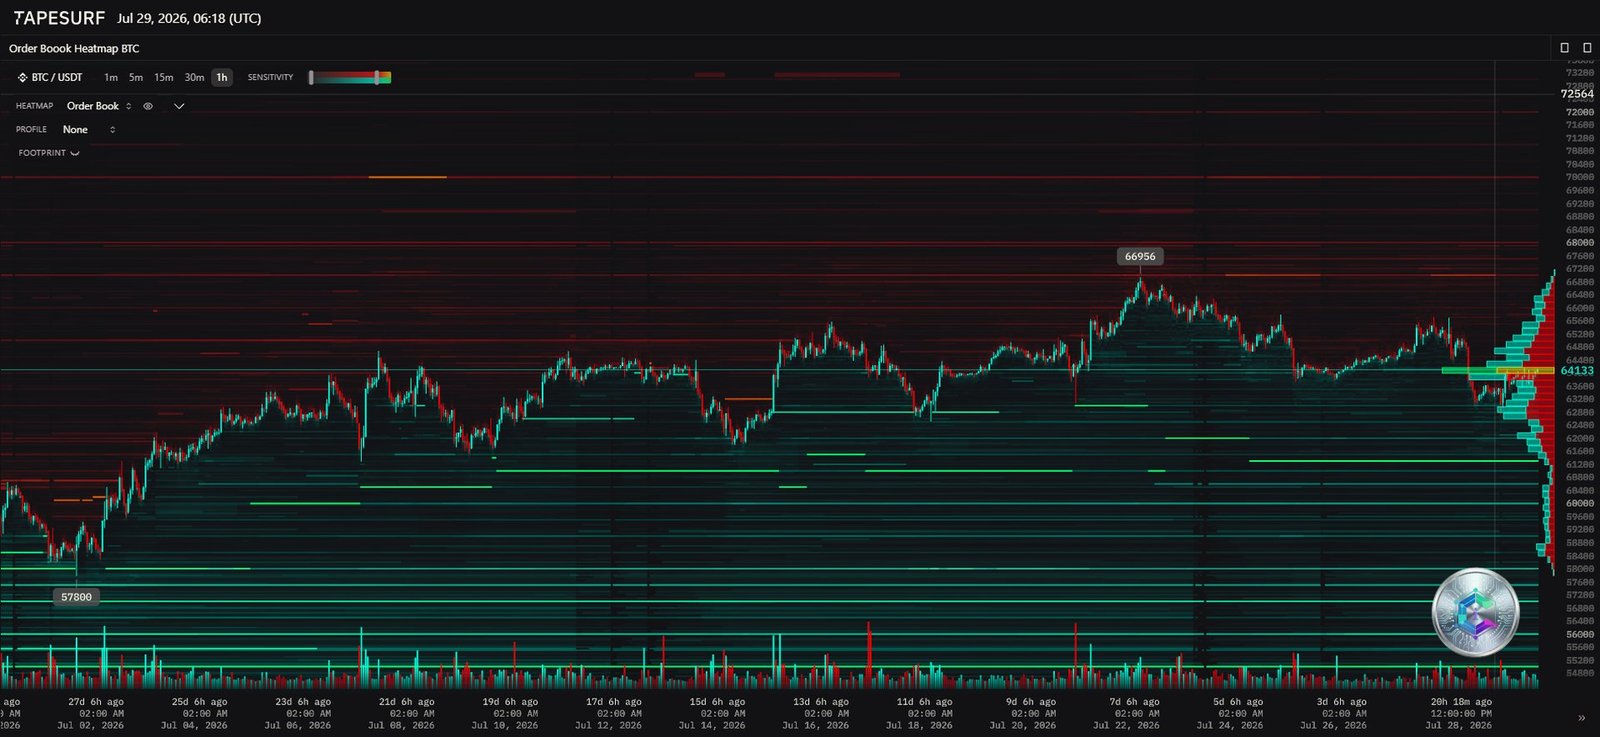
The order book heatmap reveals a well-defined market structure. On the demand side, a dense liquidity corridor sits between $62,000 and $62,800, with a second pocket of buy orders near $57,800. This algorithmic floor explains the stubborn resistance seen on recent dips.
On the flip side, a massive sell wall spans from $65,500 to roughly $68,000, peaking near $67,000. This wall accounts for the repeated rejections BTC has faced on rebound attempts, and only a forceful buying shock could erode it enough to trigger a short squeeze.
Daily chart: a compression triangle with an uncertain outcome
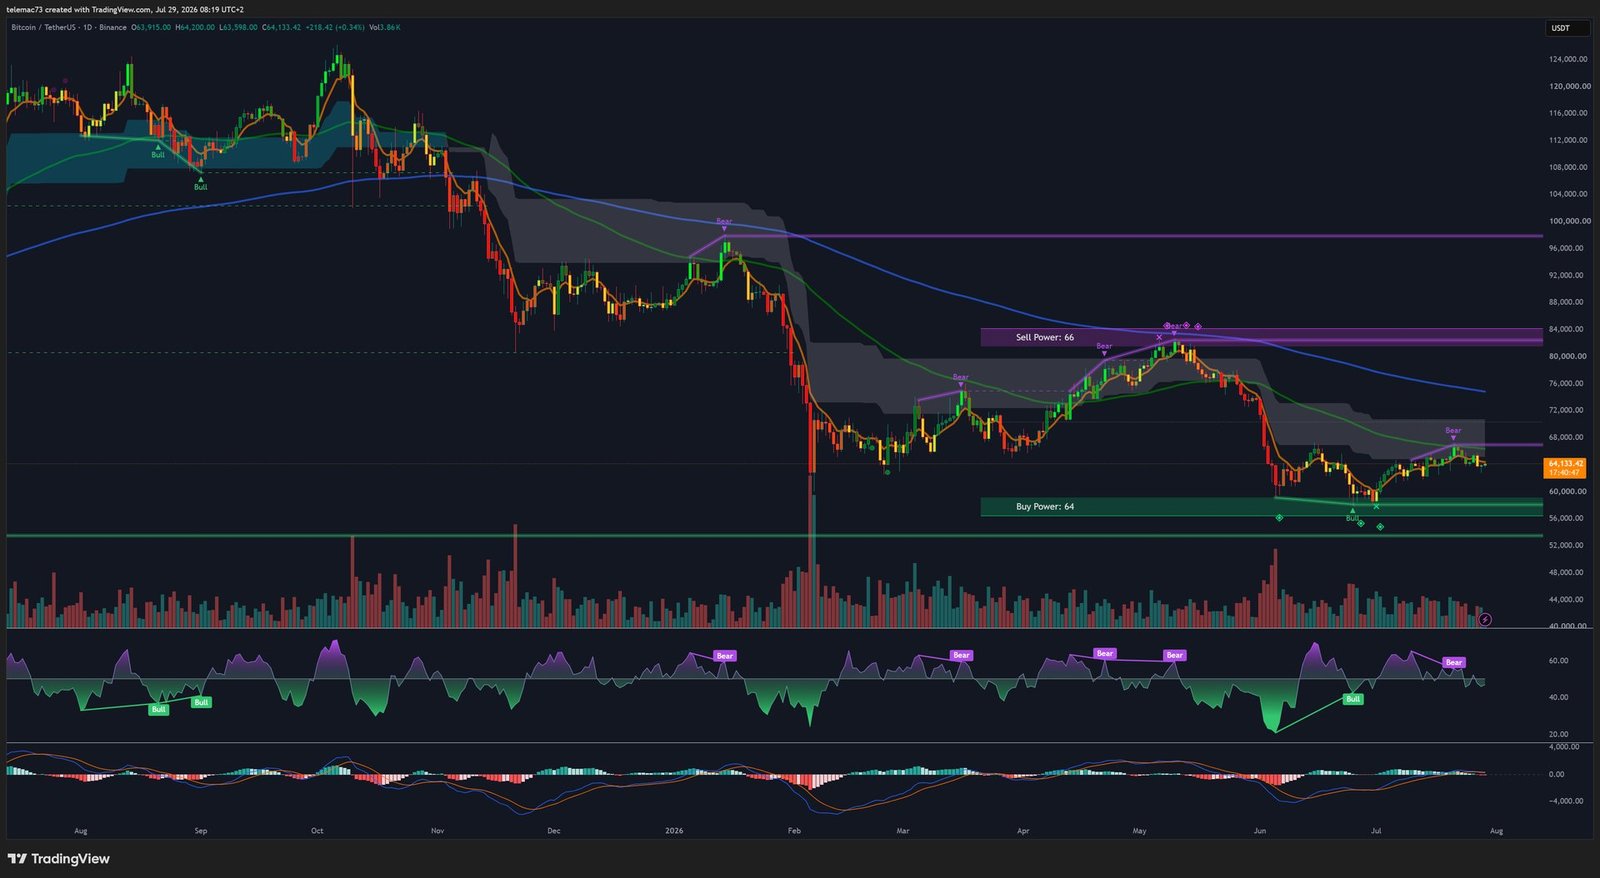
On the daily timeframe, price has spent several weeks inside a broad compression triangle: lower highs against a horizontal support around $63,000. This pattern reflects an exhausted market where buyers and sellers are gradually cancelling each other out ahead of a likely decisive break.
Moving averages confirm the cautious tone: the 21-MA (~$64,300) acts as dynamic resistance, the 50-MA (~$63,300) is a fragile pivot, and the 200-MA (around $65,000 and above) remains the ultimate target to validate a return to an uptrend. The daily RSI hovers around 40, in neutral-to-bearish territory, though a slight weekly bullish divergence is starting to appear — a possible sign of slowing selling pressure, without a definitive confirmation yet.
4-hour chart: the deleveraging arena
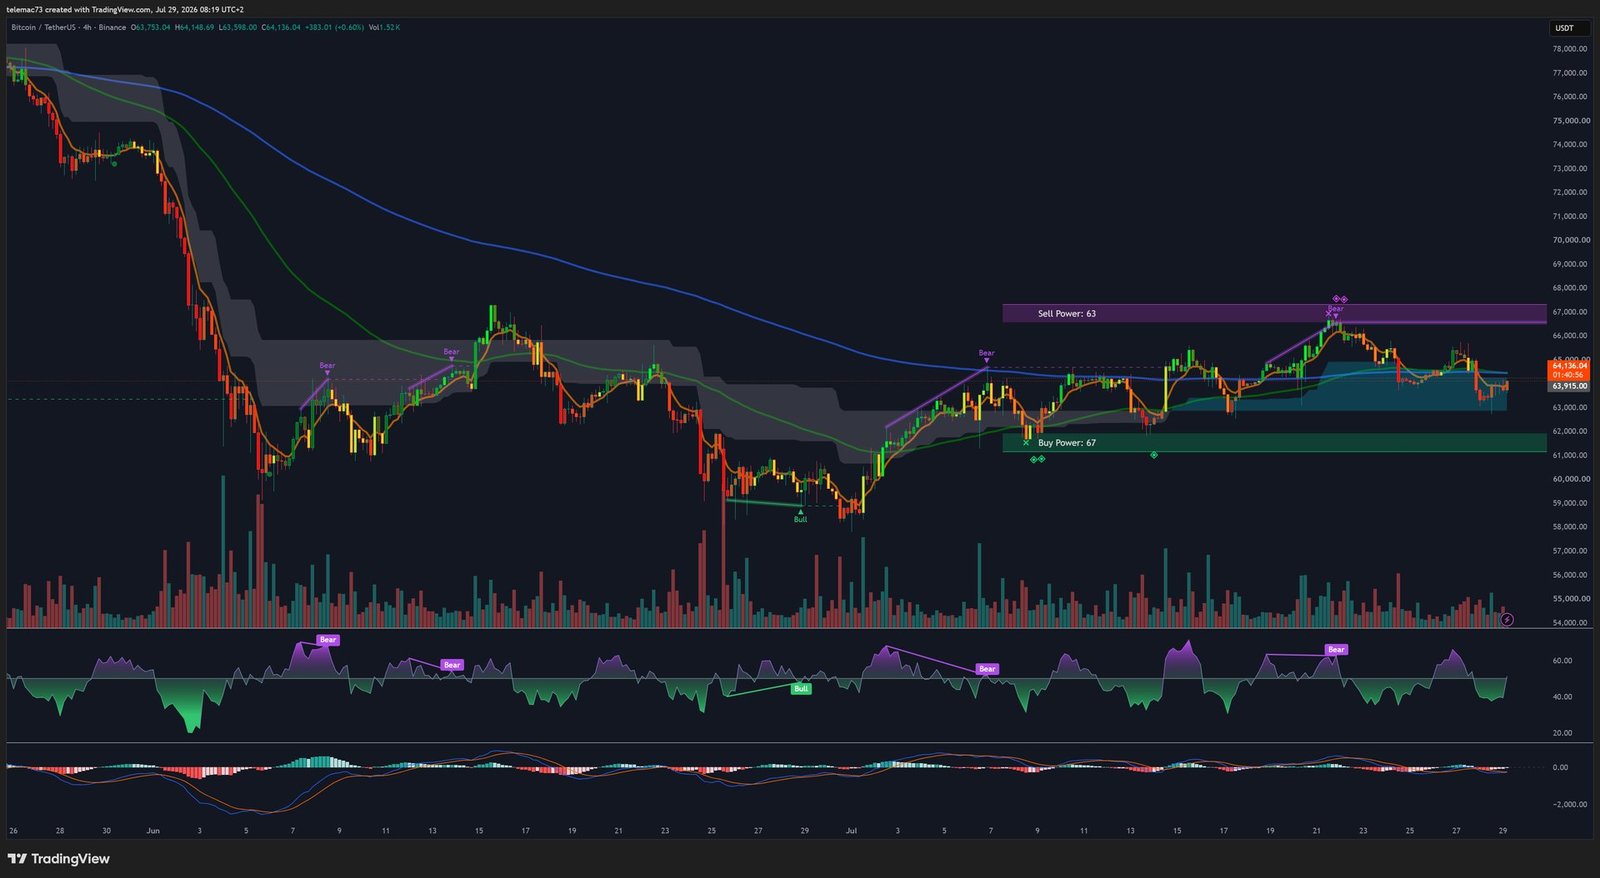
The 4-hour timeframe tells a noticeably darker story: the formation and subsequent breakdown of a bear flag drove price from $67,000 down to $63,000, a drop consistent with both the pattern’s theoretical target and the liquidation cascade mentioned above. The MACD printed a clear death cross, plunging well below its zero line, while the proprietary oscillator showed a balance of power clearly tilted against buyers (Sell Power 63 / Buy Power 47).
15-minute chart: capitulation and a V-shaped bounce
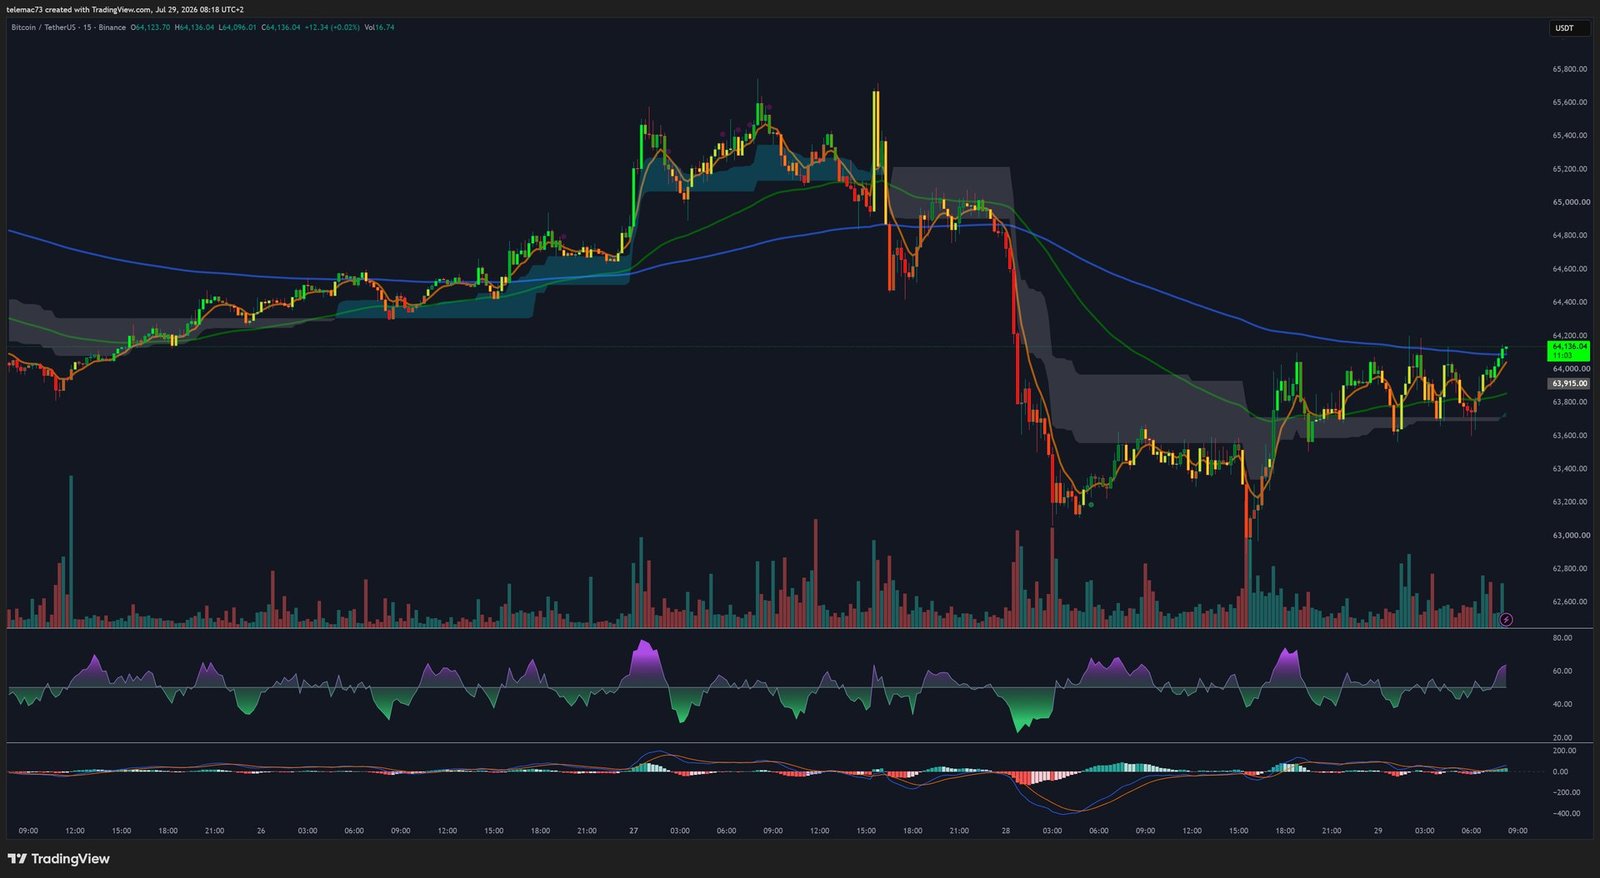
Intraday, the picture is more nuanced. A sequence of red candles drove price down to $62,500, likely a stop-loss hunt against retail long positions, before a massive buy-back triggered a V-shaped recovery typical of extreme oversold zones. The RSI, which had dropped below 20, quickly climbed back toward neutral territory, and the MACD carved out a golden cross in negative territory — a classic signal of a short-term flush ending, without necessarily calling the underlying trend into question.
Key levels to watch
| Level (USD) | Type | Comment |
|---|---|---|
| 67,000 – 68,000 | Major resistance | Sell wall identified on the heatmap |
| 65,500 – 66,000 | Intermediate resistance | Zone of recent liquidations |
| 64,000 – 64,300 | Dynamic resistance | 21-day moving average |
| 63,300 – 63,450 | Current price | Consolidation zone, 50-MA |
| 62,500 – 62,800 | Immediate support | Buy cluster on the heatmap |
| 58,000 | Structural support | Daily triangle target |
| 55,000 | Macro floor | “Value investor” buy zone |
Two scenarios going forward
Bullish scenario: a surprise pause from the Fed, combined with an easing of the Iran-US conflict, could validate the bull flag forming on the intraday chart. A break above the 21-MA at $64,300 could trigger a short squeeze, pushing price toward the $67,000 liquidity wall, with potential for further upside on a confirmed weekly close above it.
Bearish scenario (currently viewed as more likely): a persistent stagflationary backdrop, a still-restrictive Fed, and a stalled Clarity Act could turn the intraday bounce into a mere technical blip. The 4-hour death cross would then regain control, with another test of the $62,500 support. A break below that level would open the path toward the liquidity void seen on the heatmap, targeting the $55,000–$58,000 zone.
Our take
Bitcoin currently sits in a technical and fundamental no-man’s-land, where acting between $62,500 and $67,000 is closer to a bet than a structured conviction trade. A cautious approach would be to wait for either a flush validating support around $55,000–$58,000, or a confirmed, high-volume breakout above $67,000–$68,000, before committing significant fresh capital.
Disclaimer: this article is provided for informational and educational purposes only. It does not constitute investment advice or a recommendation to buy or sell. Cryptocurrencies are highly volatile assets; only invest what you can afford to lose, and always do your own research (DYOR) before making any decision.

