


XRP defends the dollar threshold on the daily timeframe, but the bounce rests on a bullish MACD cross only just validated on the current candle. The H4/M15 intraday structure shows momentum turning, yet volume stays anemic across all three timeframes (49% to 19% of respective averages), capping the upside.
🔑 Key Takeaways
- Bearish daily: XRP below SMA20 ($1.0299), SMA50 ($1.0732) and SMA200 ($1.2772); -6.68% over 20 candles
- Daily MACD bullish cross validated on Aug 19, 2026 (current candle), first sign of seller exhaustion
- H4 RSI at 57.60, climbing from 43.77: momentum reversal confirmed on the intermediate timeframe
- Anemic volume: 49% of daily average, 52% on H4, only 19% on M15 — confirmation missing
- Bearish macro backdrop: Fed at 3.75% with 3 hawkish dissents, 30Y US Treasury at 5.32%, XRP ETF outflows accelerating
Macro Backdrop and Institutional Flows
The macroeconomic environment and institutional flows weigh heavily on XRP’s technical configuration. The U.S. Federal Reserve held its policy rate in the 3.50%–3.75% range at its July 29, 2026 meeting (CNBC), with three dissents favoring a hike. This restrictive stance is amplified by the 30-year Treasury yield at 5.323% on August 18, 2026 (Investing.com) — a high not seen since 2007. The combination forms an unfavorable backdrop for risk assets, including cryptocurrencies.
On the regulated products side, Investing.com headlines on August 18, 2026: “XRP ETF Inflow Collapse Weakens the Institutional Demand Thesis”, documenting a sharp drop in inflows to listed XRP vehicles. The token is down 72.7% from its all-time high of $3.657 and by more than 65% since January 2026 — institutional selling pressure remains intact.
On the regulatory front, the SEC Crypto Task Force continues collecting public comments on tokenization (sec.gov, July 31, 2026), with no XRP-specific signal — neutral.
Derivatives paint a more nuanced picture. BigGo Finance reports on August 11, 2026 that XRP open interest surged +20.46% in one hour, equivalent to +$171M, ahead of the CPI release. The weighted funding rate remains slightly positive at +0.0080%, signaling a modest net-long positioning. On August 5, crypto.news noted XRP OI at a six-month low (~$2.25B), confirming that the current bounce builds on a light positioning base.
On-chain data tells a stronger story: whales accumulated more than 380 million XRP, roughly 13% of circulating supply, during the downphase (BigGo Finance, August 11, 2026). This absorption provides a structural floor for price even as spot selling pressure persists.
| Factor | Data point (date, source) | Bias effect |
| Fed funds rate | 3.50–3.75%, 3 dissents (CNBC, 07/29/2026) | Bearish |
| 30Y Treasury | 5.323% (Investing.com, 08/18/2026) | Bearish |
| XRP ETF flows | Inflow collapse (Investing.com, 08/18/2026) | Bearish |
| XRP derivatives OI | +$171M in 1h on 08/11/2026 (BigGo Finance) | Bullish (short term) |
| XRP funding | +0.0080% (BigGo Finance, 08/11/2026) | Neutral |
| Whale accumulation | 380M+ XRP, ~13% of supply (BigGo Finance, 08/11/2026) | Bullish structural |
“The daily MACD crossing back into positive territory marks the first warning of bearish exhaustion since the $0.9844 low. As long as daily volume does not reclaim its 280M average, the bounce remains an unconvincing mean-reversion.”
cryptoinfo.ch analyst, August 2026
Daily Structure and Key Levels
On the daily timeframe, XRPUSDT prints a structurally bearish picture. Price sits at $1.0101, below the SMA20 ($1.0299), SMA50 ($1.0732) and SMA200 ($1.2772). The 20-candle change stands at -6.68%, and the token trades only +2.61% above its period low ($0.9844). Daily RSI14 at 40.78 remains neutral but in its lower band, with a recent 34–38 range signaling fragile momentum.
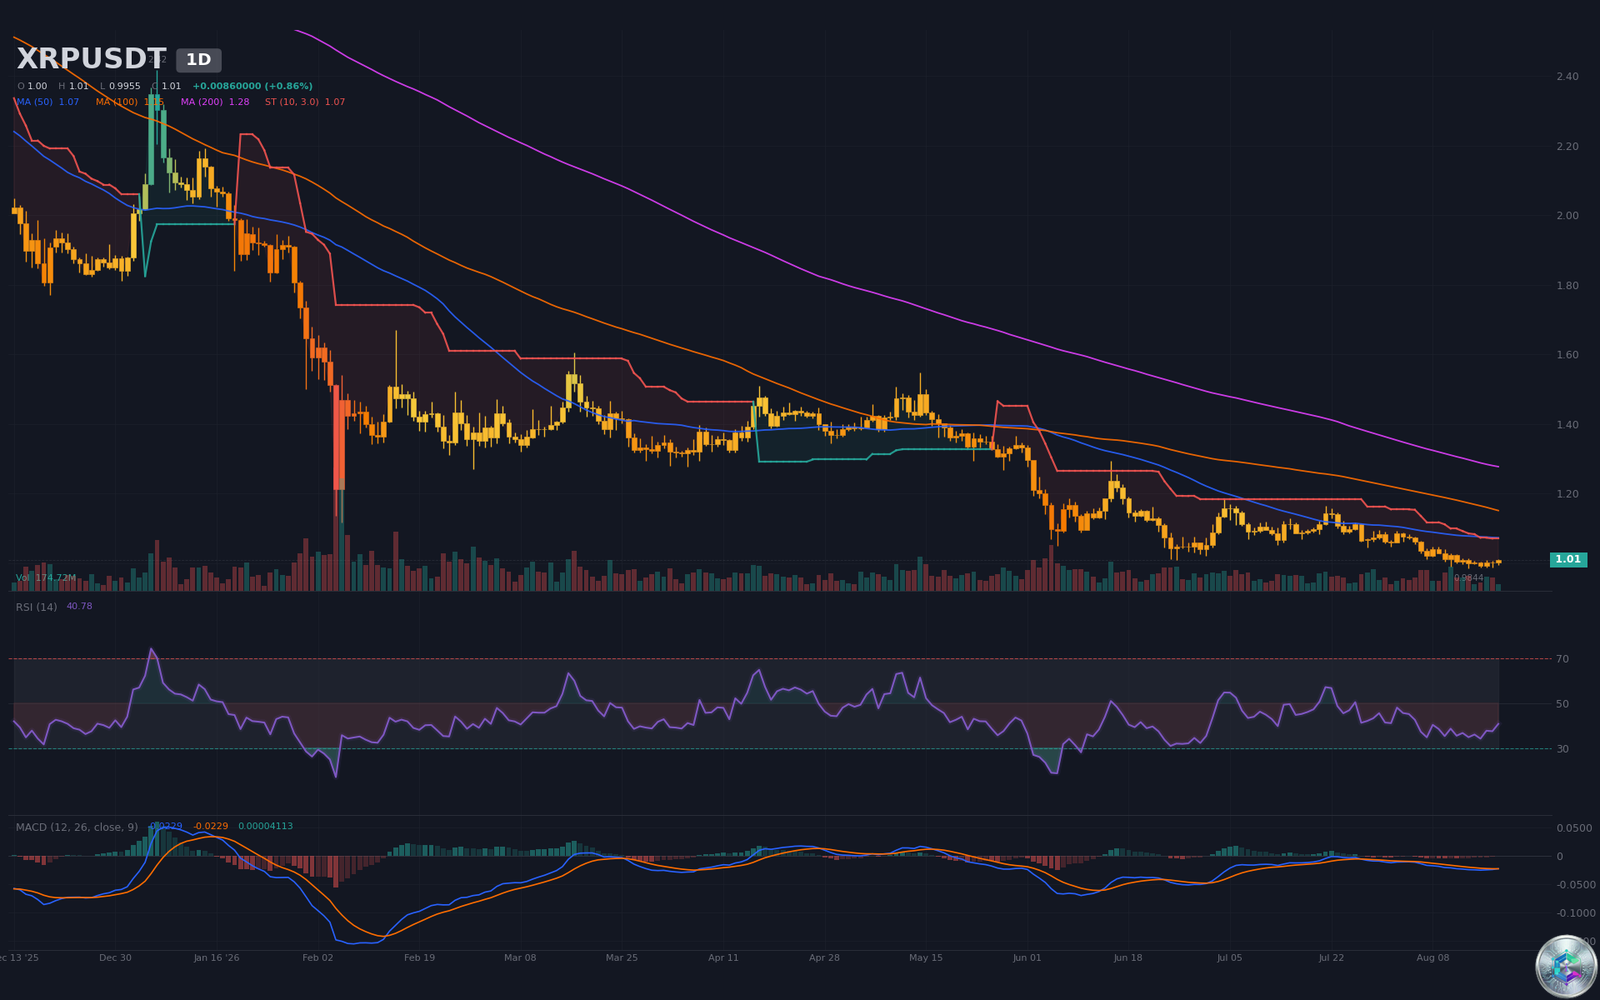
Swing analysis does not show a classic bullish divergence: successive highs ($1.1641 on July 21, $1.0949 on July 30, $1.0929 on August 2) carve lower highs, and successive lows ($1.0843 → $1.0445 → $1.0120 → $0.9886 → $0.9844) accompany RSI declines (45.5 → 42.1 → 34.8 → 38.6 → 34.8). Yet the RSI on the August 14 low at 34.84 fails to print a clean new floor — early signs of seller exhaustion. Daily MACD delivers the first positive signal: the MACD line (-0.02286) crosses above the signal line (-0.02290), with a histogram of +0.00004113 — a bullish cross validated on the current August 19, 2026 candle. Daily volume (174M vs 356M average, ratio 49%) remains insufficient to validate a durable reversal.
| Level | Price | Distance vs current price | Status |
| SMA 200 (LT) | $1.2772 | +26.40% | Major long-term resistance |
| SMA 50 (MT) | $1.0732 | +6.25% | Medium-term resistance |
| SMA 20 (CT) | $1.0299 | +1.96% | Trend pivot |
| Daily R2 | $1.0169 | +0.67% | Intraday resistance |
| Daily R1 | $1.0092 | -0.09% | Immediate resistance |
| Price | $1.0101 | — | Neutral zone |
| Pivot P | $0.9986 | -1.14% | Daily equilibrium |
| Daily S1 | $0.9909 | -1.90% | First support |
| Daily S2 | $0.9803 | -2.95% | Key support |
| Period low | $0.9844 | -2.55% | Critical swing low |
Daily ATR14 sits at $0.0259 (2.56% of price). The setup poses a three-way test: a close above $1.0299 unlocks $1.0732, while a loss of $0.9844 would reignite the bearish cycle toward $0.95 then $0.90.
H4: Momentum Reversal Confirmed
The H4 timeframe reveals a more advanced reversal than daily. Price at $1.0100 trades above the SMA20 ($1.0009) and SMA50 ($1.0048), while remaining below the SMA200 ($1.0599) — the structural pivot.
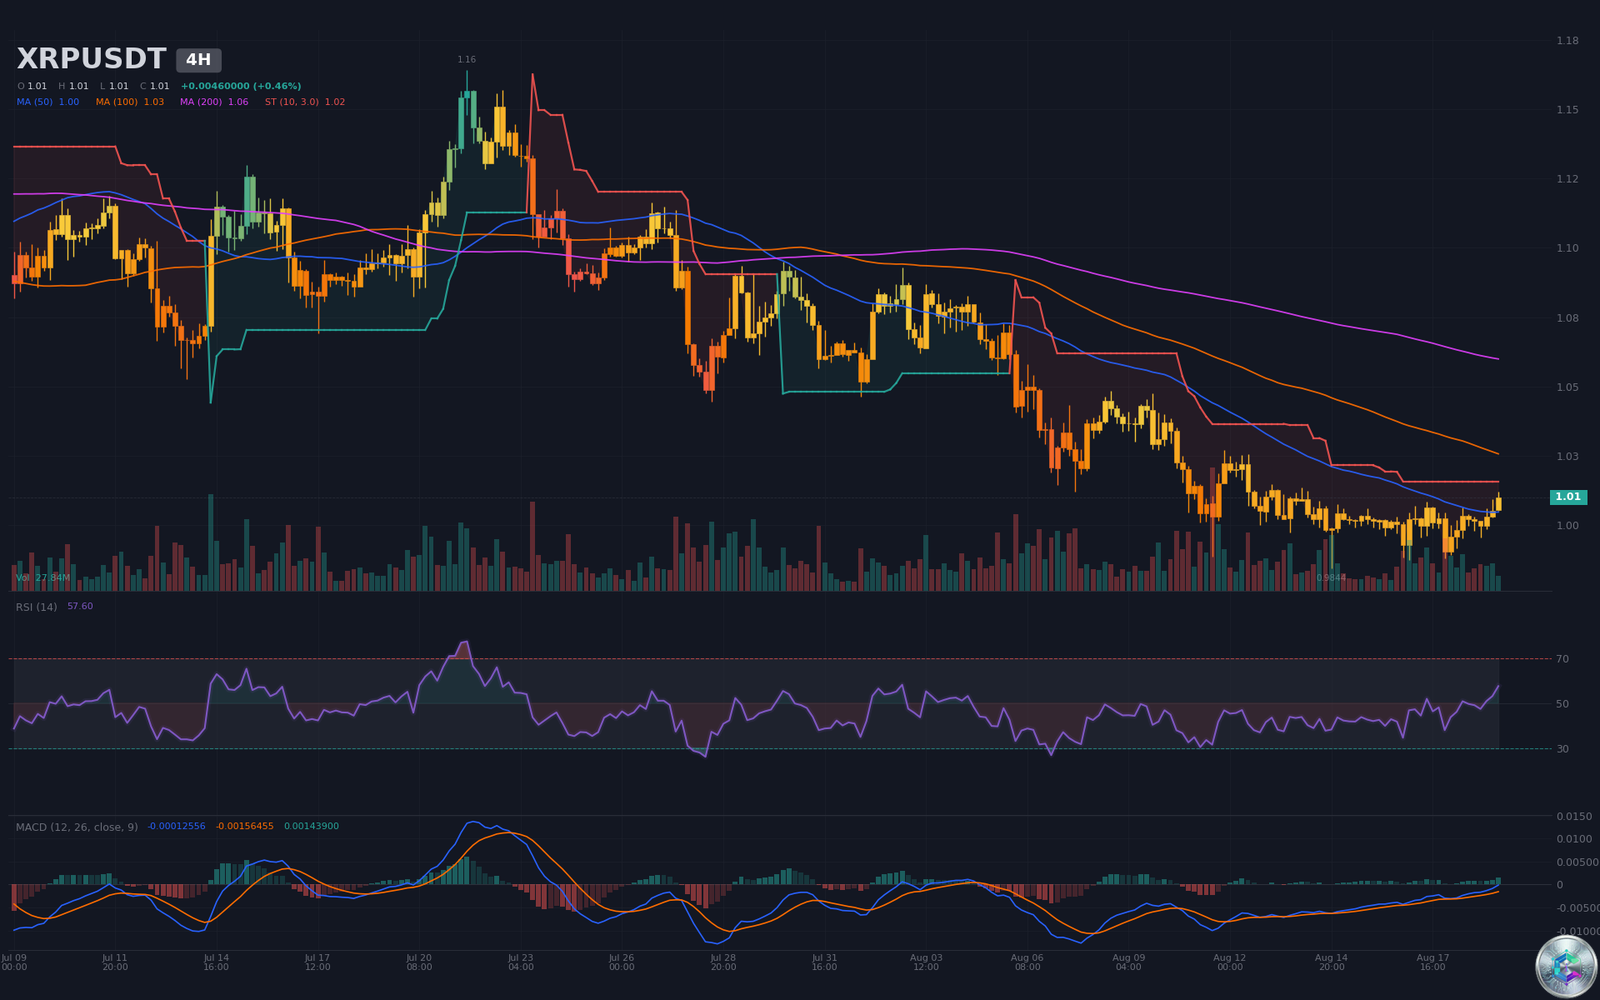
H4 RSI14 at 57.60 posts a steady climb: 43.77 → 46.14 → 50.87 → 49.67 → 49.10 → 47.42 → 50.92 → 53.16 → 57.60. The sequence describes a clear momentum improvement since the August 14 floor. MACD confirms: the MACD line (-0.000126) above the signal line (-0.001565), with a positive histogram of +0.001439 — a bullish cross validated for 27 candles since August 15, 2026.
H4 swing analysis delivers a meaningful pattern. Successive lows ($0.9844 on August 14, RSI 38.24; $0.9875 on August 17, RSI 46.81; $0.9955 on August 19, RSI 47.42) print a higher-lows structure with rising RSI. This is not a classic bullish divergence — which would require a lower price low alongside a higher RSI low on the same swing — but a reversal pattern confirmed by price/momentum alignment. On the high side, the series $1.0149 (RSI 43.6), $1.0137 (RSI 43.8), then $1.0085 (RSI 51.9) shows momentum elasticity: prices make lower highs but RSI advances, signaling seller exhaustion.
H4 pivot resistances cluster tightly: P at $1.0058, R1 at $1.0089, R2 at $1.0125. H4 volume (27.8M vs 53.7M average, ratio 52%) remains inadequate to validate a structural breakout. H4 ATR14 at $0.00807 (0.80% of price) defines a tight technical stop under S1 ($1.0022), approximately $0.9941 from a $1.0022 entry.
M15: Constructive Short-Term Dynamics
The M15 timeframe offers the most constructive read. Price at $1.0100 trades above all three SMAs: SMA20 ($1.0057), SMA50 ($1.0025) and SMA200 ($1.0001). The full architecture leans bullish, with a clear higher highs/higher lows structure since the August 19 low at $0.9985.
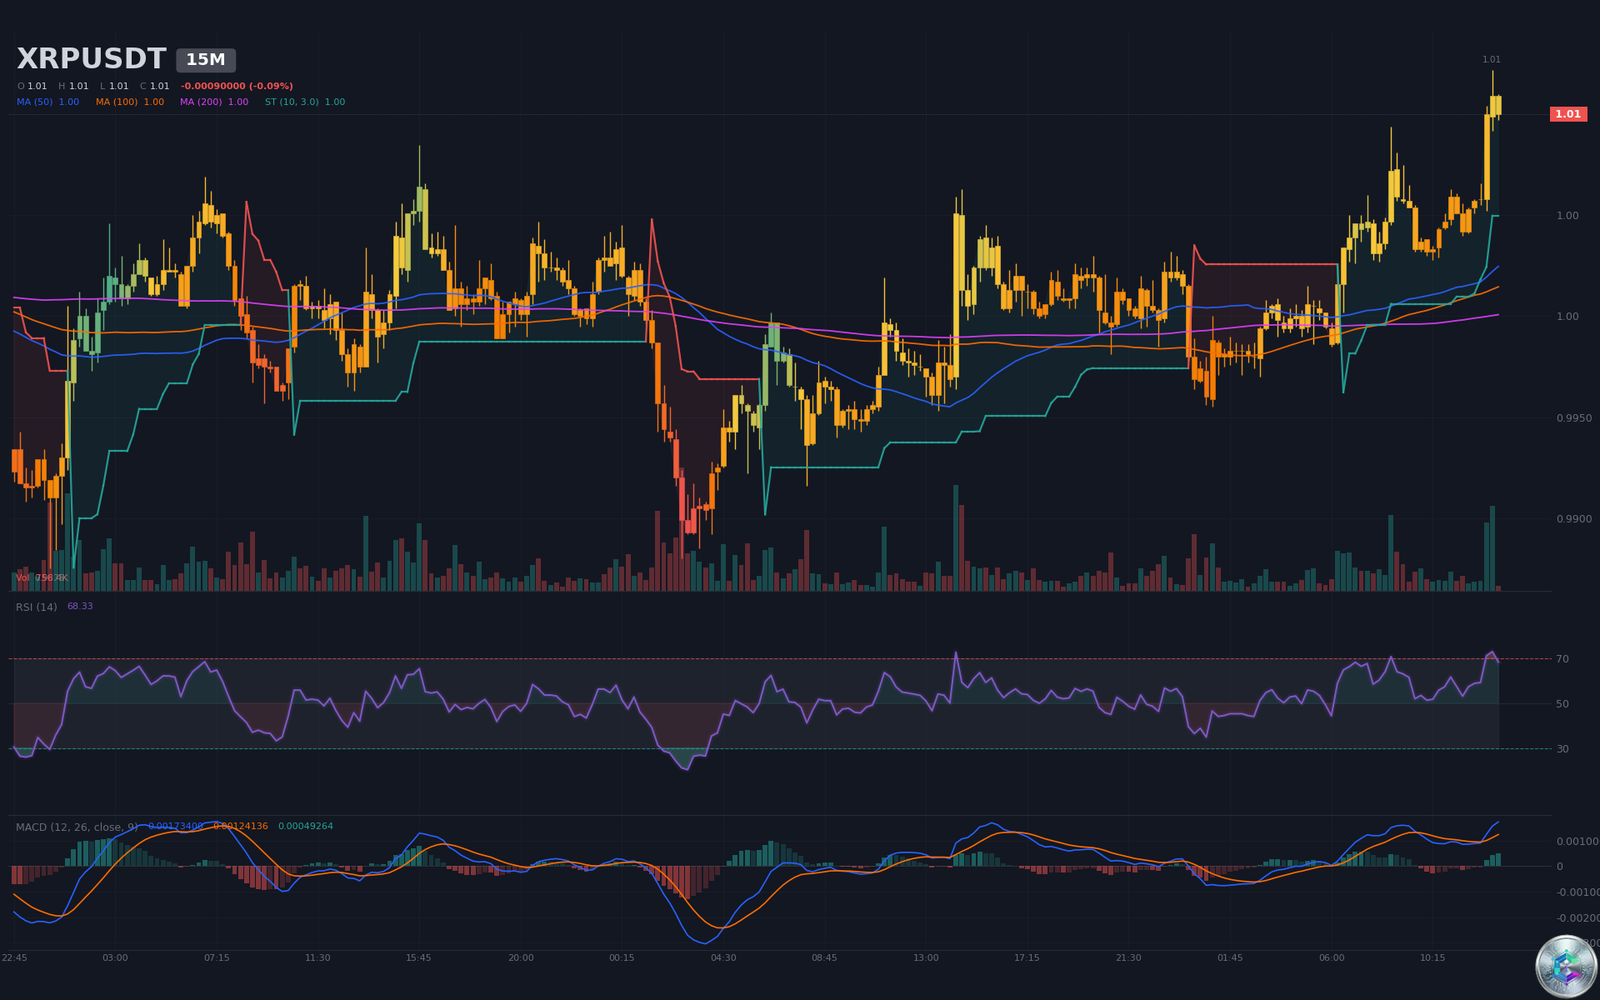
M15 RSI14 at 68.33 enters the caution zone without breaching the overbought threshold at 70. The sequence 53.12 → 57.38 → 58.84 → 59.22 → 71.17 → 72.99 → 61.66 → 68.33 charts a rising move with consolidation: RSI pulls back briefly before resuming, typical of an emerging bullish continuation. M15 MACD validates the structure: bullish cross on August 19, 2026 at 12:30 (2 candles), line 0.001734 above signal 0.001241, with a positive histogram of +0.000493.
M15 pivots concentrate nearby resistance: R1 at $1.0123, R2 at $1.0138 — the recent period high at $1.0122 brushes R1 exactly. A clean break of R2 on confirmed volume would unlock acceleration toward daily levels (SMA20 at $1.0299).
Structural caveat: M15 volume (756K vs 3.9M average, ratio 19%) remains dramatically weak — the lowest of the three timeframes. Until that deficit clears, the risk of a fast reversal on a false breakout persists. M15 ATR14 at $0.00181 (0.18% of price) defines extremely tight entry and stop levels in a strictly intraday perspective.
Strategy and Confluence
The multi-timeframe analysis yields a confluence score of 3/5 favoring a near-term technical bounce. Bullish elements: (1) daily MACD bullish cross validated, (2) H4 reversal confirmed by higher lows and rising RSI, (3) M15 price/momentum alignment across all three SMAs. Bearish or neutral elements: (4) weak volume across all three timeframes, (5) daily structure still below its three SMAs with confirmed lower highs.
Primary scenario — Technical rebound (55% probability)
- Trigger: pullback into the $1.0050–$1.0100 zone, supported by H4 pivot P ($1.0058) and H4 SMA50 ($1.0048); entry on confirmed break of H4 R2 at $1.0125 with M15 volume above 3.9M.
- TP1: $1.0299 (daily SMA20), +1.96% potential, R:R ratio ≈ 2.5 with stop at $0.9980.
- TP2: $1.0600 (former daily support turned resistance), +5.0% potential, R:R ratio ≈ 6.2.
- Stop: below $0.9980, i.e. at least 1×H4 ATR ($0.0081) under the entry point — invalidation on confirmed breach of the psychological $1.00 threshold.
Bearish scenario (30% probability)
Confirmed daily close below $0.9844 with H4 close below $0.9800 and daily volume above 500M. Target: 1×daily ATR ($0.0259) extension below the swing low, toward $0.95, then $0.90. This scenario corresponds to a complete invalidation of the H4 reversal structure.
Range scenario (15% probability)
Oscillation between $0.9844 and $1.0299 as long as the $1.00 pivot contains the move without clear direction — likely if ETF flows stay negative and the Fed fails to signal a dovish (accommodative) pivot at Jackson Hole.
In synthesis, XRP remains locked in a medium-term corrective phase. The current bounce is purely technical — anchored in MACD crosses and H4/M15 momentum recovery — and stays fragile against a restrictive macro backdrop and ongoing ETF outflows. The psychological dollar threshold remains the epicenter of the debate: as long as it holds (with M15 volume below 2M as a stress alarm), the rebound stays on the table; its break would reignite the daily downtrend. The ball is now in the buyers’ court: a reinvestment of the $1.20–$1.45 zone would be required to flip the primary trend.
Sources
- Fed meeting recap: Warsh says Fed won’t hesitate to stop inflation — CNBC, July 29, 2026
- United States Federal Reserve Interest Rate Decision — Investing.com, 2026
- XRP ETF Inflow Collapse Weakens the Institutional Demand Thesis — Investing.com, August 18, 2026
- XRP Futures Open Interest Surges $171 Million in One Hour Ahead of CPI Release — BigGo Finance, August 11, 2026
- XRP price tests $1.06 as open interest hits six month low — crypto.news, August 5, 2026
This article is published for informational and educational purposes only. It does not constitute investment advice. Do your own research (DYOR) before any decision.

