


- After a capitulation, the price has rebounded 11% beneath dense resistance, inside a still-strong downtrend.
- Driver: seven straight weeks of ether ETF outflows and a Fed hike priced above 98% weigh on demand.
- Watch: the November 25 PCE print at 14:30 Zurich time and the November 27 options expiry, which can break the range.
Ethereum trades near $1,705 on November 22, 2026, after a low of $1,536.1 on November 21, a rebound of roughly 11% in a few sessions. The price still sits 45% below its period high of $2,806.8 set on September 21, and the 30-day performance stands at -28.6%. It is only 13% above the 2026 low excluding the rebound, $1,503.6 on June 6. On a weekly basis the picture looks more like a reversal than a correction: six consecutive bearish weeks and a price below the 20-week simple moving average (SMA20) at $2,222.
The dominant event remains the cascading liquidation of November 20. That day Bitcoin lost $60,000 while the Nasdaq fell about 5% (Bitcoin Magazine). Liquidations reached $1.53B over 24 hours, $1.4B of them longs, and the Fear & Greed index dropped to 9 (Decrypt). CNBC notes ether had already fallen 25.3%, then 28%, in the 30 days before the Anthropic and SpaceX IPOs, a pattern pointing to rotation toward AI-linked assets. The November 22 rebound tracks Bitcoin’s move from $55,100 back above $60,000, and more than $400M of short positions were liquidated over 28 hours (Crypto Briefing).
Flows offer no counterweight. According to BigGo (November 18), Citi cut its ETH target to $2,838 from $3,028 and counts seven consecutive weeks of ether ETF outflows, including $27.6M from ETHA on November 17 (Farside). On the macro side, markets price a probability above 98% of a 25-basis-point Fed hike in December, while CNBC puts the chance of a Bank of Japan hike at 72%. In the US, underlying retail sales rose 0.6% against 0.4% expected, while Japan’s core inflation came in at 2.2% against 2.3% expected. On-chain, wallets linked to the Binance hack moved about $594M of ETH in two days (Cointelegraph): a potential supply risk, with no sale demonstrated.
The backdrop therefore points to a bearish bias at the trend level. The technical reading must still reconcile that bias with an acute oversold condition, which explains the rebound without proving a reversal.
Multi-Timeframe Technical Analysis
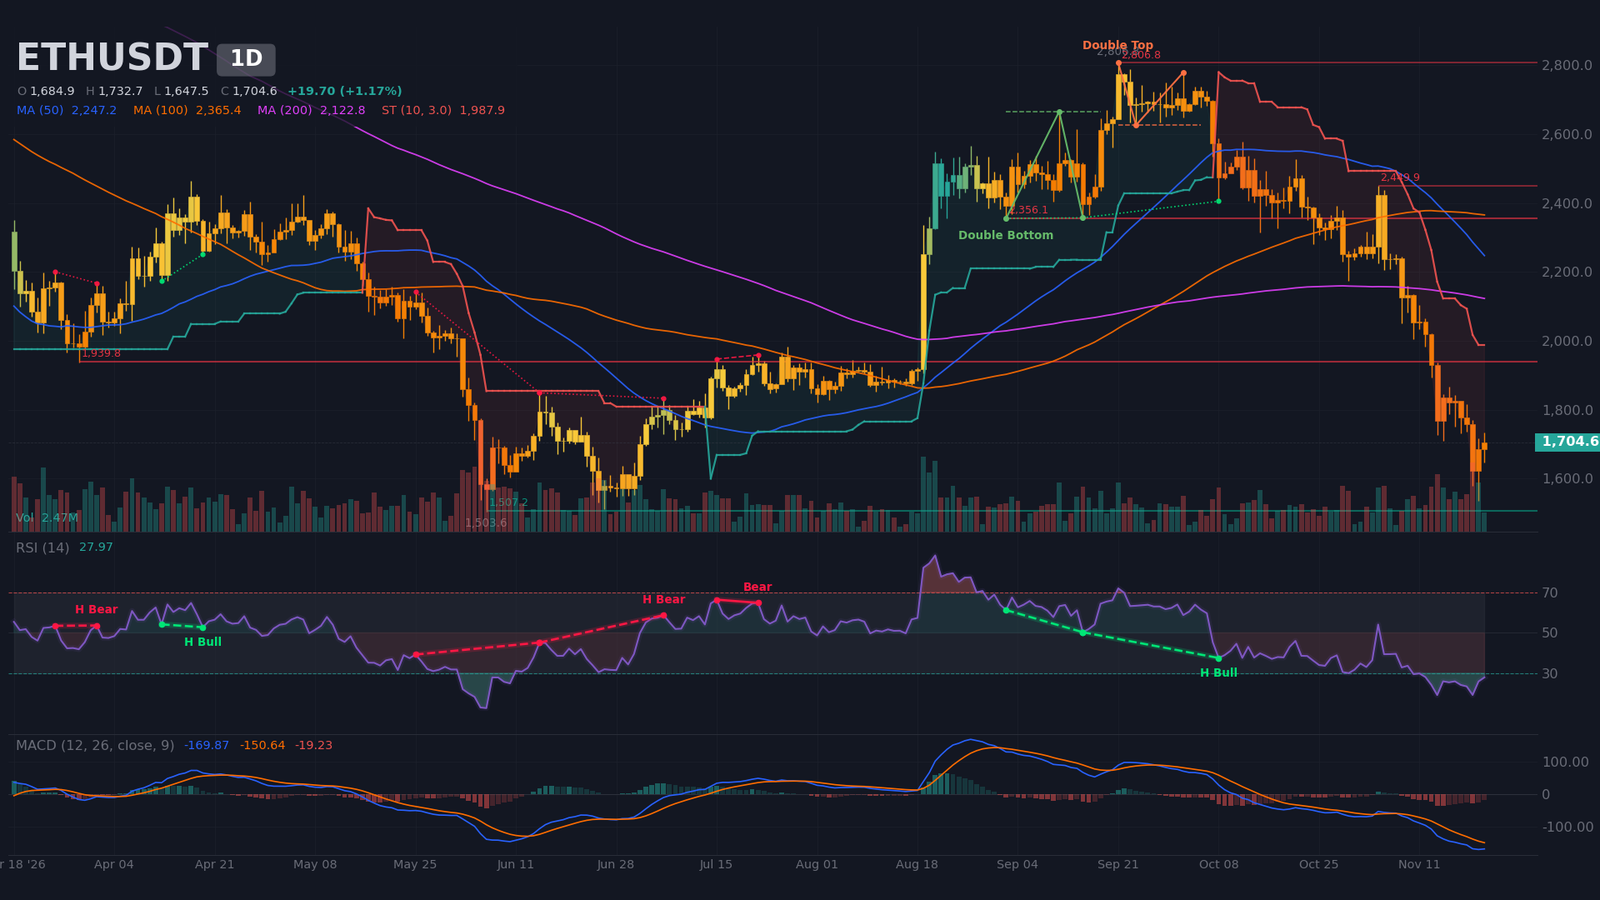
Daily Timeframe (1D): confirmed double top and mature bearish impulse
The current week is down 7.1% after a 13.7% drop. The price sits below the 10-week SMA ($2,327) and the 20-week SMA, with a weekly RSI at 35: this is a trend reversal, not a correction. The regime remains directional, with ADX at 46, DI- at 35 against 7 for DI+, and expanding Bollinger Bands. The price is below the 20-, 50- and 200-day moving averages ($1,976, $2,247 and $2,123), and the SuperTrend stays bearish at $1,988.
The bearish double top is confirmed with a neckline at $2,626, but its $2,459 objective has already been exceeded, so it no longer serves as an argument. The bullish double bottom flagged around the September 15 pivot has also lapsed, and the daily close has slipped below the last low at $1,710 (November 15). Fibonacci is the most telling tool: the retracement of the major bullish impulse ($1,503.6 to $2,806.8) has reached 84.6%, the 78.6% level at $1,782 has been lost and now acts as resistance, while the impulse origin near $1,504 coincides with a detected support at $1,507 with two contacts. On the recent bearish swing ($2,779 to $1,536.1), the 23.6% and 38.2% retracements sit at $1,829 and $2,011. The daily RSI at 28 is turning up without recent divergence, and MACD remains below zero with a negative histogram since the November 8 bearish crossover.
Volume tells the capitulation story: 228% of average volume on November 20, then a long lower wick on November 21 (low at $1,536, close at $1,685) on 147% of average volume. The price is crossing the value zone ($1,802 to $2,535), with volume nodes at $1,761 and $1,897.
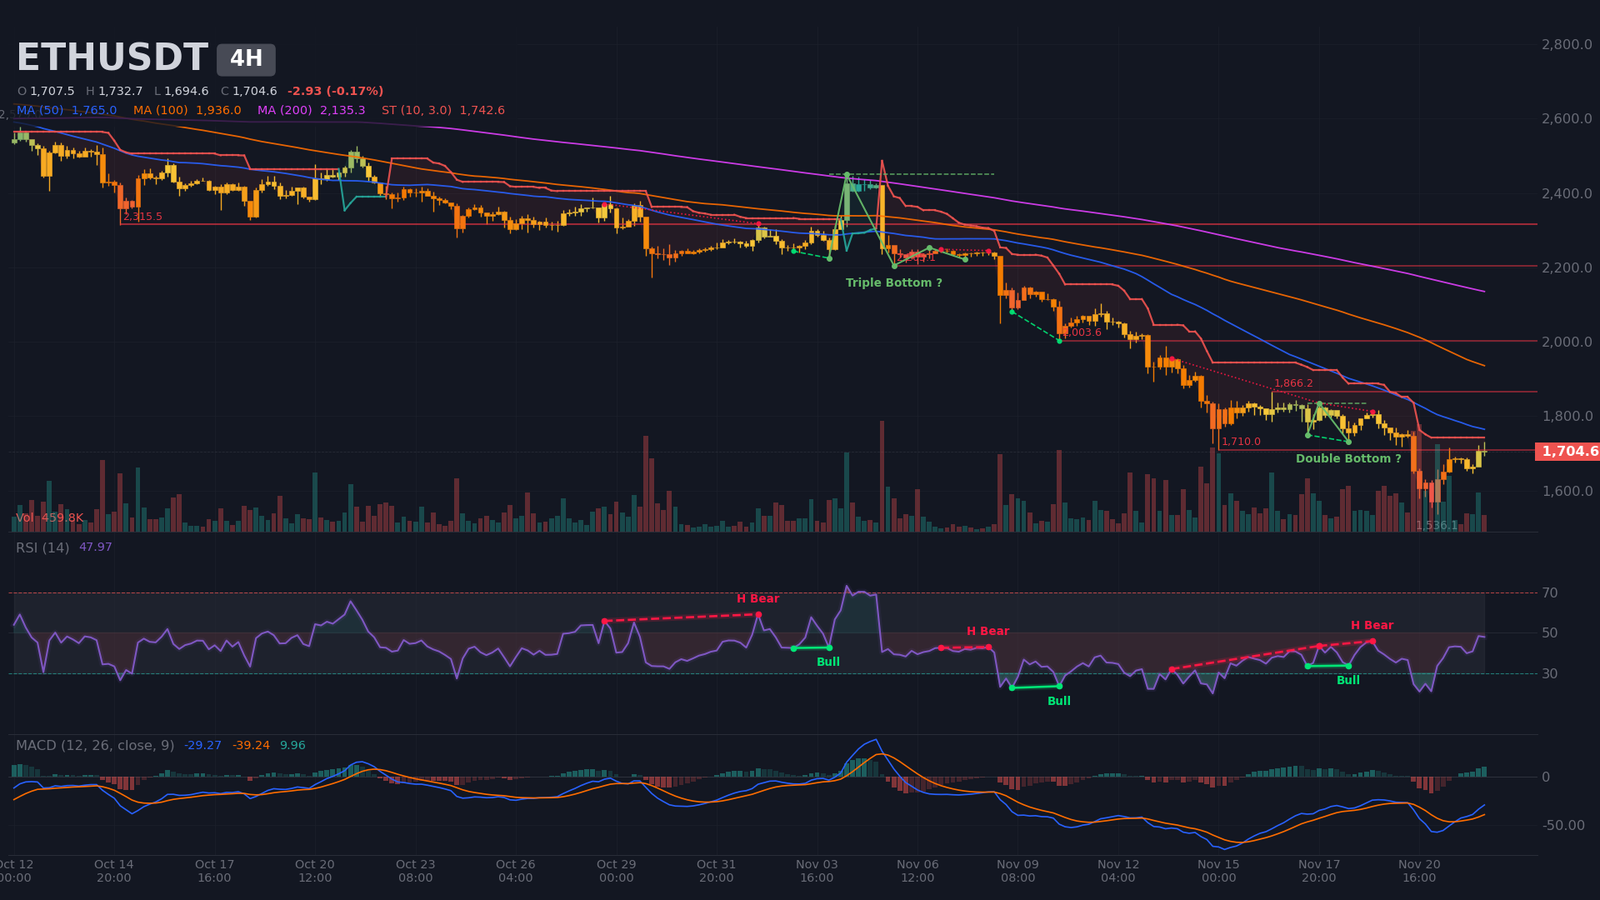
Intermediate Dynamics (4H): corrective rebound beneath resistance
Peaks and troughs are shrinking, with the last high at $1,716 and the last low at $1,536. ADX at 41, with DI- at 25 above DI+ at 20, confirms a downtrend that is less crushing than on the daily. The price is above the 4-hour SMA20 ($1,694) but below the SMA50 ($1,765), the SMA200 ($2,135) and the bearish SuperTrend ($1,743). RSI is neutral at 48, and MACD crossed bullish on November 21 while still below zero: this is a rebound, not a turnaround.
Resistance stacks up at $1,782 (23.6% retracement of the October 12 impulse), $1,781.8 (50% of the November 12 impulse) and $1,808, a volume node. The 4-hour double bottom, with a $1,835 neckline and a $1,930 objective, is not confirmed, and a hidden bearish diverg(continuation pattern) weighs on the period. The last complete candle, at 99% of average volume, validates no breakout.
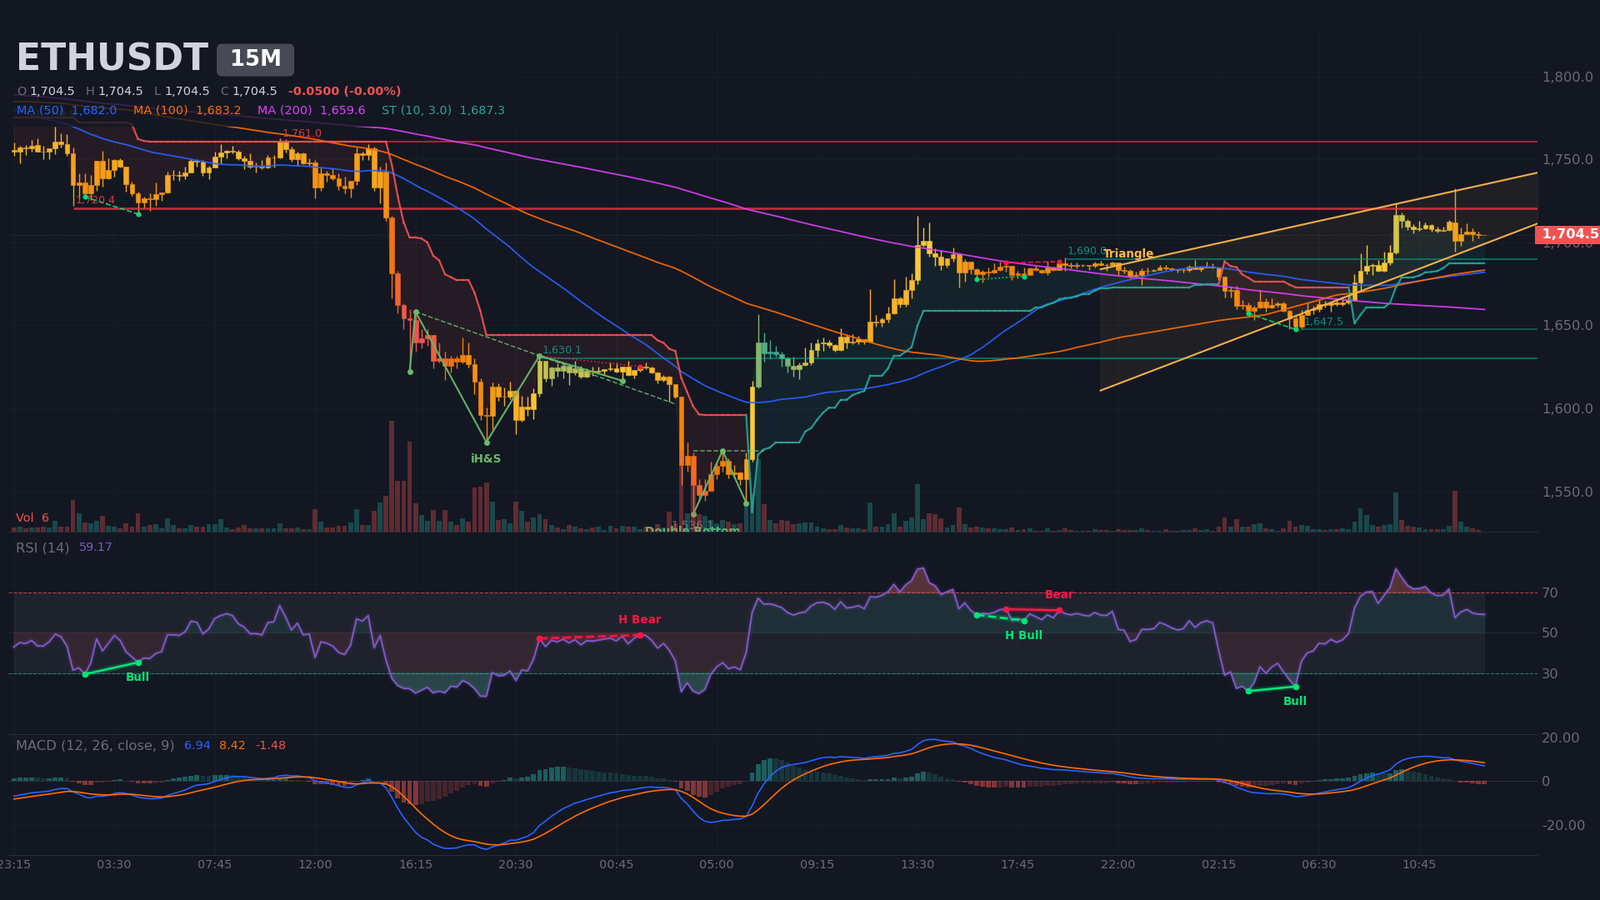
Intraday Structure (15m): compression wedge beneath $1,720
The 15-minute regime is directional but running out of steam, with ADX at 55, DI+ at 33 over DI- at 7, and a bullish SuperTrend at $1,687. An algorithmic wedge bounds price between $1,692 (support, two contacts) and $1,731 (upper boundary), with an estimated apex on November 23 around 05:08. RSI is 59, and MACD, above zero, crossed bearish on November 22 at 12:15. The double bottom and inverse head-and-shoulders are confirmed, but their $1,610 and $1,677 targets have been reached. A serious trigger requires a 15-minute close outside $1,692–$1,731, validated on the 4-hour chart.
Multi-Timeframe Synthesis
| Timeframe | Dominant trend | RSI (14) | MACD | Chart pattern |
|---|---|---|---|---|
| Daily (1D) | Bearish (mature impulse) | ~28 | Below zero, bearish crossover on Nov 8 | Confirmed double top (target reached) |
| 4 hours (4H) | Bearish (corrective rebound) | ~48 | Bullish crossover on Nov 21, below zero | Unconfirmed double bottom (hypothesis) |
| 15 minutes (15m) | Short-term bullish (compression) | ~59 | Bearish crossover on Nov 22, above zero | Compression wedge |
Map of Technical Levels and Pivots
The map combines daily and weekly pivots, Fibonacci retracements from the daily and 4-hour impulses, volume nodes and estimated liquidation pockets. The short-term central pivot at $1,630–$1,650 is the first structural support: the daily pivot P ($1,645.6), the weekly S1 ($1,643) and the November 22 low ($1,647.5) overlap there. The $1,690–$1,700 micro-supports belong to the 15-minute frame.
| Level | Price (USD) | Category | Technical basis |
|---|---|---|---|
| Major resistance 3 (R3) | $1,925 – $1,945 | Resistance | Daily R3 $1,934.9, 4H Fibonacci 38.2% ($1,934.5), 4H double bottom target ($1,930), detected resistance $1,939.8 |
| Major resistance 2 (R2) | $1,825 – $1,845 | Resistance | Daily R2 $1,825.4, daily Fibonacci 23.6% ($1,829), 4H double bottom neckline ($1,835.5) |
| Immediate resistance (R1) | $1,755 – $1,785 | Resistance | Daily R1 $1,755.1, volume node $1,761, 4H SMA50, daily Fibonacci 78.6% and 4H Fibonacci 23.6% ($1,782) |
| Central pivot (P) | $1,630 – $1,650 | Pivot | Daily P $1,645.6, weekly S1 pivot $1,643, November 22 low ($1,647.5) |
| Immediate support (S1) | $1,575 – $1,610 | Support | Daily S1 $1,575.3, estimated liquidation pocket $1,574–$1,579, buy wall $1,599.9, pocket $1,602–$1,611 |
| Major support 2 (S2) | $1,500 – $1,540 | Support | November 21 low ($1,536.1), start of the major impulse $1,503.6, detected support $1,507 |
| Major support 3 (S3) | $1,450 – $1,470 | Support | Daily S2 $1,465.8, weekly S2 $1,451.9, estimated liquidation pocket $1,463–$1,467 |
Order Book and Liquidity Heatmap
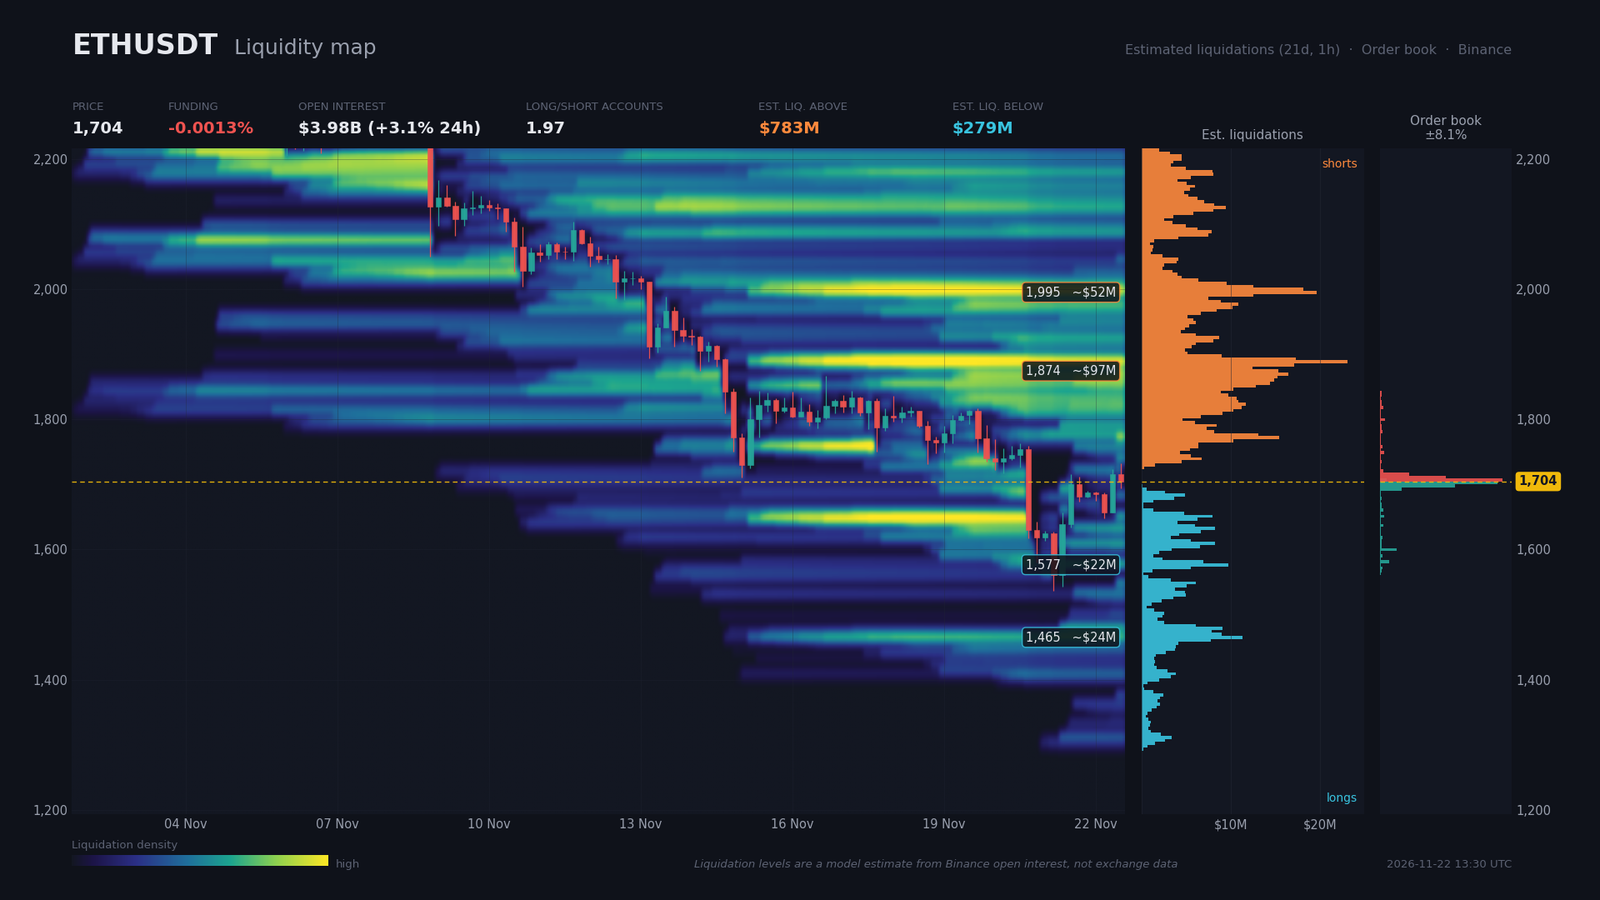
The order book is visible only within 8% of the price. Sell walls sit at $1,707 ($23.7M), $1,711 ($12.7M) and $1,716 ($5.6M), while buy walls stand at $1,702 ($22.9M), $1,697.5 ($14.5M) and $1,600 ($3.1M). A 0.4% imbalance confirms the 15-minute compression.
Estimated liquidation pockets (a model, not measured data) are asymmetric: roughly $783M of shorts above the price, including $97M between $1,849 and $1,877 (+10%), and roughly $279M of longs below, including $22M between $1,574 and $1,579. Funding is slightly negative (-0.0013%), open interest reaches $3.98B (+3.1% over 24 hours), and long/short ratios are 1.97 for accounts and 1.56 for large traders. Accounts remain mostly long while funding is negative, which suggests larger short positions. A liquidity sweep toward $1,849–$1,877 is a plausible but mechanical magnet, and it could exhaust quickly without spot demand behind it.
Calendar: Catalysts to Watch
The calendar is dense this week, with US inflation data as the pivotal event. Times are in Zurich time.
- Wed 11/25, 14:30 (Zurich) — Core PCE m/m (consensus 0.3% / previous 0.4%): a hotter print strengthens the Fed hike scenario.
- Wed 11/25, 14:30 (Zurich) — Core durable goods orders (consensus 0.4% / previous 1.8%) and personal income (consensus 0.4%): a second key release of the day.
- Fri 11/27, 09:00 (Zurich) — Monthly BTC and ETH options expiry (Deribit): pinning risk around strikes near the price.
- Fri 11/27, 16:00 (Zurich) — Monthly CME futures settlement: mechanical volatility expected.
- Tue 12/1, 16:00 (Zurich) — JOLTs (previous 7.523M) and ISM manufacturing employment (previous 52.4): confirmation or rejection of the tightening scenario.
Three Scenarios for the Coming Weeks
Scenario A leads Scenario B by ten points: daily ADX (46), the 3/5 confluence score and the bearish weekly trend weigh more than oversold conditions. Scenario B stays elevated because of the roughly $783M of estimated liquidations above the price and negative funding.
Scenario A — Failed rebound under resistance (probability 45%)
The central case sees the rebound fail below $1,755–$1,785, where the daily R1 ($1,755.1), the $1,761 volume node and the 78.6% daily Fibonacci level overlap. The most likely trigger is a 4-hour rejection below $1,785, following the November 25 PCE release and the November 27 options expiry. The path leads first to the $1,645 pivot and weekly S1 zone, then to $1,500–$1,540. The risk-reward ratio (R:R) is 1.56 toward $1,645 and 2.9 toward $1,540. The $80 stop exceeds the 4-hour ATR (average true range, $47) and sits above R2. Execution zone: sell near $1,770. Invalidation: 4-hour close above $1,850.
Scenario B — Bullish liquidity sweep, then rejection (probability 35%)
The trigger is a 4-hour close above $1,785 on above-average volume. The path leads to $1,825–$1,845 (R2), then to the estimated short pocket at $1,849–$1,877, where a liquidity sweep could occur. The R:R is 1.6 toward $1,870, but only 0.9 toward $1,835. The $50 stop exceeds the 4-hour ATR. Execution zone: buy near $1,790. Invalidation: 4-hour close below $1,740, under the 4-hour SuperTrend ($1,743).
Scenario C — Bullish reversal (probability 20%)
The trigger is a daily close above $1,990, above the daily SuperTrend ($1,988) and the SMA20 ($1,976). The path leads to $2,011 (38.2% Fibonacci), then to $2,155 (50% Fibonacci of the major impulse). The R:R is 2.4 for an entry near $2,000 with a $65 stop placed above the 4-hour ATR. Execution zone: buy near $2,000. Invalidation: 4-hour close below $1,935.
The signal to watch: a 4-hour close above $1,785 on above-average volume shifts the case toward B; a 4-hour close above $1,875 opens C. A daily close above $1,990 confirms the reversal.
Synthesis and Conclusion
Ethereum is emerging from a capitulation on 228% of average volume on November 20, amplified by rotation toward AI, ether ETF outflows and expectations of a Fed hike. The current rebound follows Bitcoin’s and is fed by short liquidations. Nothing in flows yet proves durable demand, since ether ETFs have seen outflows for seven weeks. The backdrop confirms the bearish bias, while oversold conditions soften the short term.
The dominant technical strategy is to sell rallies toward $1,755–$1,785, with protection above $1,850. The target is the $1,630–$1,650 zone, then $1,500–$1,540. Only a daily recovery above roughly $1,990 would validate a change of regime.
Sources
- Bitcoin Price Slips Near $58,300 As Nasdaq Falls 5% — Bitcoin Magazine, 20/11/2026
- Bitcoin Breaks Below $60K as Crypto Fear Index Hits Worst Level Since February — Decrypt, 20/11/2026
- Bitcoin suffered identical sell-off pattern ahead of Anthropic, SpaceX IPOs — CNBC, 20/11/2026
- Cathie Wood Bets $91M on Anthropic IPO While Paring Crypto Exposure — Decrypt, 20/11/2026
- Citi Trims 12-Month Bitcoin Target to $99,532, Citing ETF Outflows and Weak Demand — BigGo Finance, 18/11/2026
- Bitcoin falls below $60K for first time since July amid broader market selloff — Cointelegraph, 20/11/2026
- $400M in Crypto Shorts Liquidated as Market Recovers From Crash — Crypto Briefing, 22/11/2026
- Japan core inflation soars to highest this year as energy subsidy expiry pushes up consumer prices — CNBC, 20/11/2026
- Binance hacker moves nearly $600M in ETH, routes funds through THORChain, Chainflip — Cointelegraph, 20/11/2026
- Nov 13, 2026 Ethereum Whale Report: LINK, UNI See Multi-Wallet Accumulation — Deep Blue Alpha, 13/11/2026
Disclaimer: This article is for educational and informational purposes only. It does not constitute investment advice, a recommendation to buy or sell, or an invitation to trade any financial asset. Cryptocurrency markets are extremely volatile; any investment decision should be based on your own research (DYOR) and, where appropriate, the advice of a licensed financial adviser.

