


Ethereum has been under pressure since late September. On October 17, 2026, the price sits at $2,422, about 14% below the recent high of $2,806.8 set on September 21, and it has shed nearly 10% over the last twenty sessions. Since the $2,313 intraday low of October 15, the rebound has added only about 5%. The current phase looks like a correction inside a still-bullish long-term trend, with a short-term bearish bias, medium conviction and a confluence score of 3 out of 5.
The inflation shock of October 14-15 dominates the week. According to Decrypt (October 15), US CPI printed at 3.7% against 3.6% expected, Bitcoin slipped back below $80,000, and $948M of positions were liquidated in 24 hours, 90.6% of them longs. On October 15, the day of Ethereum’s low, CryptoTicker.io (October 17) counted $489M of forced closures in a single hour. The October 16 rebound toward $2,473 has since been erased.
Flows confirm the pressure. According to Wealthier Today (October 14), US spot Ethereum ETFs posted ten consecutive outflow sessions through October 12, roughly $782.8M since September 29, nearly erasing late-September inflows. On-chain, Binance balances fell from 3.90M to 3.47M ETH between August 25 and October 16, while the seven-day average spot volume dropped 53.6%, from $6.73B to $3.125B (CryptoTicker.io, October 17). There is less supply available, but demand is also absent.
Macro adds weight. MarketWatch (October 17) argues the Fed, meeting October 27-28, could raise rates, although markets price only a 17% probability. The Nasdaq has fallen about 6% from its peak. Releases on October 14-15 fed that risk: underlying inflation rose 0.3% month over month against 0.2% expected, producer prices 0.7% against 0.3%, and core retail sales 0.9% against 0.5%. Christine Lagarde cited 3.8% euro-area inflation for September (Cointelegraph, October 17). The SEC has proposed new crypto custody rules, with no direct impact on Ethereum established. The backdrop supports the bearish bias, which falling exchange reserves temper without negating.
Multi-Timeframe Technical Analysis
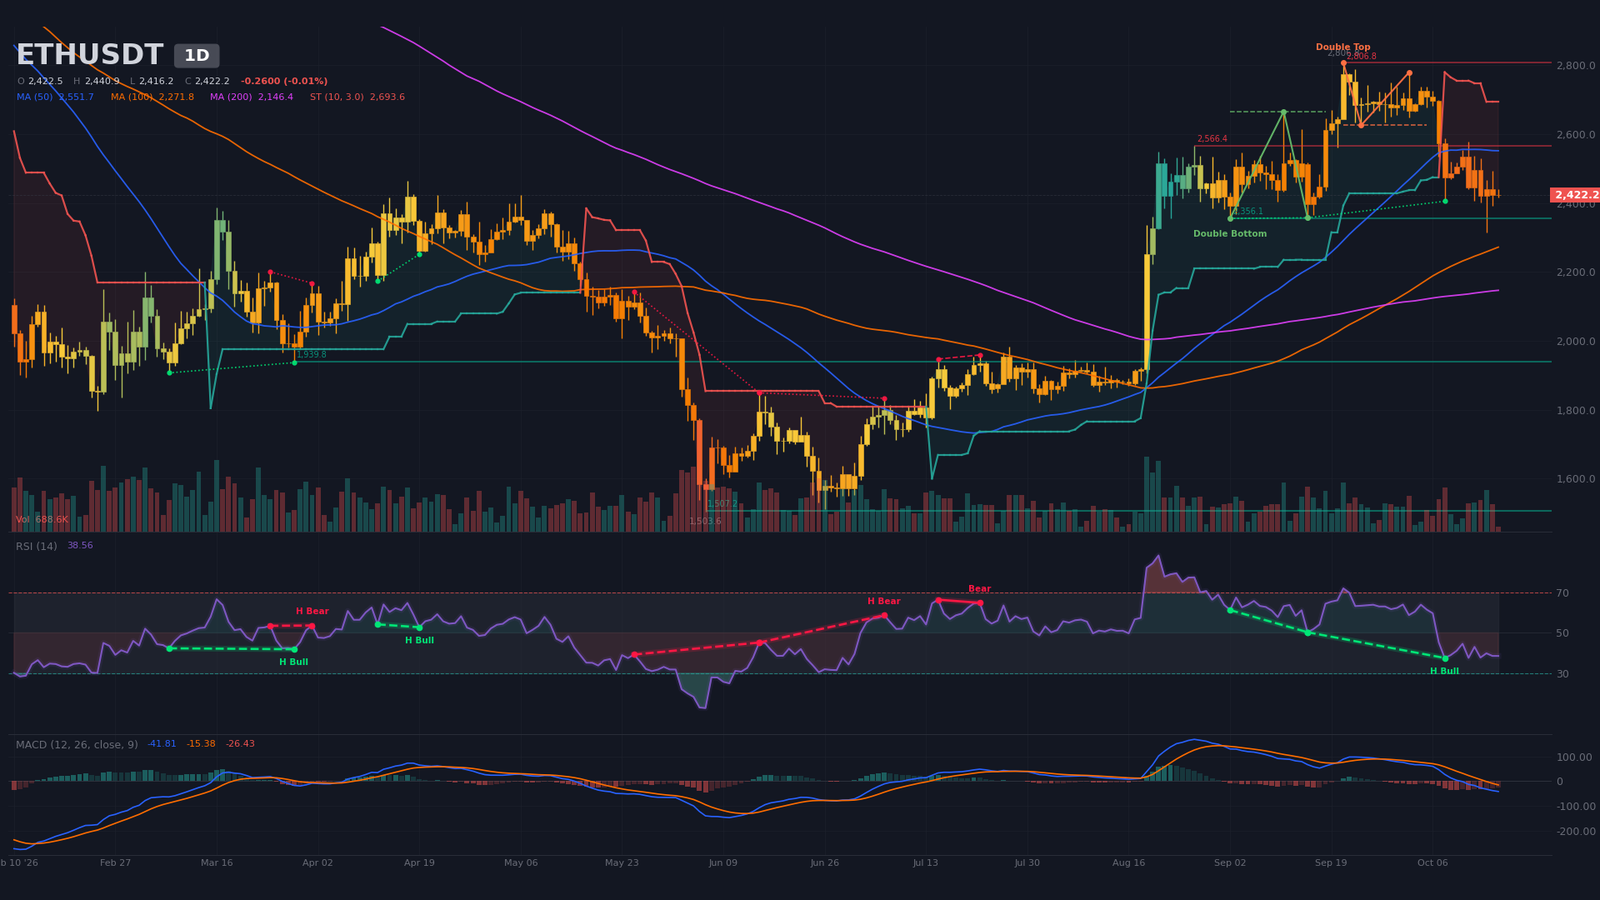
Daily Timeframe (1D): correction below the averages in a transition zone
The long-term trend remains bullish: price holds above the 200-day simple moving average (SMA200), near $2,146, and the 50/200 golden cross of August 31 remains valid. The correction began at the September 21 high. Price trades below the SMA20 (near $2,573) and the SMA50 (near $2,552), a typical early-distribution setup, and the SuperTrend stays bearish near $2,694.
The patterns conflict. The confirmed double top of October 2, with its neckline at $2,626, has already reached its $2,459 target. The double bottom of September 15 (neckline $2,666, target $2,976) stays inactive while price remains below that neckline. Supports sit at $2,356 and $1,940; resistance at $2,566.
The RSI (relative strength index) reads ~39, neutral but low. Two hidden bullish divergences (continuation) between September 15 and October 8 remain untriggered. The MACD (moving average convergence divergence) sits below its signal line and zero after the September 28 bearish crossover, while the current daily volume, at 22% of its 20-period average, is too partial to conclude.
The daily frame therefore calls for caution: as long as price stays below $2,552 and $2,573, a sustained recovery is not established.
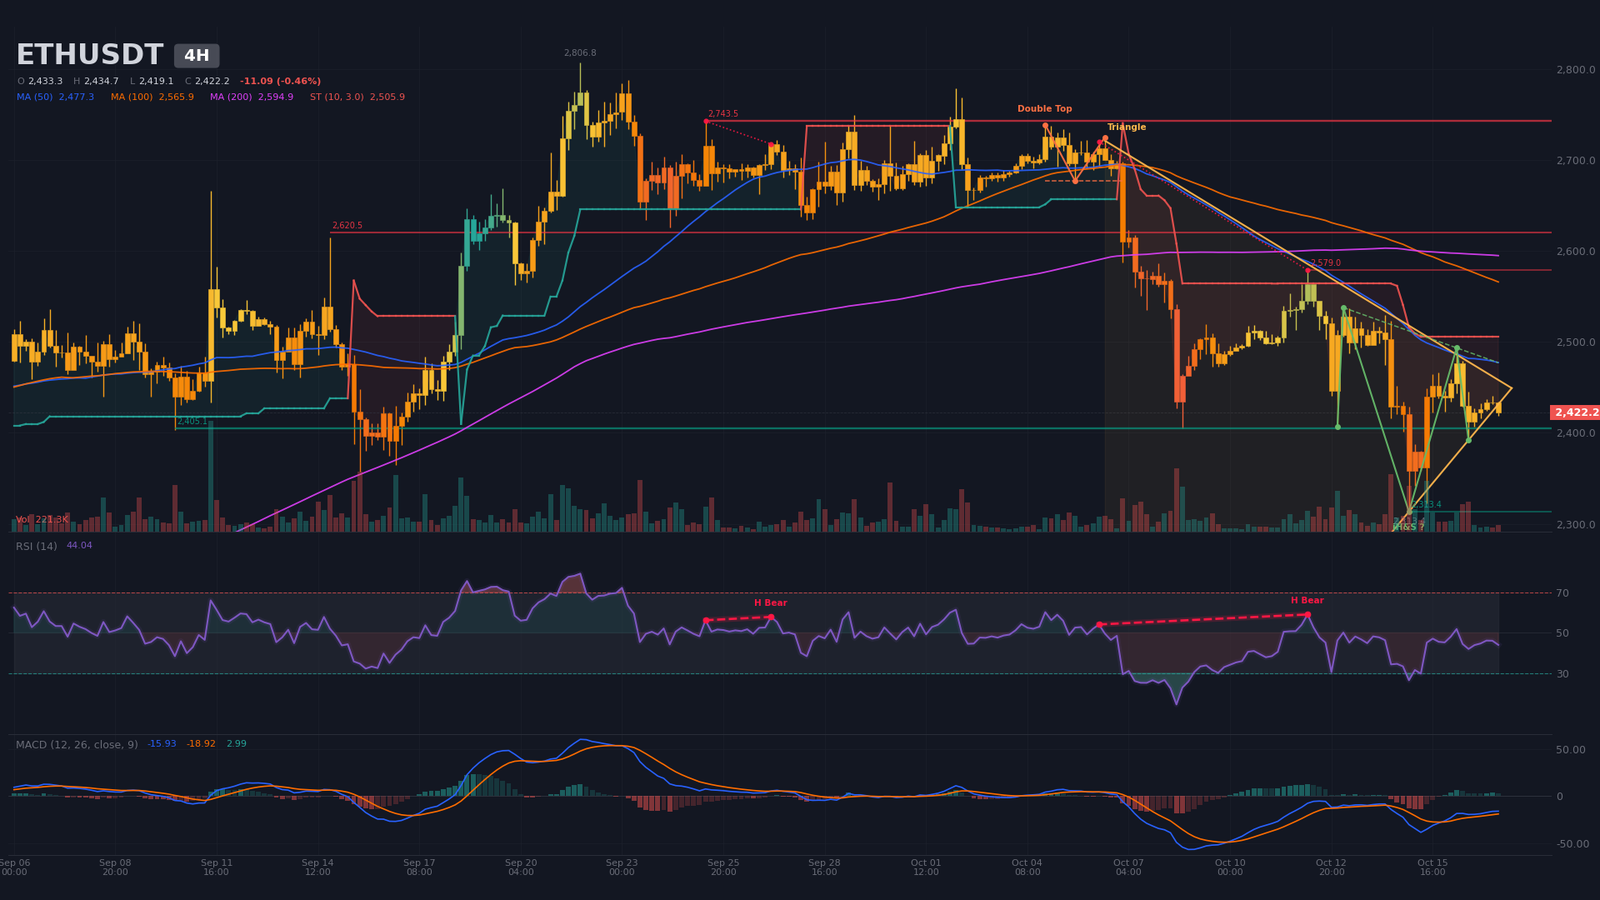
Intermediate Dynamics (4H): symmetrical triangle approaching its apex
On the 4-hour chart, lower highs since $2,579 (October 12) meet erratic lows at $2,313 and $2,392. The algorithm has tracked a symmetrical triangle since October 6, with an upper boundary near $2,478, a lower boundary near $2,392, and an apex estimated for late on October 17. Price sits below the SMA20 ($2,428), SMA50 ($2,477) and SMA200 ($2,595), and the 50/200 bearish cross dates to October 11. An inverse head and shoulders (EHE) is detected but unconfirmed: neckline $2,494, target $2,688.
The RSI near 44 and a MACD bullish crossover since October 16, above its signal line but still below zero, read as a bounce rather than a reversal. A hidden bearish divergence from October 6 to 12 keeps the downside case alive. Support at $2,405, tested three times, bounds the base, and volume at 33% of average shows the apex is forming with little conviction.
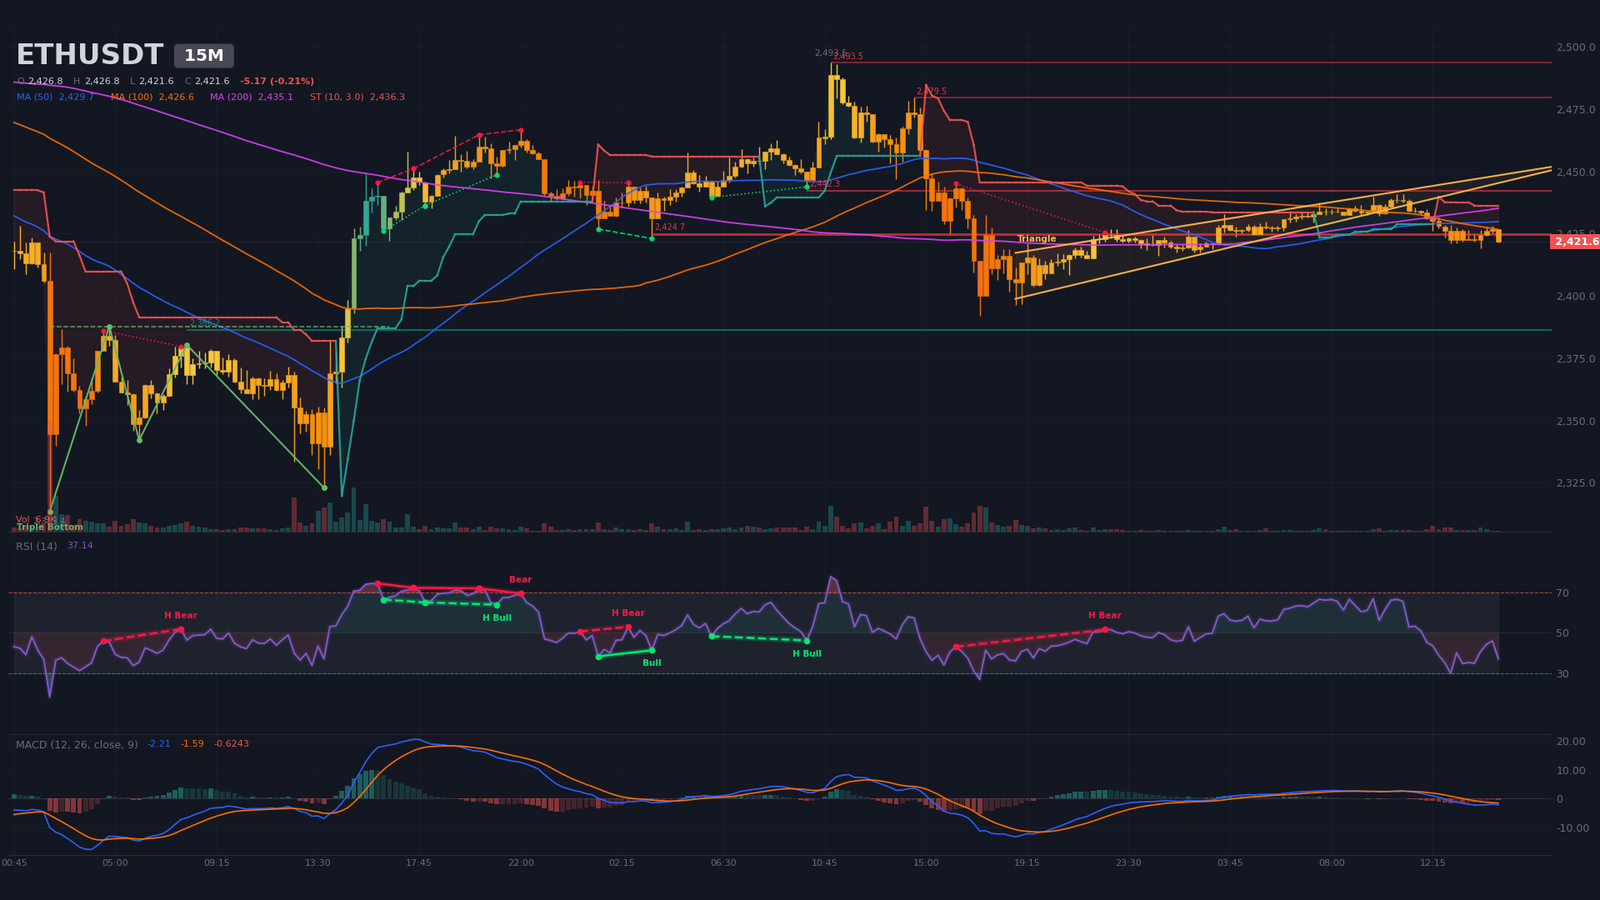
Intraday Structure (15m): wedge broken under a cluster of averages
On the 15-minute chart, a wedge between $2,435 and $2,442 has broken to the downside: at $2,422, price sits below its lower boundary. The SMA20, SMA50 and SMA200 are compressed between $2,429 and $2,435, the 50/200 bearish cross dates to overnight, and the SuperTrend at $2,436 is bearish. RSI sits near 37 and the MACD is in a bearish crossover. Resistance: $2,425 (four contacts) and $2,442; support: $2,386. As long as rebounds fail below $2,425, the intraday bias remains with sellers.
Multi-Timeframe Synthesis
| Timeframe | Dominant Trend | RSI (14) | MACD | Chart Pattern |
|---|---|---|---|---|
| Daily (1D) | Bearish correction below SMA20 and SMA50 | ~39 | Bearish cross on Sept 28, below zero | Confirmed double top (target reached) |
| 4 hours (4H) | Bearish (compression) | ~44 | Bullish cross on Oct 16, below zero | Symmetrical triangle at apex |
| 15 minutes (15m) | Bearish | ~37 | Bearish cross on Oct 17 | Wedge broken to the downside |
Confluence rests on three consistent bearish signals: the SuperTrend, the position below the averages, and the MACD on 1D and 15m. Hidden daily divergences and the 4H MACD cap the score at 3 out of 5.
Technical Level Map: Pivots and Key Zones
The method combines classic daily pivots (central pivot at $2,436) with swings, pattern boundaries, order walls and estimated liquidation pools. No Fibonacci extension is retained, since the reference impulse is not clear enough. The short-term pivot sits in the $2,425 to $2,436 zone.
| Level | Price (USD) | Category | Technical Basis |
|---|---|---|---|
| Major Resistance 3 (R3) | $2,800 – $2,820 | Resistance | September 21 high ($2,806.8), estimated short pool $2,799–$2,818 (~$111M) |
| Major Resistance 2 (R2) | $2,566 – $2,630 | Resistance | Daily resistance $2,566, daily SMA20, estimated short pool ~$2,590–$2,609, double-top neckline $2,626 |
| Immediate Resistance (R1) | $2,478 – $2,498 | Resistance | H4 triangle upper boundary, EHE neckline $2,494, R1 pivot $2,480, sell wall $2,498 |
| Central Pivot (P) | $2,425 – $2,436 | Pivot | Daily pivot $2,436, 15m resistance $2,425 (four contacts), sell walls $2,424–$2,431 |
| Immediate Support (S1) | $2,392 – $2,405 | Support | H4 triangle lower boundary, H4 support $2,405 (three contacts), October 8 low ($2,405) |
| Major Support 2 (S2) | $2,313 – $2,356 | Support | October 15 low ($2,313), daily support $2,356 (two contacts) |
| Major Support 3 (S3) | $2,260 – $2,280 | Support | Estimated long pool ~$2,261–$2,276 (~$52M); below, pools ~$2,176–$2,213 and daily SMA200 ~$2,146 |
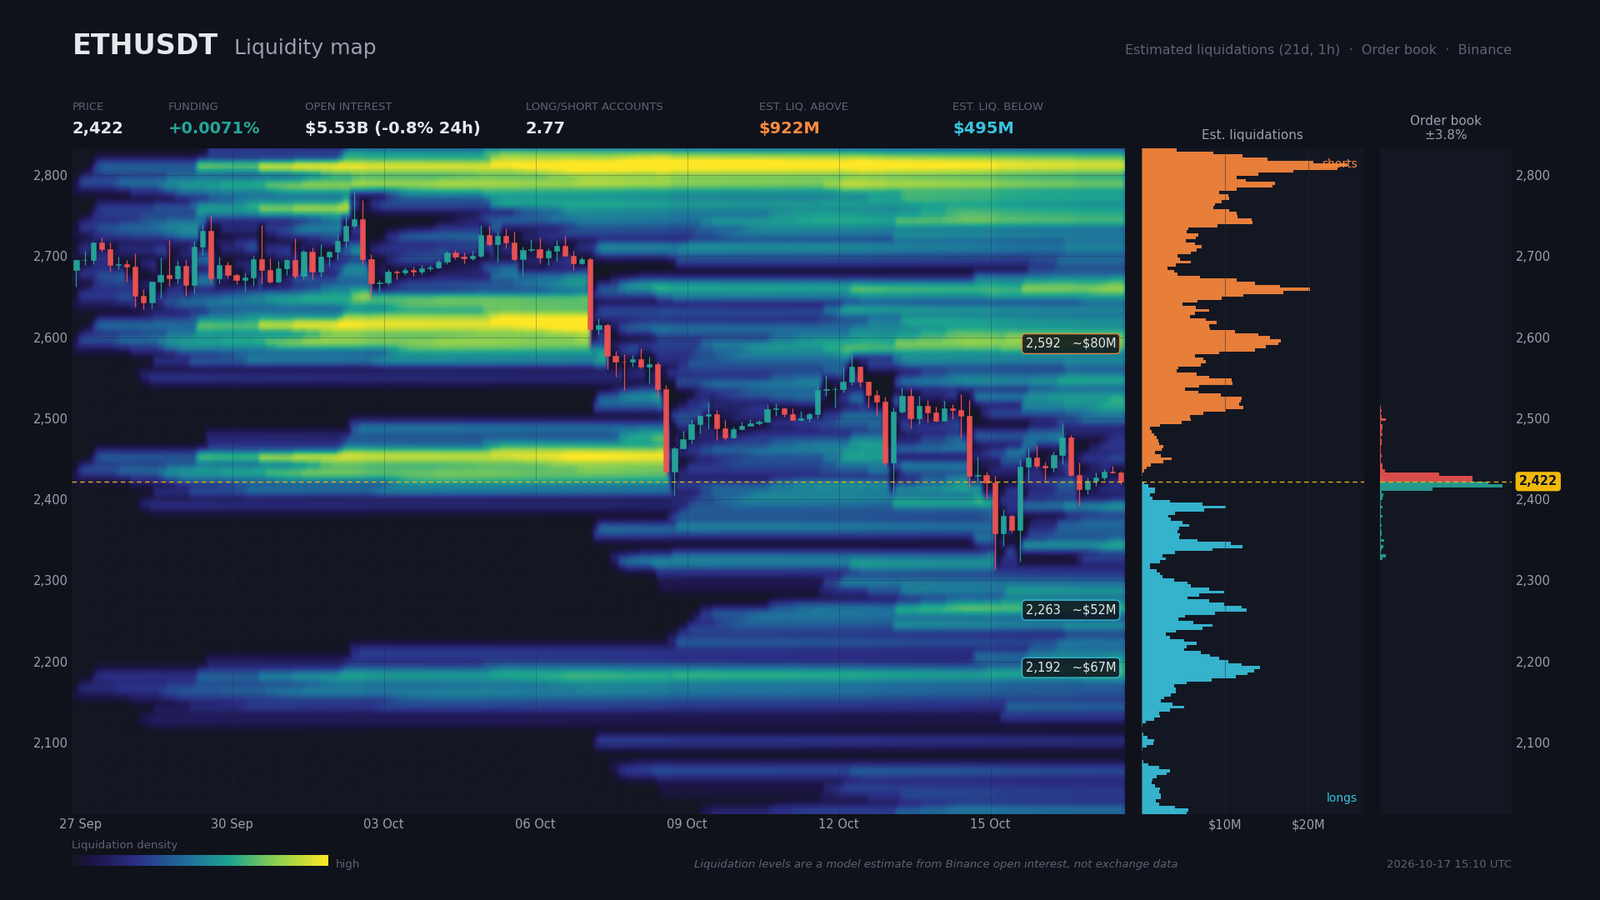
Order Book and Liquidity Heatmap
The visible order book covers only 3.83% around the price, so it informs mainly the very short term. Sell walls stack between $2,424 ($25.2M) and $2,431 ($16.2M), while buy walls sit between $2,413 and $2,420 ($29.7M at $2,420). Within 2%, bids total $82.1M against $70.4M of asks, a 7.7% imbalance in favor of buyers. Price is caught between two nearly symmetric walls, 0.1% on either side, which fits the compression.
Liquidation pools, estimated by model rather than measured, lean upward: roughly $922M of shorts, including ~$111M near $2,808 and ~$80M near $2,592. Below the price sit about $495M of longs, including ~$52M near $2,263, the most accessible pool.
Funding, at 0.0071% (about 7.8% annualized), stays positive and moderate. Open interest of $5.53B is down 6.07% over seven days, the sign of deleveraging without capitulation. The account long/short ratio reads 2.775, against 1.672 for large traders, and the 24-hour taker buy/sell ratio falls to 0.939. The crowd is clearly long, so the risk is a liquidity sweep below $2,392 before any durable rebound.
Calendar: Catalysts to Watch
Releases already published have set the tone; the next ones will shape the structure. No Deribit options expiry or CME settlement on Ethereum appears on the calendar.
- Monday, October 19, 04:00 (Zurich) — China GDP q/q (consensus 1.1; prior 0.9), industrial output (5.4; 5.2), retail sales (0.5; 0.4): risk appetite in Asia.
- Tuesday, October 20, 14:30 (Zurich) — US housing starts (1.3; prior -2.6) and building permits (1.4; 1.403): reading the path of rates.
- Wednesday, October 21, 08:00 (Zurich) — UK annual inflation (3.4; 3.1): global monetary tightening.
- Thursday, October 22, 14:30 (Zurich) — US initial jobless claims (200; 199): labor market strength ahead of the Fed.
- Tuesday, October 27, 13:30 (Zurich) — US durable goods (prior 0), then the Fed meeting of October 27-28, time not provided: a major event and a risk of a rate hike.
Three Scenarios for the Coming Weeks
The horizon runs several weeks, up to the Fed meeting. All three scenarios hinge on 4-hour closes, which will settle the exit from the apex.
Scenario A — Bearish Triangle Breakdown (probability 50%)
The central case is a bearish breakdown. A 4-hour close below $2,392, then below $2,356, would confirm the move lower, supported by the October 19-21 data and then by the Fed, where a rate hike is the risk. Successive targets are $2,356, $2,313, then the estimated long pool at $2,261–$2,276. With a stop at $2,495, about 1.7 times the 4H average true range (ATR) of $36, and a $2,313 target, the reward-to-risk ratio (R:R) is near 2. Execution zone: sell rallies between $2,425 and $2,445, where the 15m resistance and sell walls overlap. Invalidation: a 4-hour close above $2,494, the EHE neckline.
Scenario B — Range Inside the Triangle (probability 30%)
Price stays trapped between $2,392 and $2,478 until the Fed, with false breaks of the apex. Walls of roughly $25M to $33M on either side feed the wicks. Buying near the three-contact H4 support and selling near $2,478 structure trading in this configuration. Execution zone: buys between $2,392 and $2,405, sells near $2,478. Invalidation: a 4-hour close outside the triangle, below $2,392 or above $2,494.
Scenario C — Bullish Invalidation (probability 20%)
A 4-hour close above $2,494 would validate the inverse head and shoulders, still hypothetical. Targets are $2,566, then the estimated short pool at $2,590–$2,609 (~$80M), $2,626 and $2,688, the pattern objective. A possible catalyst would be a Chinese print beating expectations on October 19, or a slowdown in UK or Japanese inflation. Execution zone: retest of $2,478–$2,494. Invalidation: a 4-hour close back below $2,440, the lower boundary of the 15m wedge.
Synthesis and Conclusion
Ethereum is in an orderly correction within a long-term trend that remains bullish, with the daily SMA200 at $2,146. The current phase resembles a consolidation with a distributive bias: ETF outflows, spot volume halved, positive funding and a crowded long side. Falling exchange reserves offer structural support, but without buyers they do not create a rally, as CryptoTicker.io (October 17) points out.
The dominant technical strategy retained by the analysis is to sell rallies toward $2,425–$2,445 as long as the 4H stays below $2,494, with protection above $2,495 and successive targets at $2,356 and then $2,313. No directional conviction is retained before the exit from the apex, a mechanical rather than directional signal. Critical levels: $2,494, $2,425–$2,436, $2,392–$2,405, $2,313–$2,356 and $2,626.
Sources
- Bitcoin Bounces, But Where Does It Go Next? Here’s What the Charts Say — Decrypt, October 16, 2026
- Bitcoin Whipsaws as Crypto Liquidations Near $1 Billion — Decrypt, October 15, 2026
- Fed interest-rate decision this month is a closer call than markets think — MarketWatch, October 17, 2026
- Nowhere to hide: Tech selloff hits software and chip stocks alike — MarketWatch, October 16, 2026
- Lagarde says euro-area economy is resilient, digital euro imminent — Cointelegraph, October 17, 2026
- Ethereum ETF Investors Are Pulling Back. What Could Reverse the Trend? — Wealthier Today, October 14, 2026
- Ethereum Spot ETFs Extend Nine-Day Outflow Streak With $635 Million October Drain — Cubed, October 12, 2026
- Ethereum exchange reserves hit a multi-year low — CryptoTicker.io, October 17, 2026
- SEC Adviser and Regulated Fund Custody Rules; Crypto Custody Rules (proposal) — sec.gov, October 5, 2026 (date not confirmed)
- CME Futures launch news fails to spur UNI’s price rally — AMBCrypto, October 17, 2026
Disclaimer: This article is for educational and informational purposes only. It does not constitute investment advice, a recommendation to buy or sell, or an invitation to trade any financial asset. Cryptocurrency markets are extremely volatile; any investment decision should be based on your own research (DYOR) and, where appropriate, the advice of a licensed financial adviser.

