


Bitcoin (BTC/USDT) is trading on July 14, 2026, in a tight consolidation zone around $62,650, squeezed between a bearish Ichimoku resistance cloud overhead and a solid liquidity floor below. Between conflicting algorithmic signals and an intraday stop-hunt, here is a structured read across the four timeframes that define today’s market map.
Macro View: A Historic Range Between $56,000 and $84,000
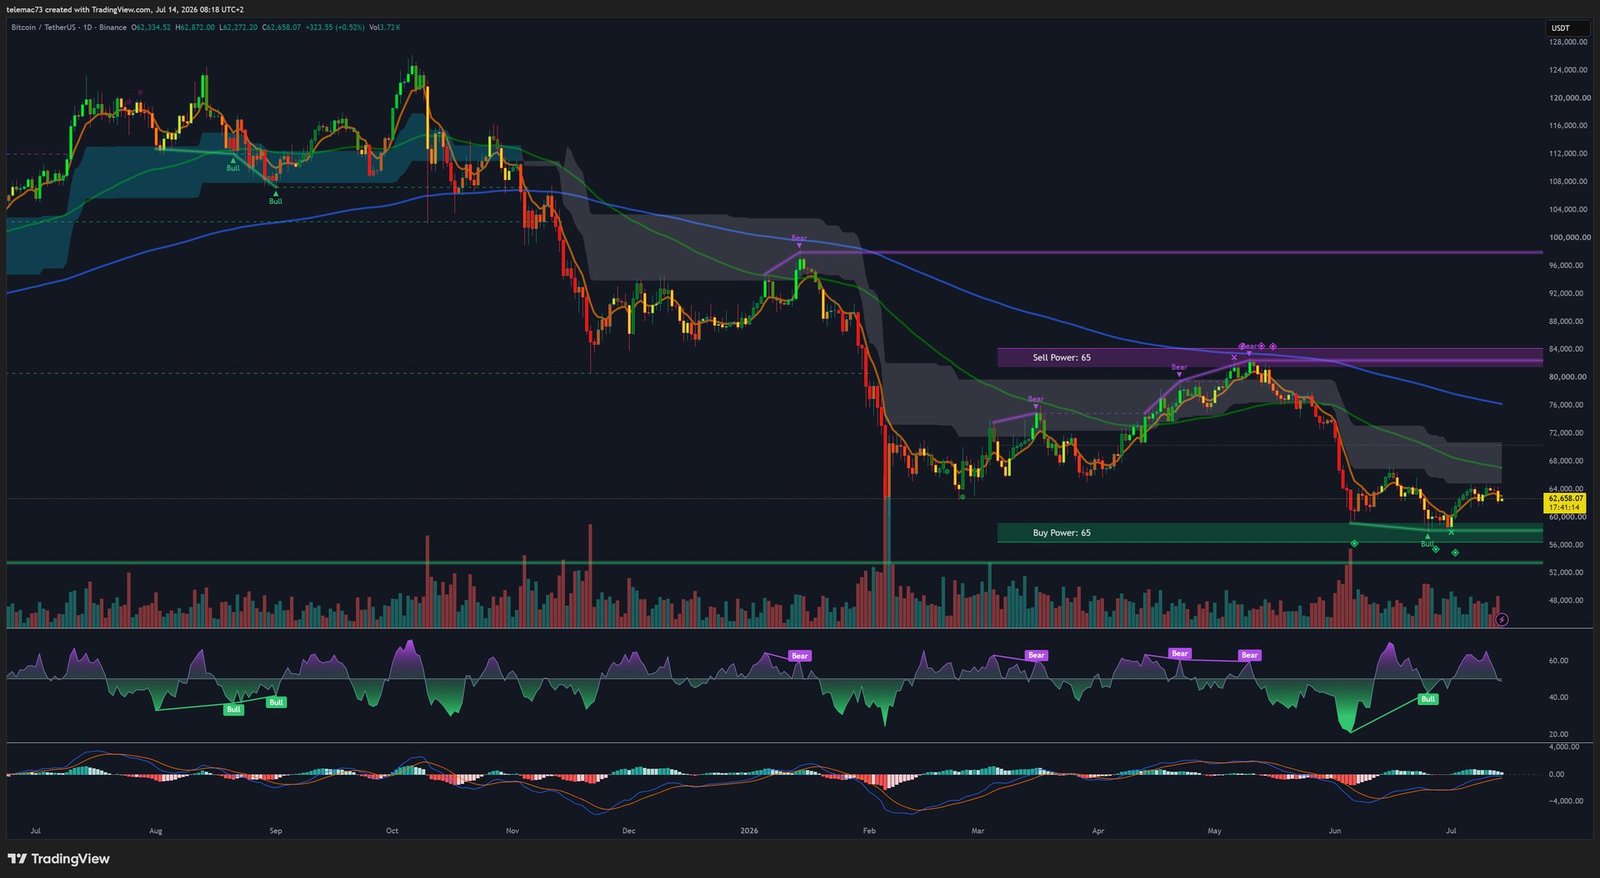
On the daily timeframe the picture is clear: after peaking above $120,000 during the previous cycle, Bitcoin now trades in the lower portion of its macro range. Two structural boundaries frame the market on this timeframe: a macro « Sell Power » zone at $84,000 and a macro « Buy Power » floor at $56,000. As long as price stays contained between these two extremes, the most rigorous read remains a consolidation phase within a medium-term downtrend, with no invalidation of the macro structure.
Medium-Term Structure (4H): An Ichimoku Cloud Locking the Market
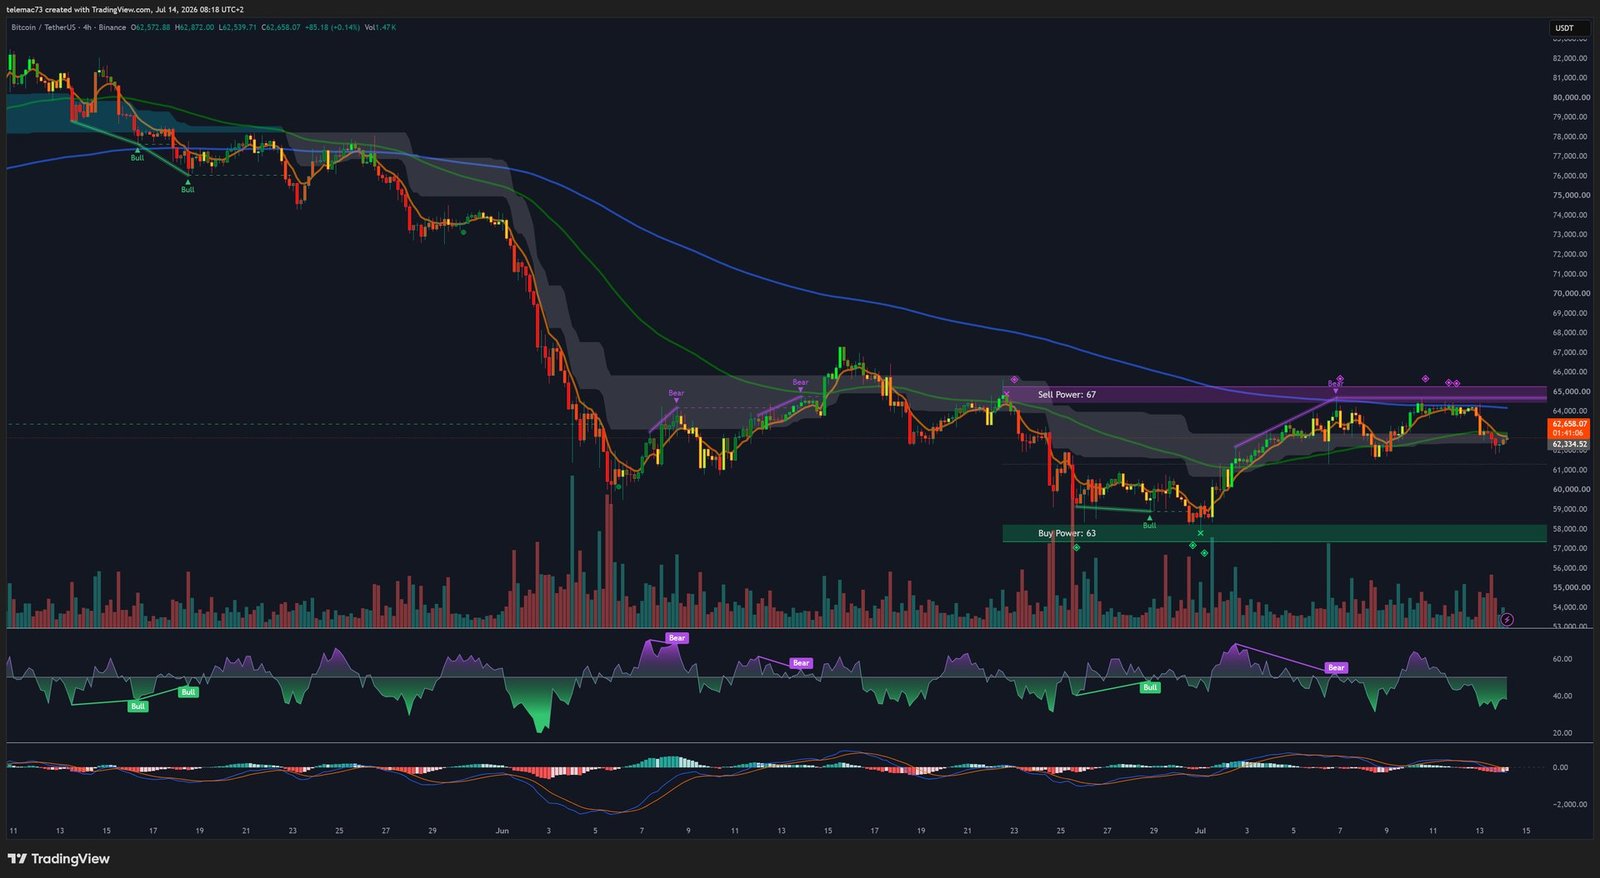
On the 4-hour horizon, price is hovering around $62,658, pressed under a bearish Ichimoku Cloud acting as a technical ceiling. Two operational thresholds stand out clearly from this structure: a sell threshold at $65,000 and a buy threshold at $58,000, forming the boundaries of the current range. Bullish and bearish algorithmic signals overlaid on price action confirm a ranging phase rather than a decisive directional trend. Momentum oscillators — RSI and MACD (the difference between the 12- and 26-period exponential moving averages) — remain neutral, with no notable divergence, reinforcing the case for a technical consolidation ahead of a more decisive directional move.
Microstructure: The Liquidity Wall Behind the Stall
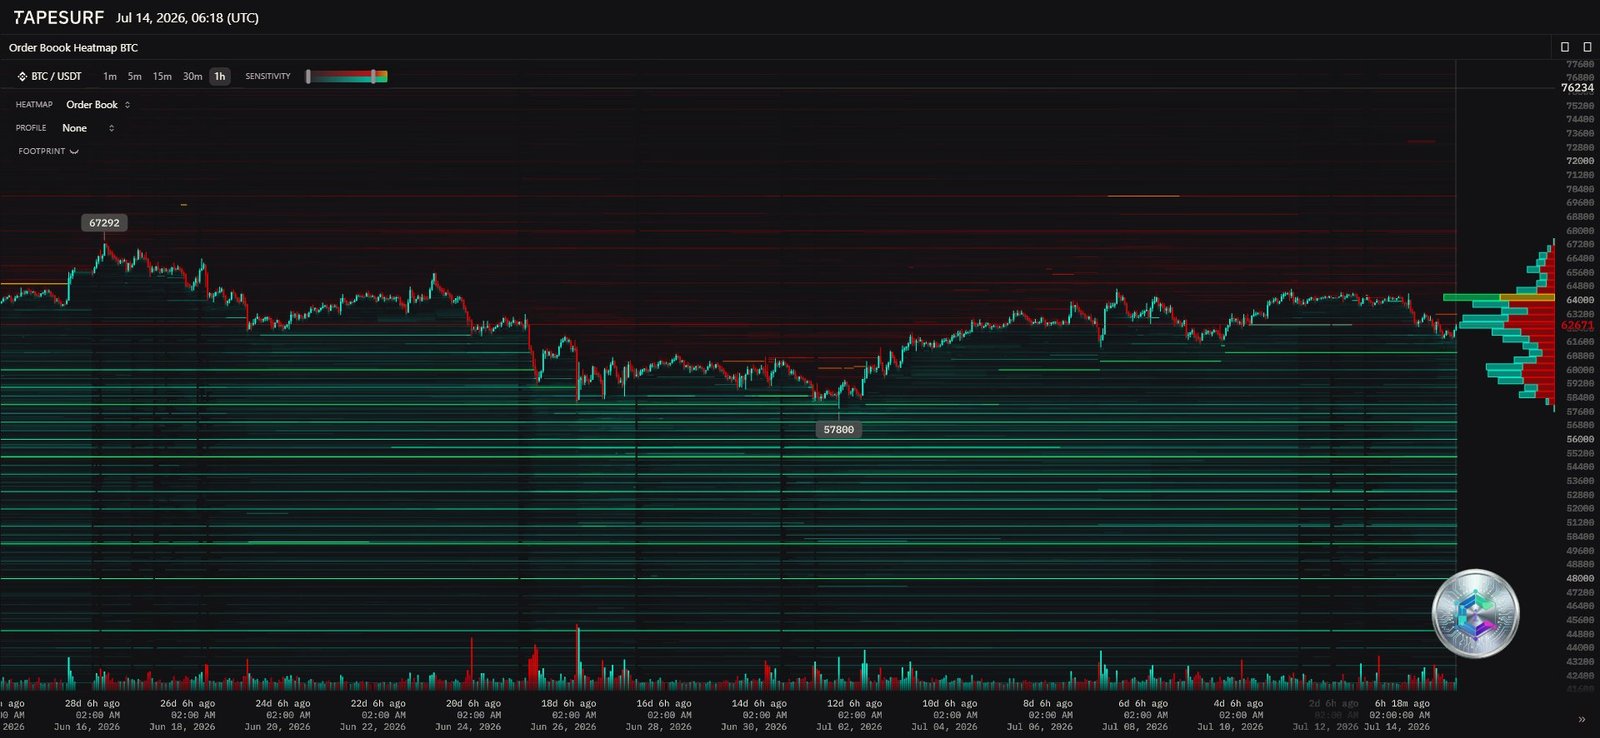
The order book heatmap provides the microstructural explanation for the stall observed across the other timeframes. The Point of Control (POC) — the price level concentrating the highest traded volume — sits precisely around $62,671, exactly where the market is currently oscillating. Above it, thick bands of sell-side liquidity form a firm resistance ceiling. Below it, dense clusters of buy orders establish a structural support floor. This configuration, typical of a market in temporary equilibrium, explains why recent price action has struggled to break decisively away from the current zone.
Intraday Volatility (15m): Stop-Hunt and Swift Recovery
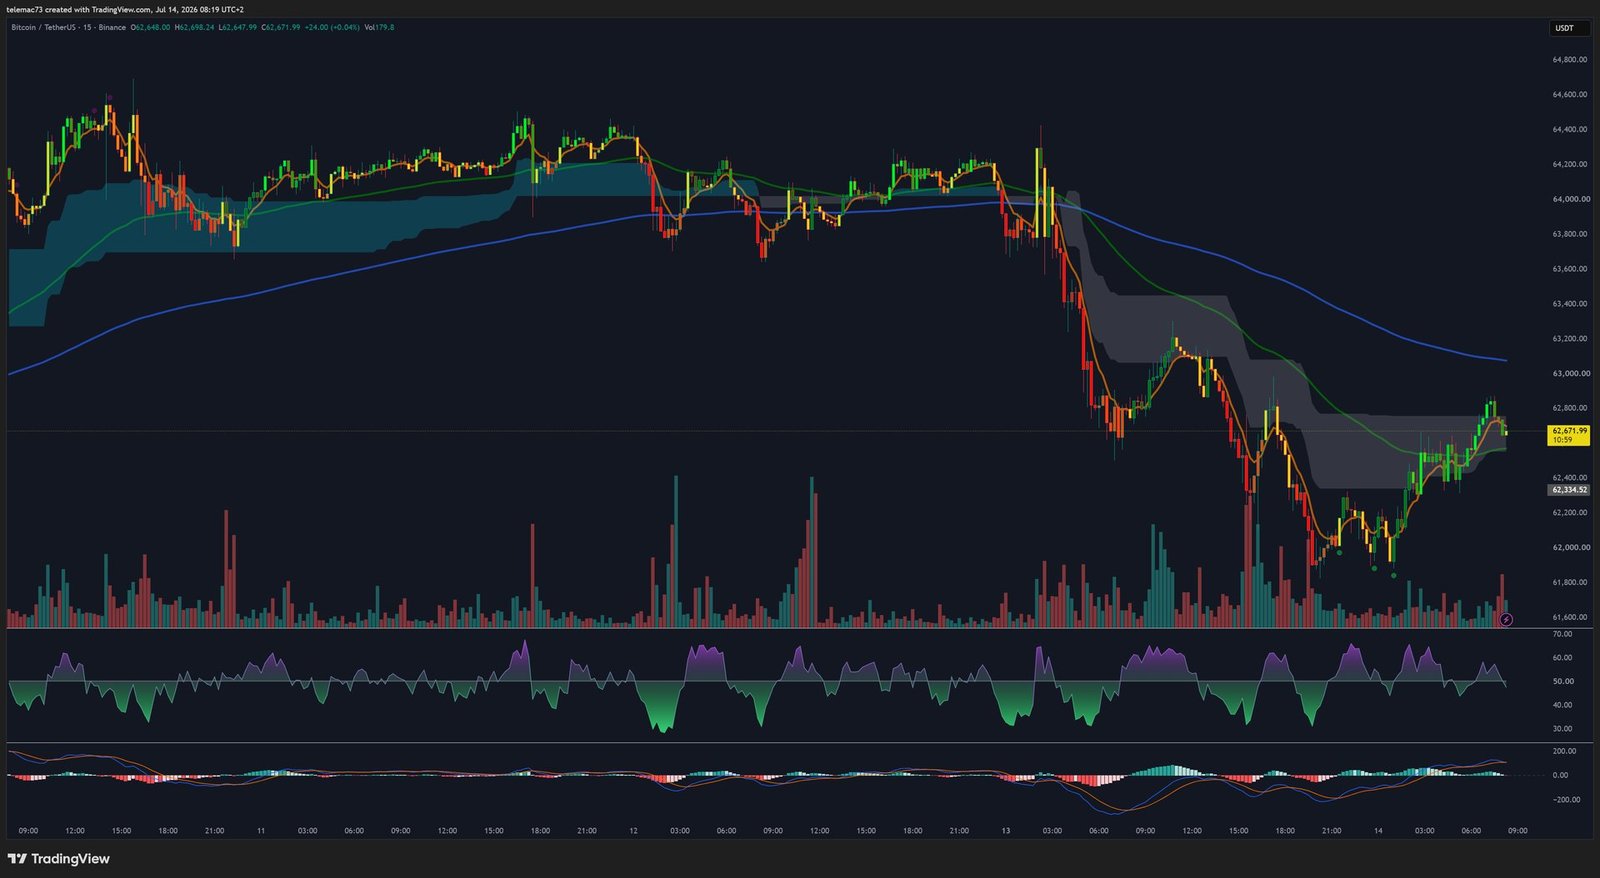
On the 15-minute timeframe, the market shows the typical « chop » of a range-bound crypto asset. A liquidity wick swept down to $62,334 before a rapid bounce, a classic signature of market makers hunting stop-losses ahead of a reversal. While unsettling for intraday traders in the short term, this type of move generally confirms the strength of the support floor identified on the higher timeframes.
Summary and Scenarios
The confluence of these four reads paints a market in precarious balance: as long as Bitcoin holds above the $58,000–$62,334 support floor, the range structure remains valid, with first-line resistance at $65,000 and then $84,000 in the event of a confirmed bullish breakout. Conversely, a 4H close below $58,000 would open the path toward the macro support at $56,000. Caution remains warranted until the Ichimoku Cloud is decisively cleared to the upside on a closing basis.
Disclaimer: This article is provided for informational and educational purposes only. It does not constitute investment advice, a recommendation to buy or sell, or a solicitation of any financial nature. Cryptocurrency markets are highly volatile, and any financial commitment should be based on your own research and, where appropriate, the advice of a licensed professional.

