


Bitcoin is navigating a pivotal moment as August 2026 draws to a close. Having surged nearly 25% off its recent lows, the flagship crypto asset now trades in a zone of high tension, squeezed between structural institutional demand and the gravitational pull of a massive options expiry on Deribit. On the eve of the Federal Reserve chair’s closely watched Jackson Hole speech, this report offers a full-spectrum read of the market: the macro backdrop, ETF flows, derivatives positioning, order-book liquidity via the heatmap, and a multi-timeframe technical study across the 15-minute, 4-hour, and daily charts.
The macro backdrop: the “debasement trade” returns
The narrative of Bitcoin as a store of value against currency debasement has gained considerable traction in recent weeks. The trigger was a symbolic threshold crossed in mid-August: US national debt surpassed $40 trillion, just five months after breaching $39 trillion in March, underscoring a clear acceleration in the federal borrowing trajectory.
Facing a heavy sell-off in the bond market that pushed long-term Treasury yields to multi-decade highs, US Treasury Secretary Scott Bessent orchestrated a surprise intervention: doubling the size of long-term government debt buyback operations to at least $4 billion per operation. Institutional investors read this not as a structural fix but as a form of stealth quantitative easing, which weighed on the dollar and fueled a rotation of capital into alternative stores of value. Gold rallied more than 13% in August, on track for its best month since 1999, while Bitcoin rode the same narrative wave to break out of its summer consolidation.
This macro backdrop is compounded by heightened anticipation around the annual Jackson Hole symposium and the inaugural keynote from Fed Chair Kevin Warsh, scheduled for August 28. Markets are holding their breath: Bitcoin’s resilience near $80,000 reflects genuine relative strength, yet spot volumes point to a cautious, wait-and-see posture. The asset’s growing correlation with high-growth tech equities — above 0.5 over a 90-day window against names like Nvidia — makes it particularly sensitive to shifting liquidity and rate expectations.
On the regulatory front, political alignment has strengthened as well: President Trump has urged Congress to pass the “Clarity Act,” framed as a strategic priority for maintaining US technological leadership, while the CFTC and SEC have both signaled constructive moves toward looser rules and modernized digital-asset custody frameworks. This alignment meaningfully reduces the legal-risk premium that has historically weighed on crypto valuations.
Bitcoin ETFs: structural institutional demand
Unlike prior bull cycles largely driven by retail speculation, the current trajectory rests on continuous, measurable accumulation through institutional investment vehicles.
| Cumulative Spot Bitcoin ETF Data (August 2026) | Volume / Value |
|---|---|
| Cumulative net inflows since launch (Jan. 2024) | > $51.3B |
| Cumulative net inflows in August 2026 | > $3.03B |
| BTC equivalent absorbed in August | ~21,958 BTC |
| Recent streak of positive daily flows | 8 consecutive days |
| IBIT (BlackRock) net flows on Aug. 25 | +$284.4M |
The recent streak illustrates unshaken institutional appetite, with BlackRock’s IBIT continuing to dominate daily inflows. Context matters here, though: between August 3 and 17, ETF flows swung sharply, moving from heavy inflows to net outflows of nearly $390 million. Yet during that apparent turbulence, Bitcoin’s price held a tight range around $62,000 — evidence that underlying market liquidity has thickened considerably. The subsequent inflows, which exceeded $3 billion for the month, confirm that the rally toward $80,000 is anchored in genuine spot demand, reducing the odds of a sudden collapse driven by speculative deleveraging.
Derivatives market: a record options expiry and a leverage flush
While spot demand dictates the underlying trend, the derivatives market acts as both accelerator and brake on short-term price action. The end of August brings a complex setup across futures and options.
| Bitcoin Options Expiry Summary (August 28, 2026) | Metric |
|---|---|
| Total expiring contracts | ~81,700 BTC |
| Notional value | ~$6.44B |
| Put/Call ratio | 0.833 |
| Call contracts | ~44,639 contracts |
| Put contracts | ~37,061 contracts |
| Max Pain price | ~$68,000 |
A Put/Call ratio of 0.83 points to a moderately bullish bias. The most critical observation, however, is the wide gap between the current market price (around $80,000) and the Max Pain level, estimated at $68,000 — the price at which the majority of contracts would expire worthless, maximizing market-maker profits. That divergence theoretically creates downward pressure, but the heavy concentration of Call contracts around the $75,000–$80,000 strikes introduces an opposite risk: a gamma squeeze. If spot buying pressure stays strong enough to hold price above those strikes into expiry, market makers who sold those calls will be forced to buy Bitcoin aggressively to hedge their exposure, potentially triggering a sharp upward spiral.
A particularly healthy signal emerges from open interest data: between August 12 and 23, outstanding derivatives contracts fell from roughly 353,500 to 312,600 BTC — an 11% decline — even as price rallied 25%. This contraction confirms the rally is not being fueled by heavily leveraged speculation. Around August 19, a historic liquidation event wiped out between $1.37B and $1.76B in short positions, while funding rates stayed muted, implying an annualized rate below 10%. The market therefore appears to be driven organically by spot buying rather than excessive leverage.
Reading liquidity: the order-book heatmap
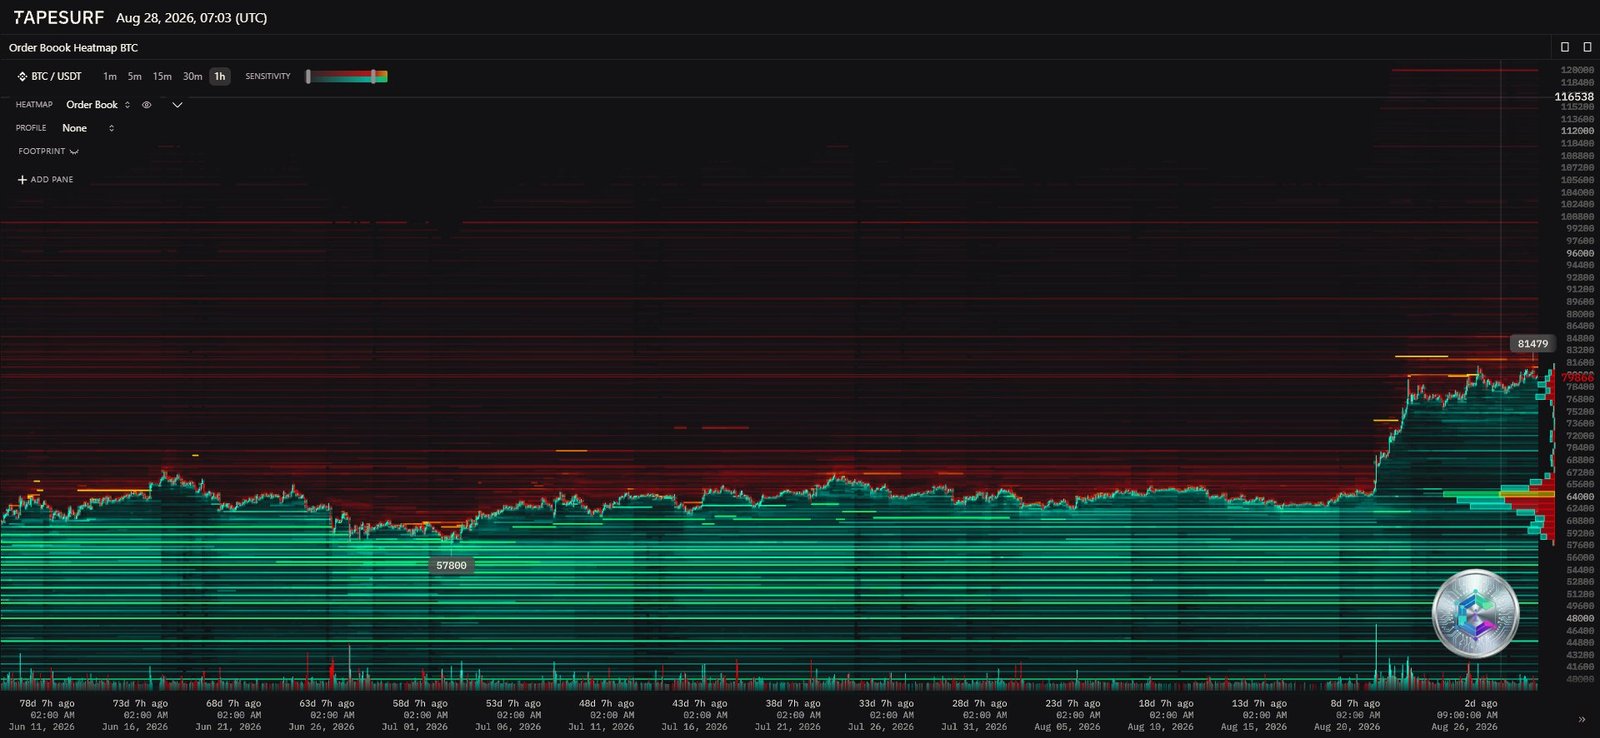
The heatmap shows a market literally boxed in between two asymmetric liquidity walls. On the resistance side, a dense sell wall begins at $81,479 and extends up to the $82,500 zone, suggesting institutional or algorithmic orders defending that psychological ceiling. On the support side, a deep buy-side base forms around $57,800, with density remaining strong throughout the $60,000-to-that-level range. This configuration explains both the slowing momentum below $81,000 and the market’s resilience on pullbacks: any correction triggered by a macro catalyst would likely meet solid buying demand well before reaching $60,000.
Daily chart (1D): a bullish underlying structure, but running hot
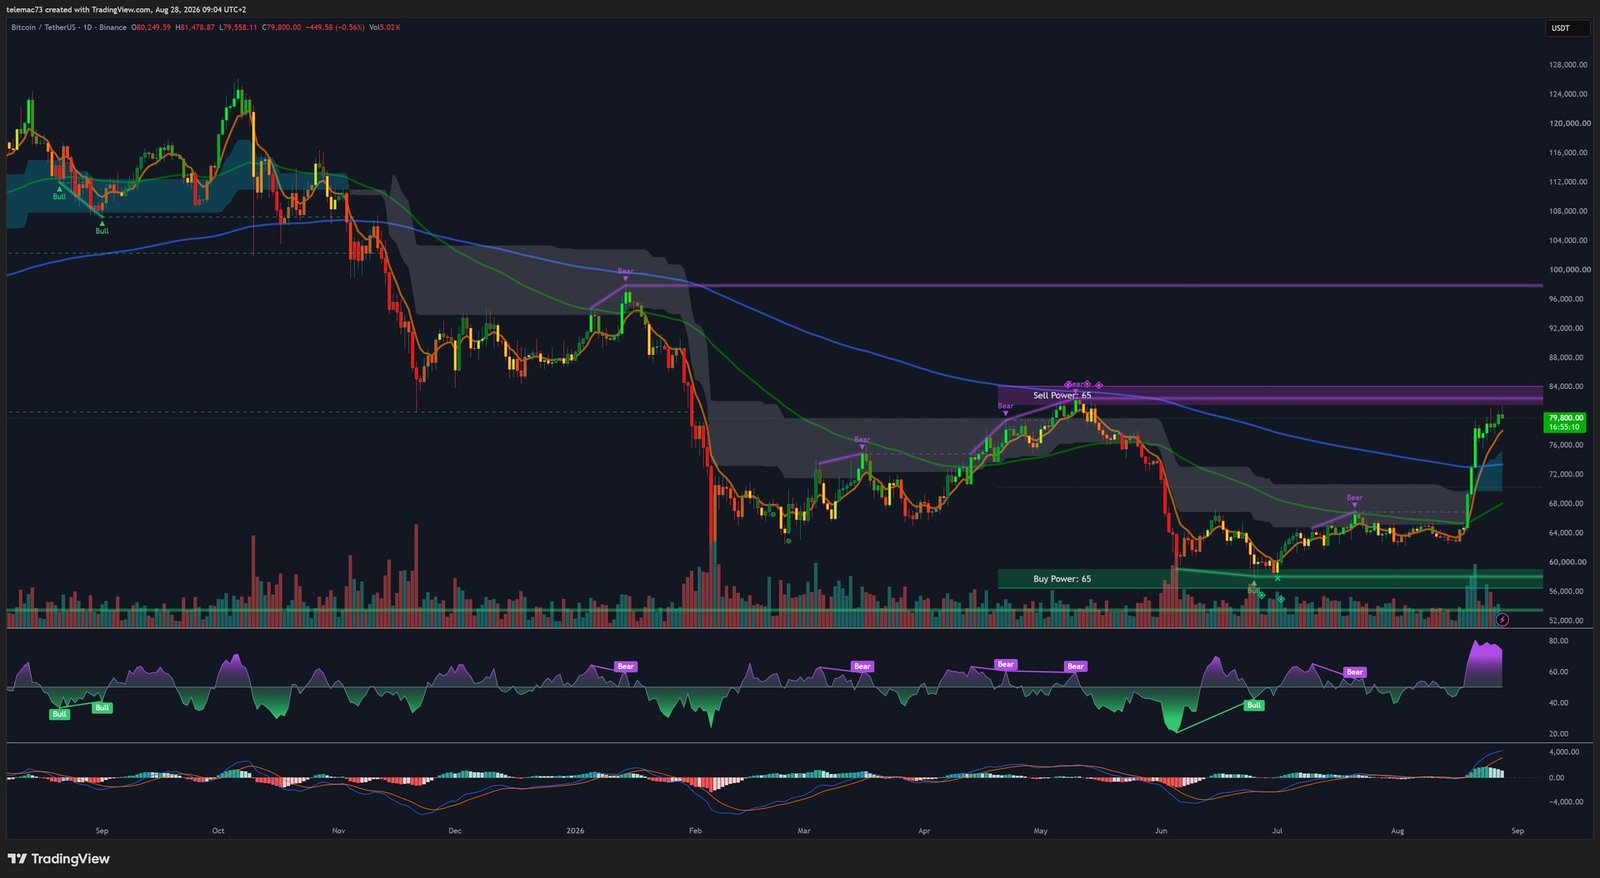
After a distribution phase that dragged price down toward lows near $53,000, Bitcoin launched a remarkably swift V-shaped recovery, reclaiming the 50- and 200-day exponential moving averages along the way. The dreaded “Death Cross” that loomed during the summer consolidation was invalidated, and the upward curl of the shorter-term moving averages is now paving the way for a potential “Golden Cross” — a long-term bullish signal widely tracked by quantitative trend-following models.
Power-zone mapping corroborates the heatmap reading: a major institutional support base sits around $58,000 (Buy Power zone), while the macro resistance target clusters near $83,000 (Sell Power zone), leaving the path technically clear up to that threshold. However, the daily RSI reads 78.85, deep in extreme overbought territory — a condition that rarely precedes a linear continuation without some form of digestion. The MACD remains constructive, with a strong bullish crossover, and Bollinger Bands show widening volatility, with price hugging the upper band around $78,598 against a mid-band at $67,471.
4-hour chart (4H): a bull flag under pressure
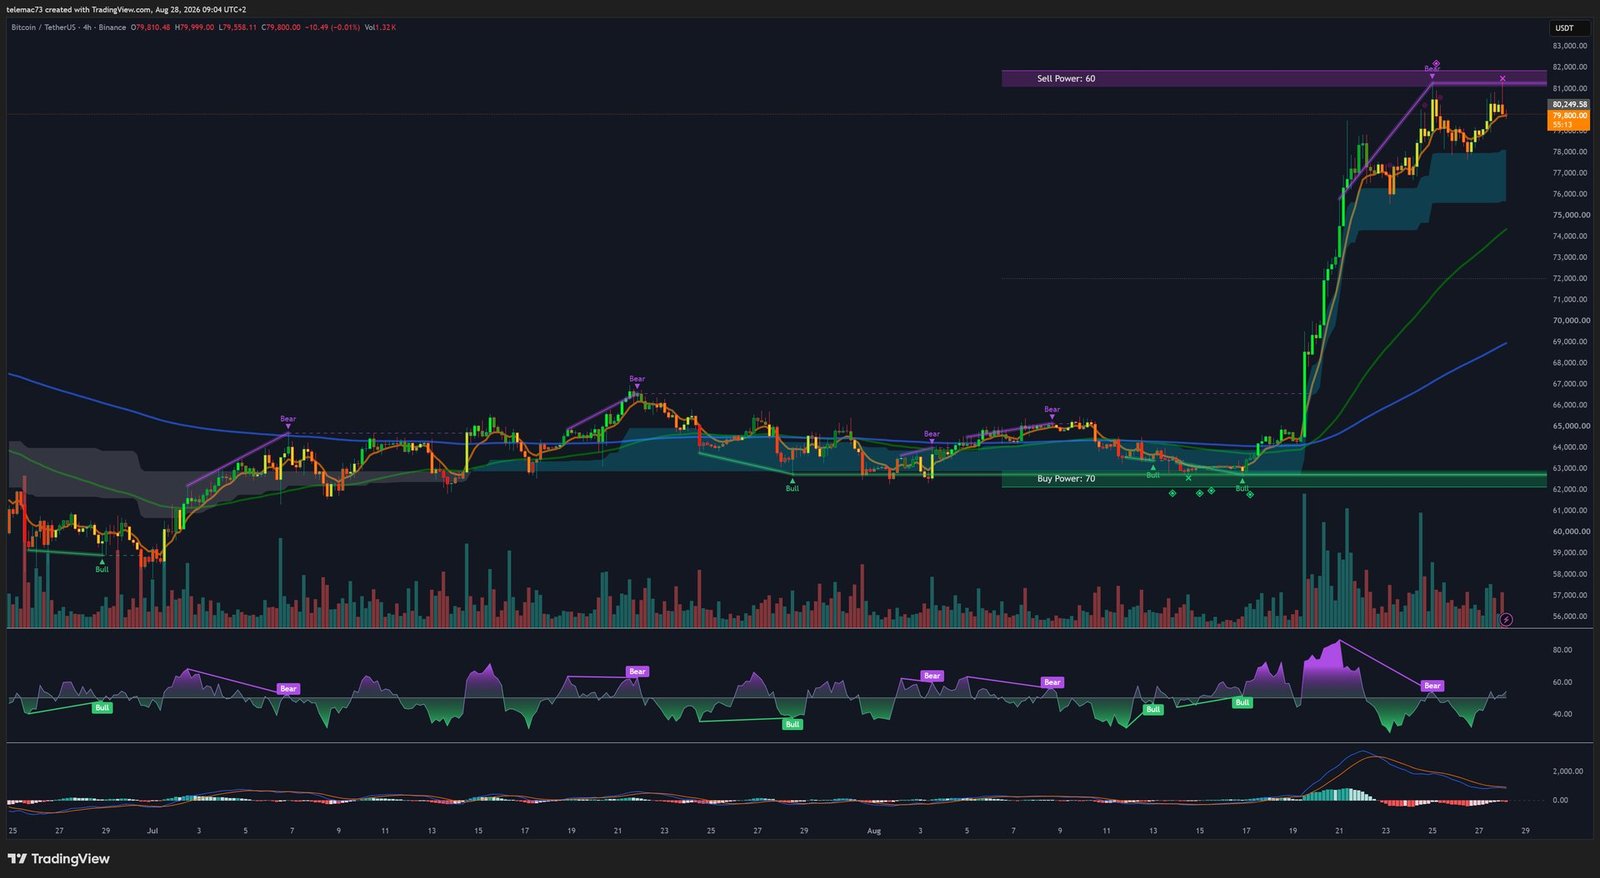
On the 4-hour timeframe, the impulsive move that launched Bitcoin from the $62,000 zone carved out a near-perfect vertical flagpole, followed by a sideways, slightly downward-drifting consolidation that forms a textbook bull flag. This pattern appearing at the top of such a powerful impulse speaks to genuine underlying strength: demand is methodically absorbing floating supply rather than giving way to panicked profit-taking. A confirmed breakout above the flag’s upper boundary would project a technical target beyond the macro resistance, potentially toward $90,000.
The oscillators, however, flag a divergence worth watching: the 4H MACD shows a declining line converging toward its signal, and the RSI has retraced to neutral territory (around 52). This cooling momentum suggests an external catalyst — chiefly the Jackson Hole speech — will be needed to reignite buying pressure. In the near term, a “Sell Power” band around $81,200 caps breakout attempts, while the first support sits near $77,500, in confluence with the 50-period EMA on lower timeframes.
15-minute chart (15M): the intraday trench war
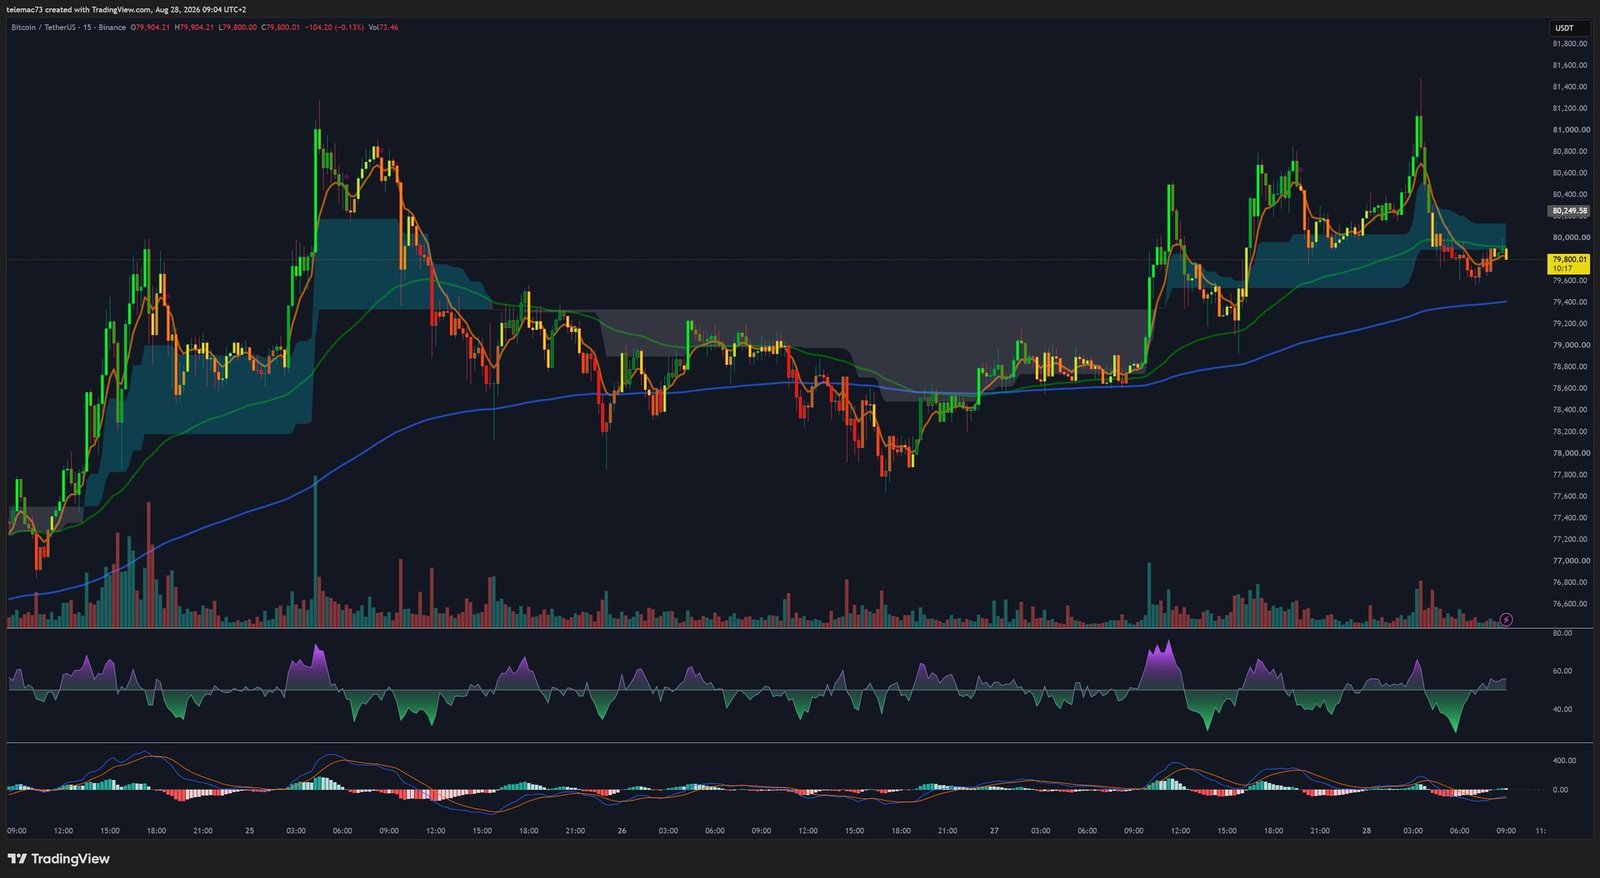
Over the past 48 hours, price action has carved out a symmetrical compression triangle: successively lower highs around $81,000 and successively higher lows around $78,500. This geometry reflects a near-perfect balance between supply and demand, coupled with a sharp contraction in volatility — a setup that historically behaves like a coiled spring ahead of a violent expansion in either direction. Intraday indicators confirm this indecision, with the RSI oscillating directionlessly around its midline and the MACD generating repeated whipsaws.
The pivot for this micro-structure sits around $79,800. A clean break below $79,000 would invalidate the intraday bullish structure and open the door to a test of the $77,500 support. Conversely, a push above $80,800 would signal a buyer victory and reignite the assault on the heatmap’s $81,500 resistance.
Synthesis and market scenarios
Current price action reflects a tug-of-war between the spot and derivatives markets. On one side, continuous accumulation through Spot ETFs pushes the asset higher and absorbs liquidations. On the other, the gravitational pull of the August 28 options expiry, with Max Pain sitting far below at $68,000, incentivizes market makers to erect sell walls to avoid a costly gamma squeeze on the heavy Call concentration around $80,000. That tension is precisely what has shaped the compression patterns visible on the 4H and 15M charts. Meanwhile, while a daily RSI near 79 warrants caution, the cleanup in open interest signals the market isn’t over-leveraged, limiting the risk of a cascading liquidation event should a correction unfold.
Primary scenario: bullish expansion post-Jackson Hole (estimated probability: 60%)
A measured or dovish tone from Kevin Warsh at Jackson Hole would reassure markets on the rate path, allowing the market to digest the options expiry smoothly. The 15M compression triangle and 4H bull flag would then resolve to the upside. A decisive break above the $81,500 liquidity resistance would trigger forced market-maker hedging (a gamma squeeze), rapidly pushing price toward the daily “Sell Power” zone between $83,000 and, if validated, fresh all-time highs.
Alternative scenario: technical correction and strategic retest (estimated probability: 40%)
A hawkish-leaning speech would reignite inflation fears, strengthen the dollar, and trigger a temporary liquidation of high-beta assets. Institutional sellers would fiercely defend the $81,500 wall, breaking the compression triangle to the downside. Bitcoin would then enter a mean-reversion phase to reset the daily RSI, testing immediate support at $77,500 and, if that gives way, the massive confluence zone between $71,500 and the historical Max Pain point. Such a correction, while sharp, would provide a healthy structural foundation for the market’s next bullish leg.
Disclaimer: this article was written for purely educational and informational purposes. It does not constitute investment advice, a recommendation to buy or sell, or an inducement to trade digital assets. Cryptocurrency markets are highly volatile and involve the risk of capital loss. Always do your own research (DYOR) and consult a qualified financial advisor before making any investment decision.

