


On August 20, 2026, Bitcoin (BTC) surged to the center of a major structural recalibration of the digital asset market, breaking through key resistance levels to trade in a range between $69,000 and $70,000. This bullish impulse, which generated a gain of more than 7.8% over 24 hours and pushed the network’s market capitalization above $1.39 trillion, cannot be interpreted through technical analysis alone: it fits within a deeply reshaped fundamental backdrop, following months of grinding consolidation after the all-time high above $126,000 reached in October 2025.
This analysis takes a top-down approach, combining macroeconomic flow analysis, order-book liquidity microstructure via the heatmap, and comprehensive technical modeling across multiple timeframes (daily, 4-hour, 15-minute) to map out the probable paths for Bitcoin in an increasingly complex market environment.

The Fundamental Backdrop: Treasury Liquidity and Regulatory Clarity
The US Treasury and Bond Yield Dynamics
The main exogenous driver behind this impulse is the US Treasury Department’s decision to intensify its liquidity injection operations, doubling the scale of its long-dated bond buybacks from $2 billion to $4 billion. This mechanism triggered a jump in bond prices and a corresponding drop in long-term yields: the 30-year yield retreated to around 5.193%, fundamentally shifting the asset-allocation equation for institutional portfolio managers.
The inverse correlation between bond yields and non-yielding assets (gold, silver, Bitcoin) manifested immediately. As real rates fall, the opportunity cost of holding fixed-supply assets drops sharply, reviving the “monetary debasement” trade and channeling capital toward high-convexity hedge assets. Bitcoin, with its inelastic, disinflationary monetary policy reinforced by the April 2024 halving, captured a meaningful share of these flows.
The SEC’s Regulatory Framework and the End of Legal Ambiguity
In parallel, the Securities and Exchange Commission unveiled a proposal for an innovative regulatory framework, creating a clear pathway for mature blockchain networks to shed the restrictive “securities” classification. This announcement lifts a legal overhang that had weighed on the industry for years and acts as a powerful confidence catalyst for institutional capital bound by strict compliance mandates.
The SEC’s progress, combined with the Senate’s preparations on the CLARITY Act and the OCC’s efforts to finalize stablecoin rules via the GENIUS Act, signals the definitive institutional integration of digital assets. These developments triggered a forced liquidation of nearly $2 billion in derivatives positions within 24 hours — a short squeeze that largely explains the vertical nature of the recent price action.
Institutional Flows and the On-Chain Supply Shock
After a period of intense selling pressure — worsened earlier in the summer by the German government’s liquidation of more than $900 million in BTC, which dragged the price below $58,000 — large holders (“whales”) have massively re-entered the market. Over the 60 days preceding mid-August, this cohort accumulated roughly 43,000 BTC net, representing an estimated $2.75 billion inflow, mostly while the asset traded around $60,000.
This quiet but aggressive accumulation is corroborated by recent regulatory disclosures, such as quantitative trading firm Jane Street’s near-billion-dollar stake in spot Bitcoin ETFs, and the addition of 2,380 BTC to the treasury of a Chinese InsurTech company. On-chain accumulation has progressively drained the floating supply available on exchanges, producing an asymmetric, upward-skewed price discovery once demand suddenly surged.
| Macro Catalyst | Mechanical Impact | Effect on BTC Price |
|---|---|---|
| US Treasury buybacks ($4B) | Lower long-term yields (30Y at 5.193%) | Capital rotation into gold and BTC |
| SEC regulatory framework | Legal clarity, “security” exemption | Institutional inflows, short liquidations ($2B) |
| On-chain accumulation (whales) | Absorption of 43,000 BTC (~$2.75B) | Latent supply shock, structural floor |
Market Microstructure: What the Order-Book Heatmap Reveals
Studying the order-book heatmap provides a three-dimensional map (price, volume, time) of latent liquidity and reveals the intentions of market-making algorithms. At the time of observation, spot price is trading around $69,593.
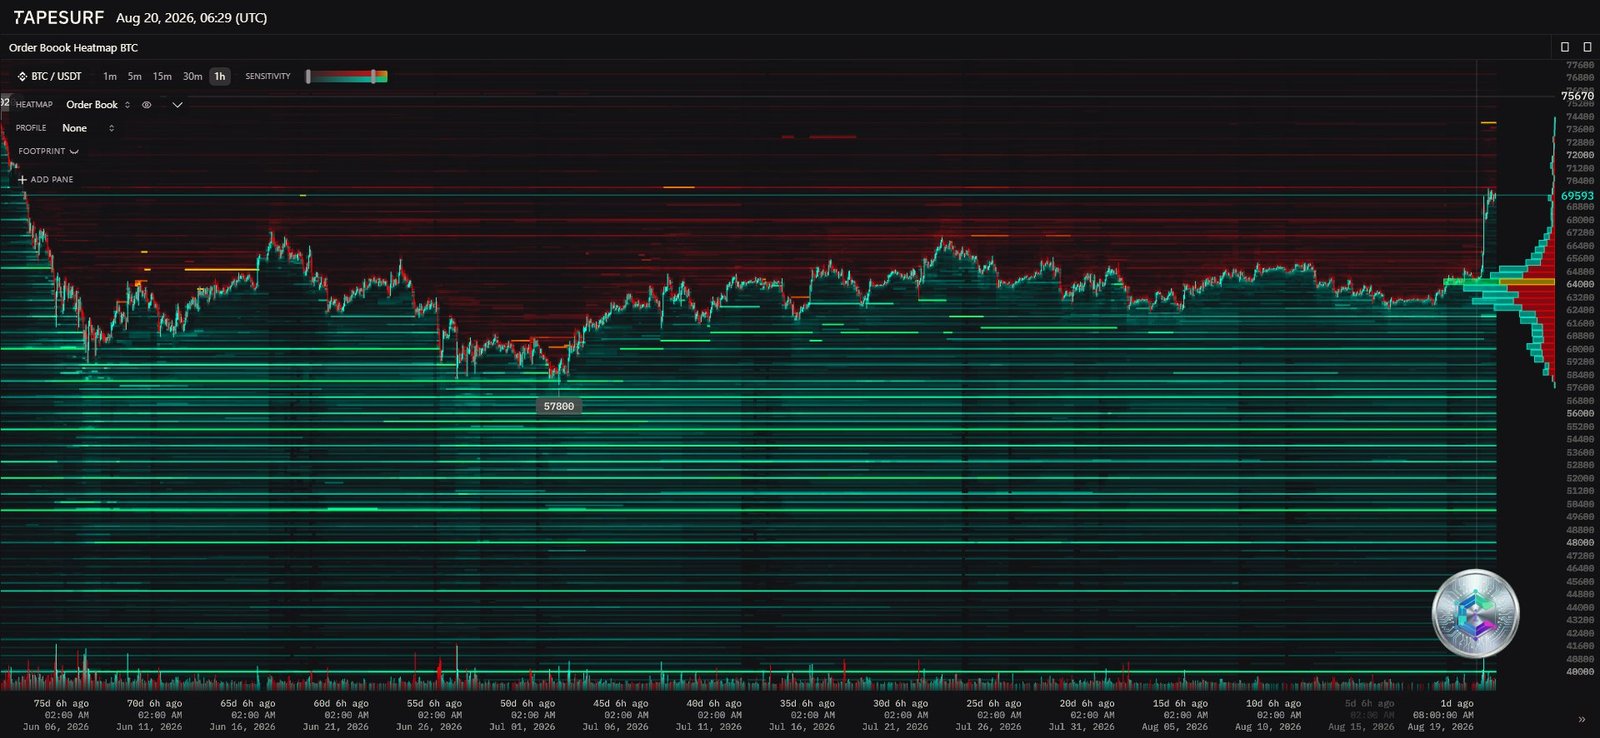
The $70,000 Sell Wall
The most striking anomaly revealed by the heatmap is a dense block of sell-side liquidity that intensifies as price approaches the psychological $70,000 threshold. This zone represents a genuine institutional sell wall: many participants have placed limit orders to unload accumulated positions or to open short positions in anticipation of a historic top.
Breaking through this wall will require more than a simple short squeeze — it will take sustained, organic spot demand capable of consuming the entire accumulated supply. If the $70,000 level is tagged without robust volume to consolidate the advance, the market is exposed to a liquidity retracement risk.
The Support Pillars
Deeper down, the heatmap reveals a structured distribution of buy-side liquidity, with a major historical Point of Control (POC) between $64,800 and $65,400. An extreme concentration of buy orders is also visible around $62,000, extending down to the $57,800 trough tested during the German government sales. In case of rejection at $70,000, price would therefore work through successive absorption layers rather than free-falling.
Multi-Timeframe Technical Analysis
The Daily Timeframe: Macro Awakening and Momentum Expansion
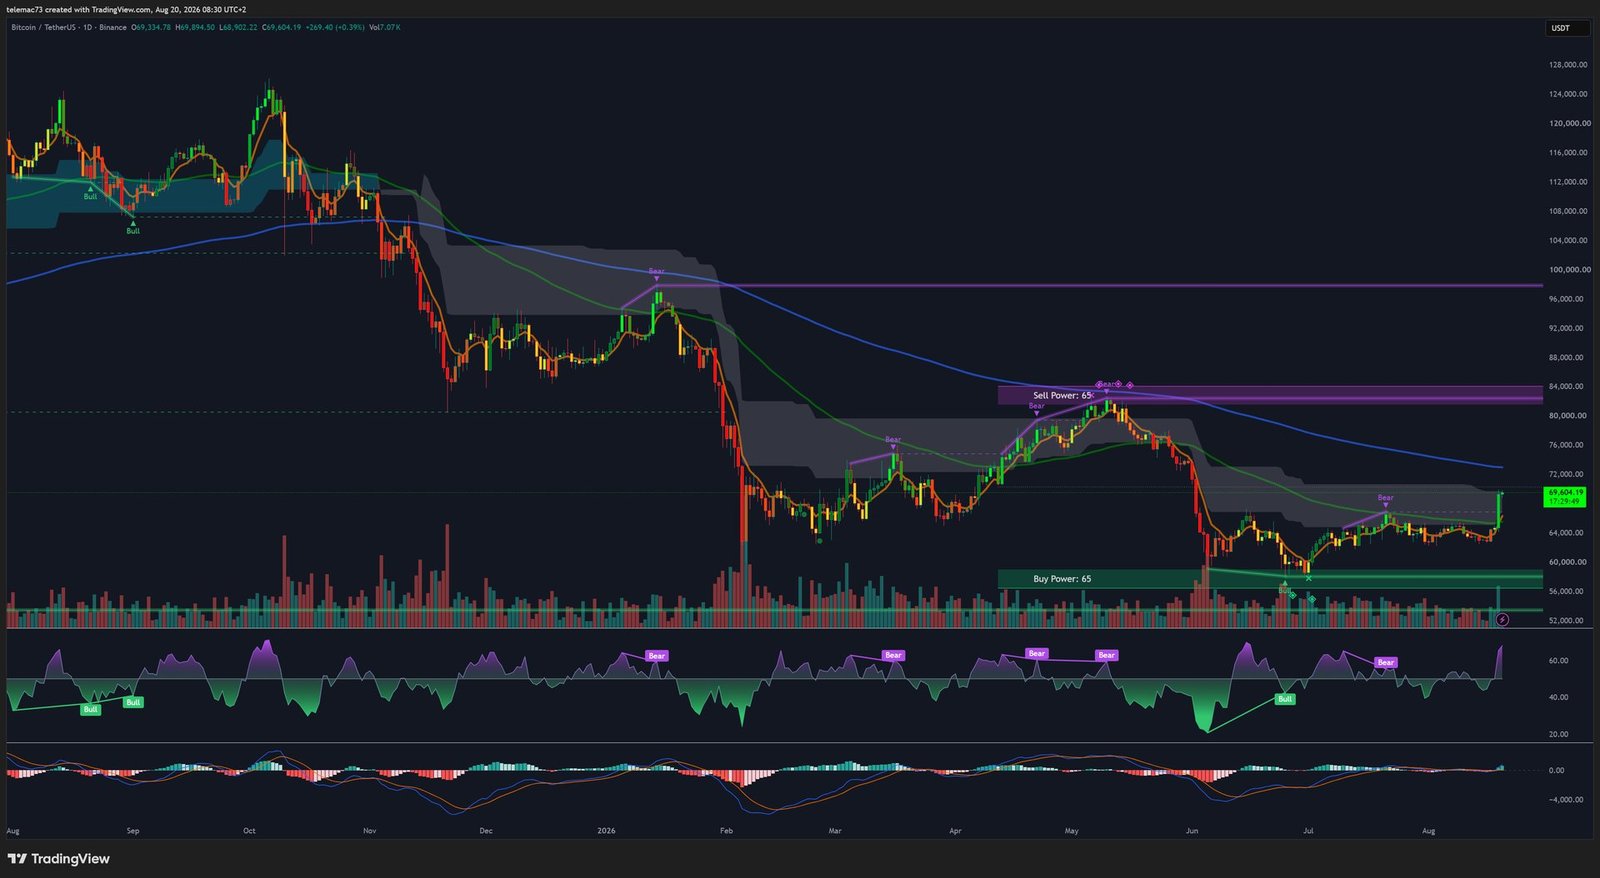
The daily candle closing this impulse is a massive marubozu, marking a decisive breakout. Price extracted itself above August’s trading range (top at $65,416), at the expense of the strong demand zone between $56,000 and $60,000, pushing BTC to its highest levels since June.
- Moving averages: price has convincingly cleared the 100-day MA; the 200-day MA, reclaimed after 233 days below it — the 4th-longest such stretch in 12 years — now acts as a magnet toward $76,450.
- MACD: a Golden Cross has formed on the daily timeframe, with a widening histogram confirming accelerating buying pressure.
- RSI: a clean pivot from neutral levels, crossing above 50 to settle beyond 60 — without reaching extreme overbought territory (>80), leaving room to run.
The 4-Hour Timeframe: Hyper-Extension and Short Squeeze
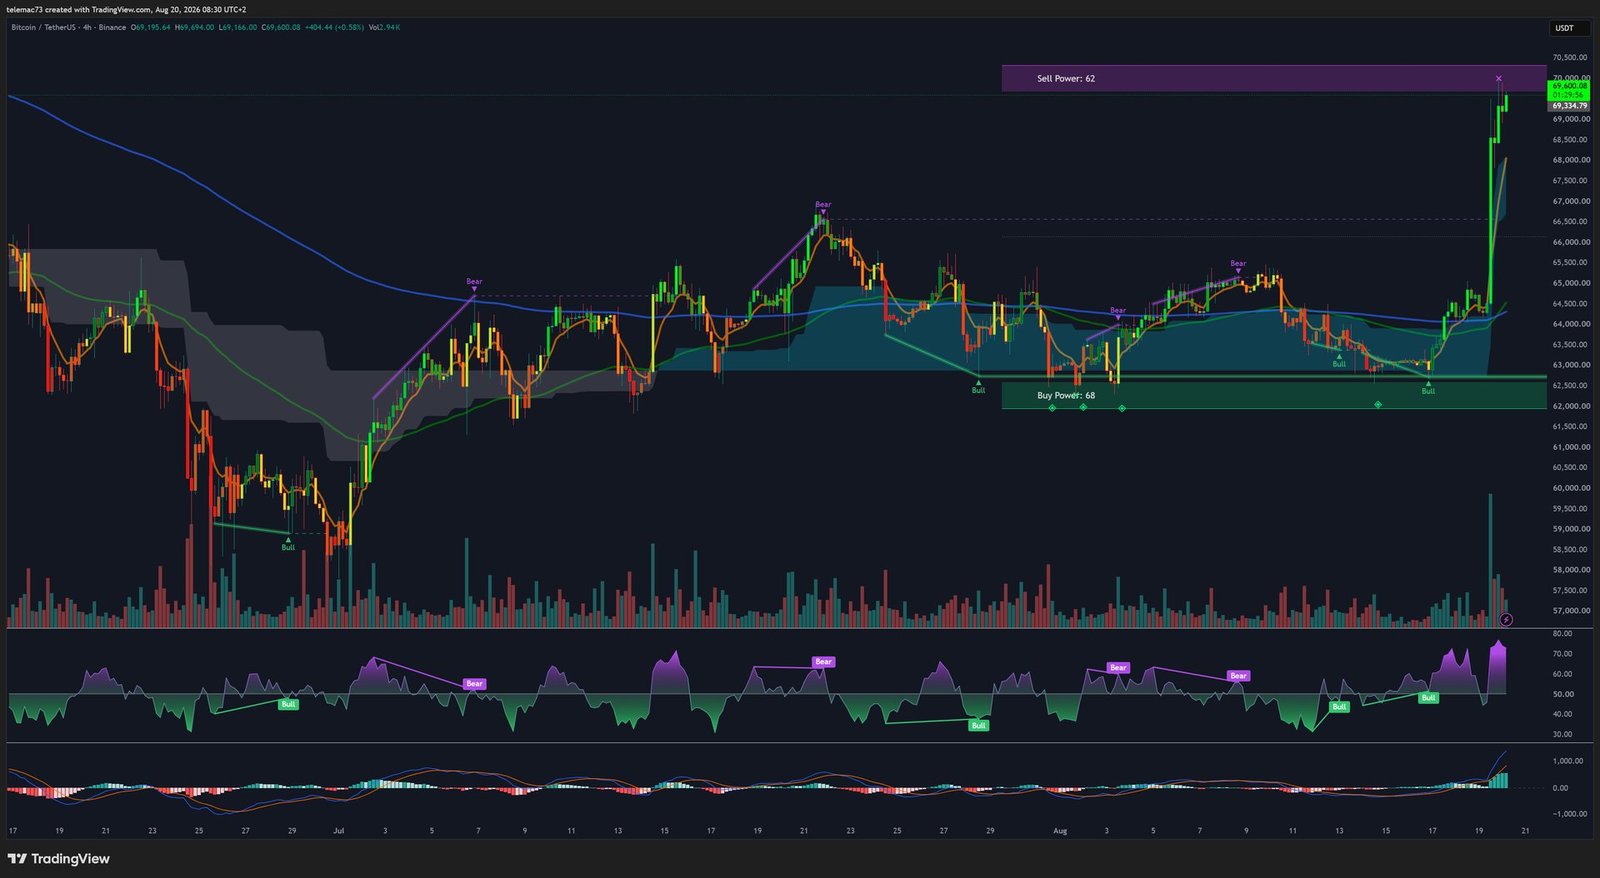
Ahead of the breakout, price had carved out a classic reversal pattern (asymmetric double bottom). The trigger level around $66,600 was pulverized, producing a parabolic expansion candle on exceptionally high volume, validating the institutional legitimacy of the move.
- RSI: pushed into extreme overbought territory (near or above 85), a symptom of market overextension calling for consolidation.
- MACD: a wide bullish cross with no sign of a Death Cross, confirming that selling pressure remains contained below $70,000.
The 15-Minute Timeframe: Micro-Compression and Warning Signals
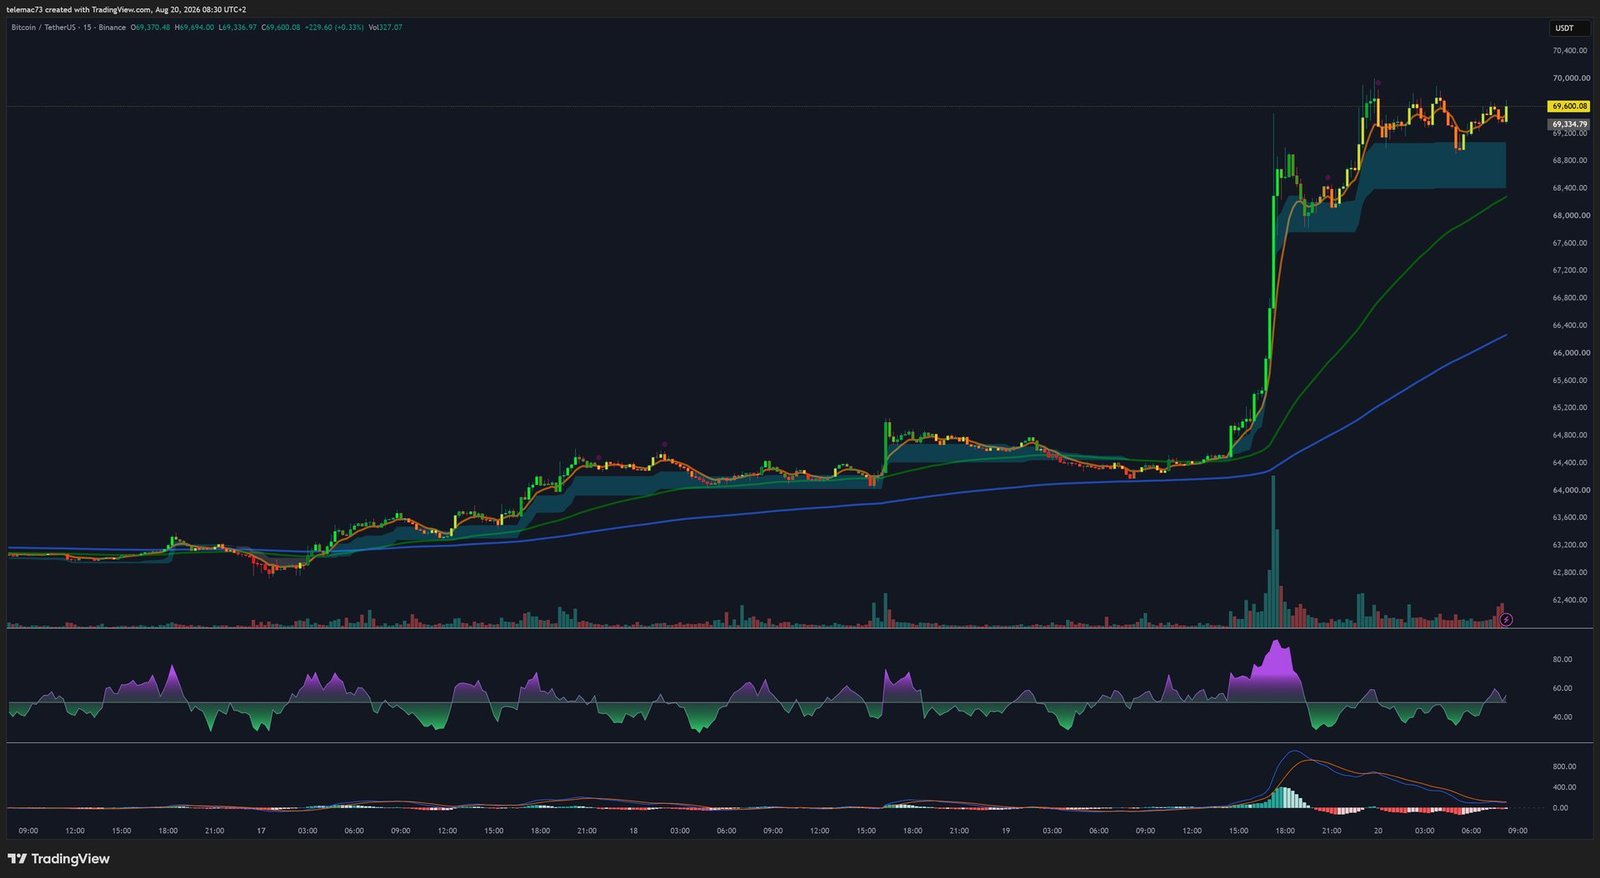
Following the vertical move, buying frenzy hit the lower edge of the institutional sell wall. Price is now forming a Bull Flag or compression triangle, between roughly $69,200 and $69,600 — a volatility squeeze that typically precedes a fresh directional expansion.
- RSI bearish divergence: local price highs are not confirmed by the RSI, which is printing lower highs — a sign of fading short-term momentum.
- MACD Death Cross (15m): confirms a heightened probability of consolidation or a mild intraday pullback, without invalidating the macro bullish trend.
- Moving-average support: the 20 and 50 EMAs are rising to meet price, preserving the bullish bias as long as they hold.
Key Levels: Supports, Resistances and Pivots
| Level | Price (USD) | Strength |
|---|---|---|
| Macro Resistance (R3) | $84,000 | Medium (long term) |
| Structural Resistance (R2) | $71,400 – $76,159 | Strong |
| Critical Resistance (R1) | $70,000 | Very strong |
| Intraday Pivot (P) | $69,300 | Weak |
| Minor Support (S1) | $67,000 | Strong |
| Major Support (S2) | $65,400 | Very strong |
| Structural Support (S3) | $62,500 – $62,800 | Strong |
| Macro Floor | $56,000 – $60,000 | Absolute |
Two Scenarios for the Sessions Ahead
Alpha Scenario — Bullish Breakout and Expansion
If macro liquidity keeps flowing, the 15m Bull Flag would resolve to the upside. A daily close above $70,500 would massively activate trend-following algorithms, initially targeting the Fibonacci extension at $71,400, then the 200-day MA convergence toward $76,000. Longer term, this move would validate fundamental targets as high as $150,000 by the end of 2026.
Beta Scenario — Liquidity Retracement and Mean Reversion
The main risk lies in overheated oscillators and the “air gaps” left behind by the short squeeze. A failure at the $70,000 wall would trigger aggressive profit-taking, first testing support at $67,000, then the massive POC around $65,400. Holding firmly above $65,416 is an absolute requirement; a lower close would invalidate the August breakout thesis and open the path toward $62,000.
Summary and Strategic Conclusion
The Bitcoin market currently sits at the epicenter of an exceptional alignment of forces: US Treasury debt buybacks, a regulatory thaw orchestrated by the SEC, and large-scale on-chain accumulation by institutions above $60,000. The daily Golden Cross provides a resilient structural foundation for the macro bullish trend.
That said, overheated oscillators on intermediate timeframes and emerging intraday bearish divergences point to a natural kinetic exhaustion at the historic $70,000 wall. The challenge for the coming sessions won’t simply be reaching new highs, but demonstrating the market’s ability to absorb massive supply organically. Holding consolidated price action above $65,400 would be the clearest proof that smart money has firmly retaken control of market direction.
Disclaimer: this article is published for educational and informational purposes only. It does not constitute investment advice, a recommendation to buy or sell, or a solicitation to trade digital assets. Cryptocurrency markets are highly volatile and carry significant risk of capital loss. Always do your own research (DYOR) and consult a licensed financial advisor before making any investment decision.

