


Bitcoin is currently trading around $63,592, caught in a tight vice between a formidable institutional sell wall and aggressive accumulation by large holders. Between conflicting macro signals, erratic ETF flows and a tense order book, our multi-dimensional analysis breaks down the forces at play and the scenarios worth watching in the days ahead.

A macroeconomic backdrop under strain
No analysis of Bitcoin’s microstructure is complete without its macroeconomic context. Digital assets have shown heightened sensitivity to global monetary policy, and the market is currently navigating a period of elevated implied volatility fueled by conflicting signals from central banks.
On one hand, remarks from the Jackson Hole economic symposium initially hinted at an accommodative stance, with futures markets pricing in as much as 100 basis points of cumulative rate cuts across upcoming FOMC meetings. Historically, such an easing scenario has favored risk assets: Bitcoin tends to outperform when U.S. Treasury yields fall and the dollar (DXY) weakens, acting as an alternative monetary system.
On the other hand, this narrative was sharply challenged by a markedly more restrictive reassessment of Federal Reserve policy. Persistent inflation and hotter-than-expected producer price data reignited inflationary fears, with some institutional models assigning up to a 90% probability of an additional rate hike before year-end.
This dichotomy between rate-cut expectations and sudden tightening fears triggered a shock across both traditional and digital markets, with the CBOE Volatility Index (VIX) spiking above 65%. Bitcoin, despite pulling back roughly 8.5% during these stress phases, showed relatively stronger resilience than Ethereum, which suffered corrections exceeding 21% over comparable periods — a sign of capital rotating toward the ecosystem’s perceived safest liquidity.
| Macro indicator | Status / estimated probability | Theoretical impact on BTC |
|---|---|---|
| Rate-cut expectation (25 bps) | ~80% per post-Jackson Hole models | Positive (weaker DXY, higher liquidity) |
| Rate-hike expectation | ~90% per alternative hawkish models | Negative (higher bond yields) |
| Volatility Index (VIX) | Recent spikes > 65% | Short-term inverse correlation, flight to liquidity |
| Consumer Price Index (CPI) | Awaiting confirmed inflection | Extreme intraday price sensitivity |
Structurally, Bitcoin’s valuation tends to rise mechanically as real interest rates move toward or into negative territory: investors seek to hedge against monetary erosion by allocating capital into inelastic stores of value. Persistent regulatory uncertainty, compounded by the cancellation of key meetings meant to clarify the crypto rulebook, nonetheless keeps the market in a nervous holding pattern, limiting institutional risk appetite.
Institutional flows: “mercenary” capital versus accumulating whales
The rise of regulated investment vehicles has fundamentally reshaped the topology of capital flows. Spot Bitcoin ETF inflows and outflows offer a precise read on institutional sentiment: these funds, nearing $18 billion in cumulative net inflows since launch, act as genuine volatility amplifiers during macro paradigm shifts.
The cyclicality of these flows reveals a reactive, almost emotional behavior from traditional finance. During phases of macro relief, the market recorded spectacular weekly inflows totaling $1.1 billion across combined Bitcoin and Ethereum ETFs — a record since spring. Specific days aligned with dovish-perceived remarks generated daily inflows ranging from $158 million to $252 million.
Yet this institutional capital remains “mercenary.” At the slightest sign of persistent monetary tightening, withdrawals occur at an alarming pace: the market recently absorbed massive daily net outflows of $523 million for Bitcoin alone, culminating in a devastating weekly withdrawal of $1.17 billion — the second-largest such outflow in these products’ history. These outflows exacerbate spot selling pressure and neutralize bullish breakout attempts.
Paradoxically, this institutional distribution is being meticulously absorbed by the ecosystem’s native players. On-chain data shows that large wallets (“whales” holding more than 1,000 BTC) are using these dips to intensify accumulation, now controlling more than 7.17 million bitcoins. Meanwhile, aggressive corporate treasuries continue their strategic buying, with some reserves surpassing 632,000 BTC. Combined, institutional and corporate treasuries now hold more than 2% of circulating supply, meaningfully draining available exchange liquidity and setting the stage for potential supply shocks.
Reading the order book: what the heatmap reveals
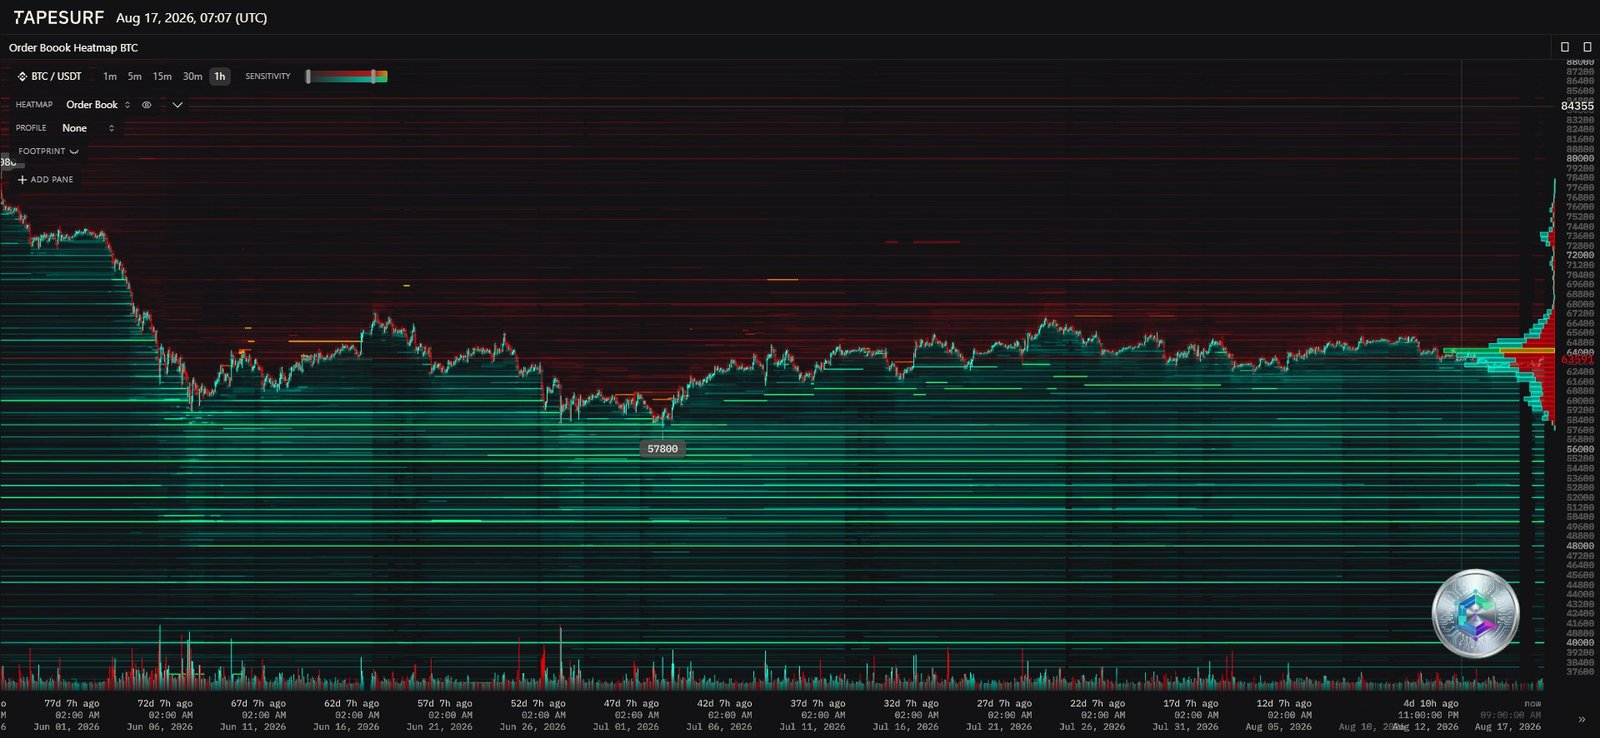
Conventional technical analysis remains incomplete unless corroborated by the reality of the order book. The heatmap offers a view of passive liquidity through time, allowing precise identification of institutional interest zones.
The upper part of the book is dominated by thick, persistent layers of limit sell orders extending from $64,000 — a massive “Sell Power” zone where supply structurally exceeds demand. Every bullish push crashes against this friction, explaining the labored nature of recent rallies. The prolonged inability to break this wall suggests institutional players are using bounces to distribute holdings or initiate short hedges.
Conversely, the lower half of the book reveals a defensive mesh of buy orders. A first line of defense sits around $62,400, acting as a floor that absorbs the impact of liquidations and panic selling. Further down, emergency liquidity blocks appear near $57,800: should the $62,400 support give way, the market could seek to sweep this deep liquidity, triggering a “liquidity sweep.” The persistence of blocks near $64,500 over time also suggests genuine capital commitment rather than mere spoofing.
Multi-timeframe reading: from daily to 15-minute
Daily structure (D1): consolidation within a compression channel
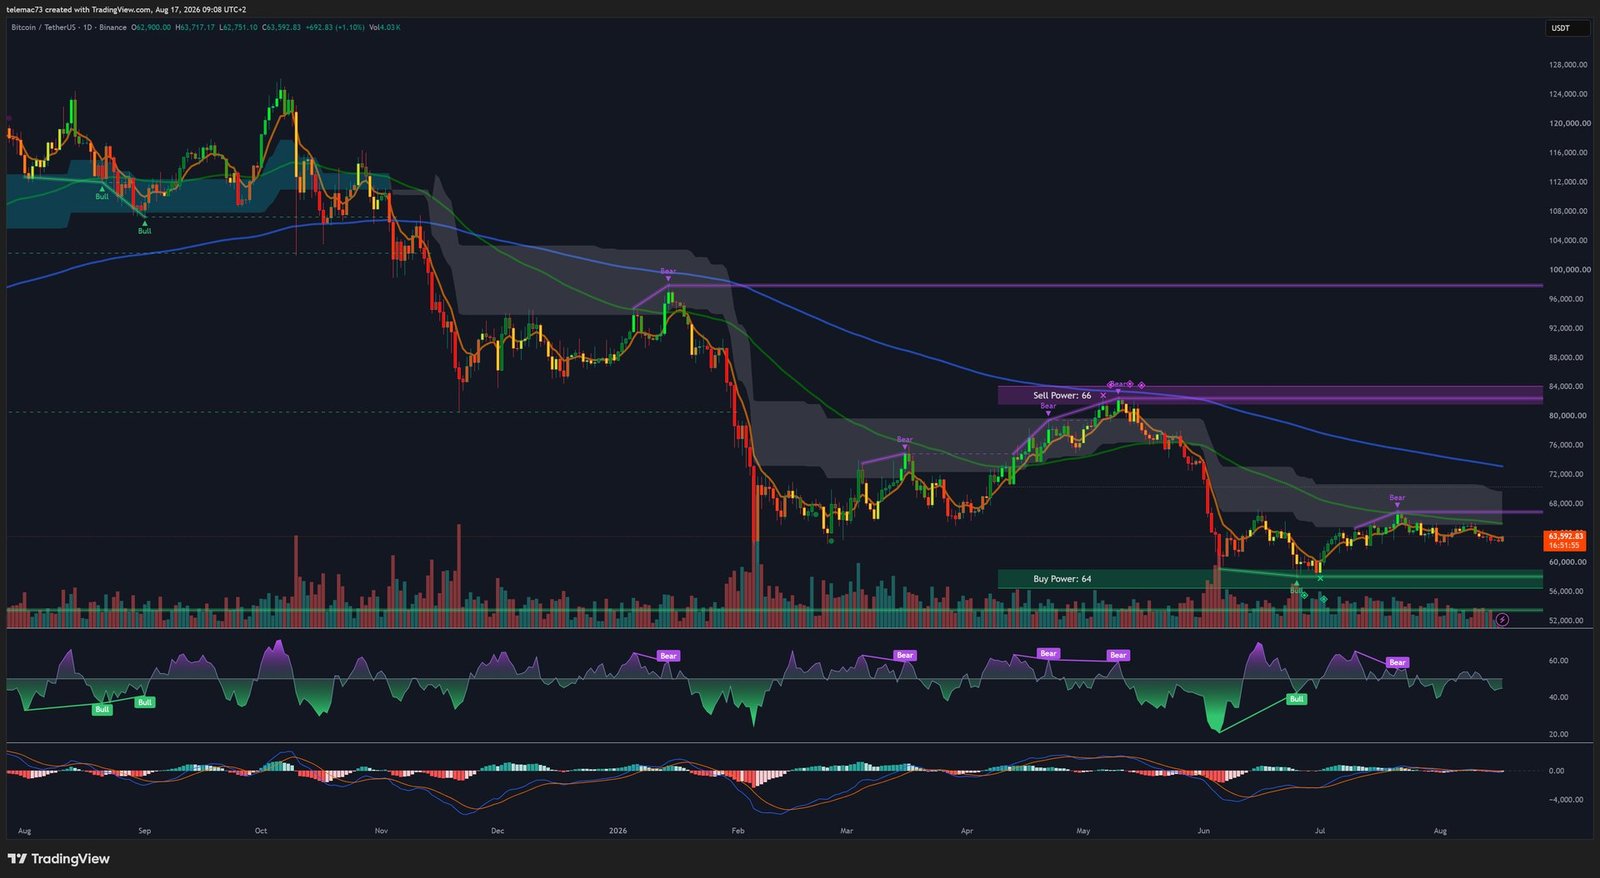
On the daily timeframe, Bitcoin is trading within a broad distribution and consolidation phase, marked by a sequence of lower highs forming a wide expanding wedge or macro compression channel — a sign of persistent indecision as the market searches for fair value.
The primary resistance zone sits around $64,000, in close confluence with the sell-liquidity wall identified on the heatmap. On a bearish break, the immediate critical support lies in the $62,000 band, followed by heavy buy zones between $56,000. Some long-term structural models project an absolute backstop support near $100,000 under exponential growth scenarios, with projected resistances gravitating toward $121,700 over extended cycles — levels that belong to a forward-looking horizon but underscore the long-term channel’s structurally upward trajectory.
Long exponential moving averages (50 to 200 periods) retain a positive slope, and the absence of a “Death Cross” on these major horizons undermines the systemic bear-market thesis, instead pointing to a healthy correction within a broader bull cycle. The MACD paints a neutral-to-slightly-bearish picture, while the RSI, without reaching extreme readings, forms a subtle hidden divergence: its troughs are structurally higher even as price struggles to set new highs — a sign of latent accumulating momentum.
4-hour setup (H4): compression triangle
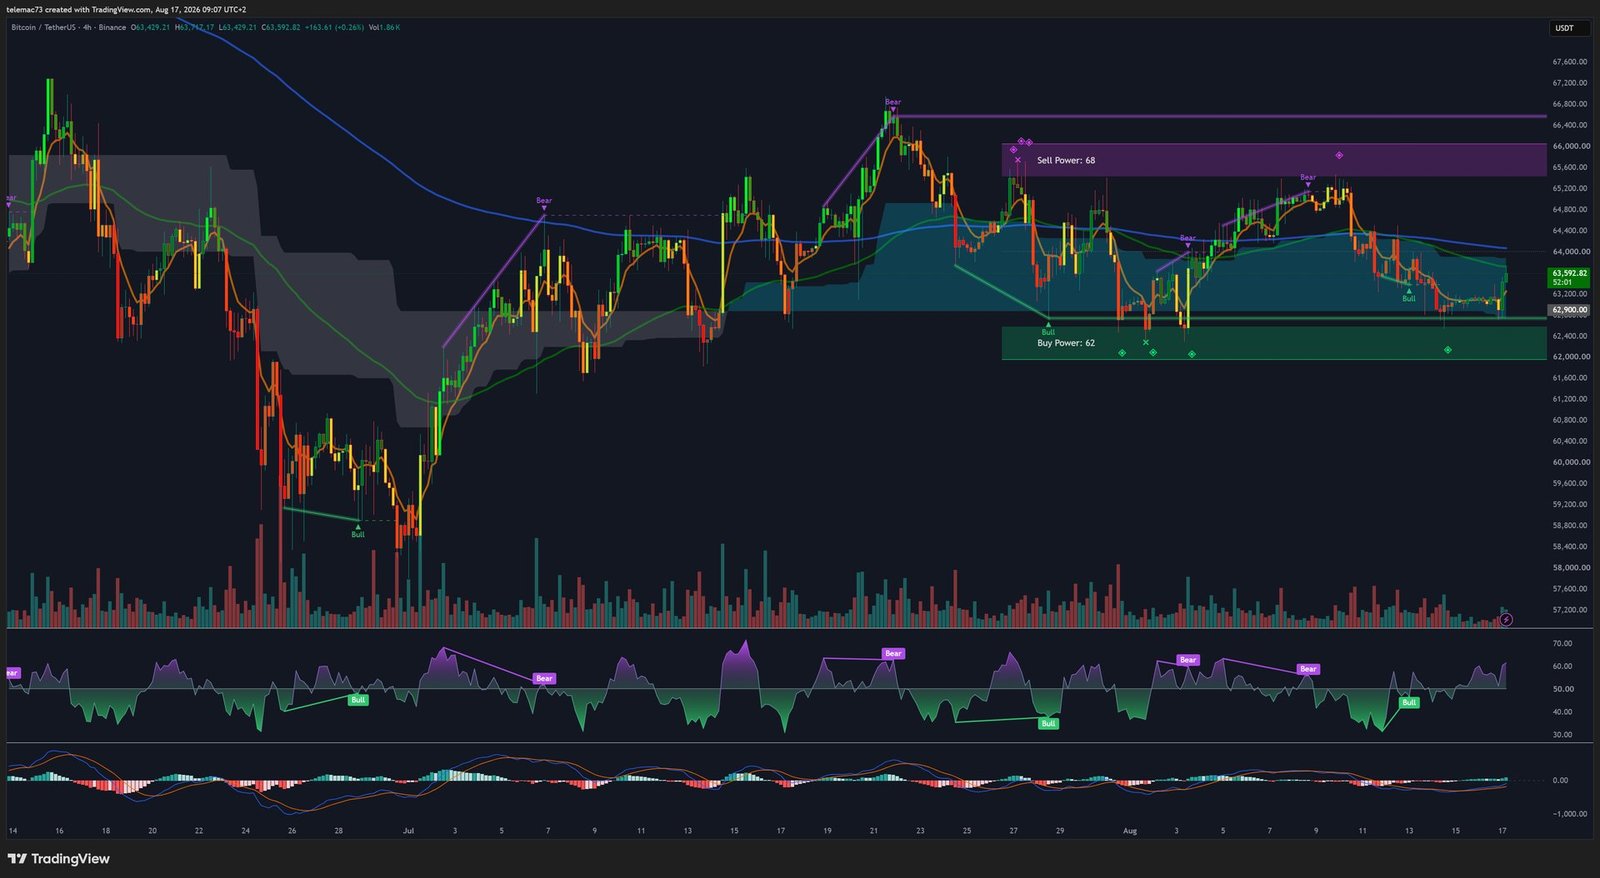
The 4-hour chart highlights a classic continuation pattern: a massive bull flag or an asymmetric compression triangle, bounded by a descending upper trendline and a resilient horizontal support zone.
The current $63,592 level sits precisely between a “Buy Power” block ($62,400) and a “Sell Power” block ($64,000). This mid-range zone is notoriously tricky for initiating major directional positions, as the risk/reward ratio is symmetrically unfavorable. Recent consolidation shows that failure to break $64,000 triggers an immediate pullback to $62,400, creating the choppy trading environment typical of uncertainty phases.
| H4 technical component | Current state / location | Interpretation |
|---|---|---|
| Geometric pattern | Compression triangle / bull flag | Volatility contraction, breakout imminent |
| Key resistance (Sell Power) | $64,000 | Institutional distribution zone, high rejection probability |
| Key support (Buy Power) | $62,400 | Accumulation zone, shield against cascading liquidations |
| MACD (momentum) | Erratic crossovers near zero | Directional indecision, no dominant trend flow |
15-minute execution (M15): bullish spike and RSI overheating
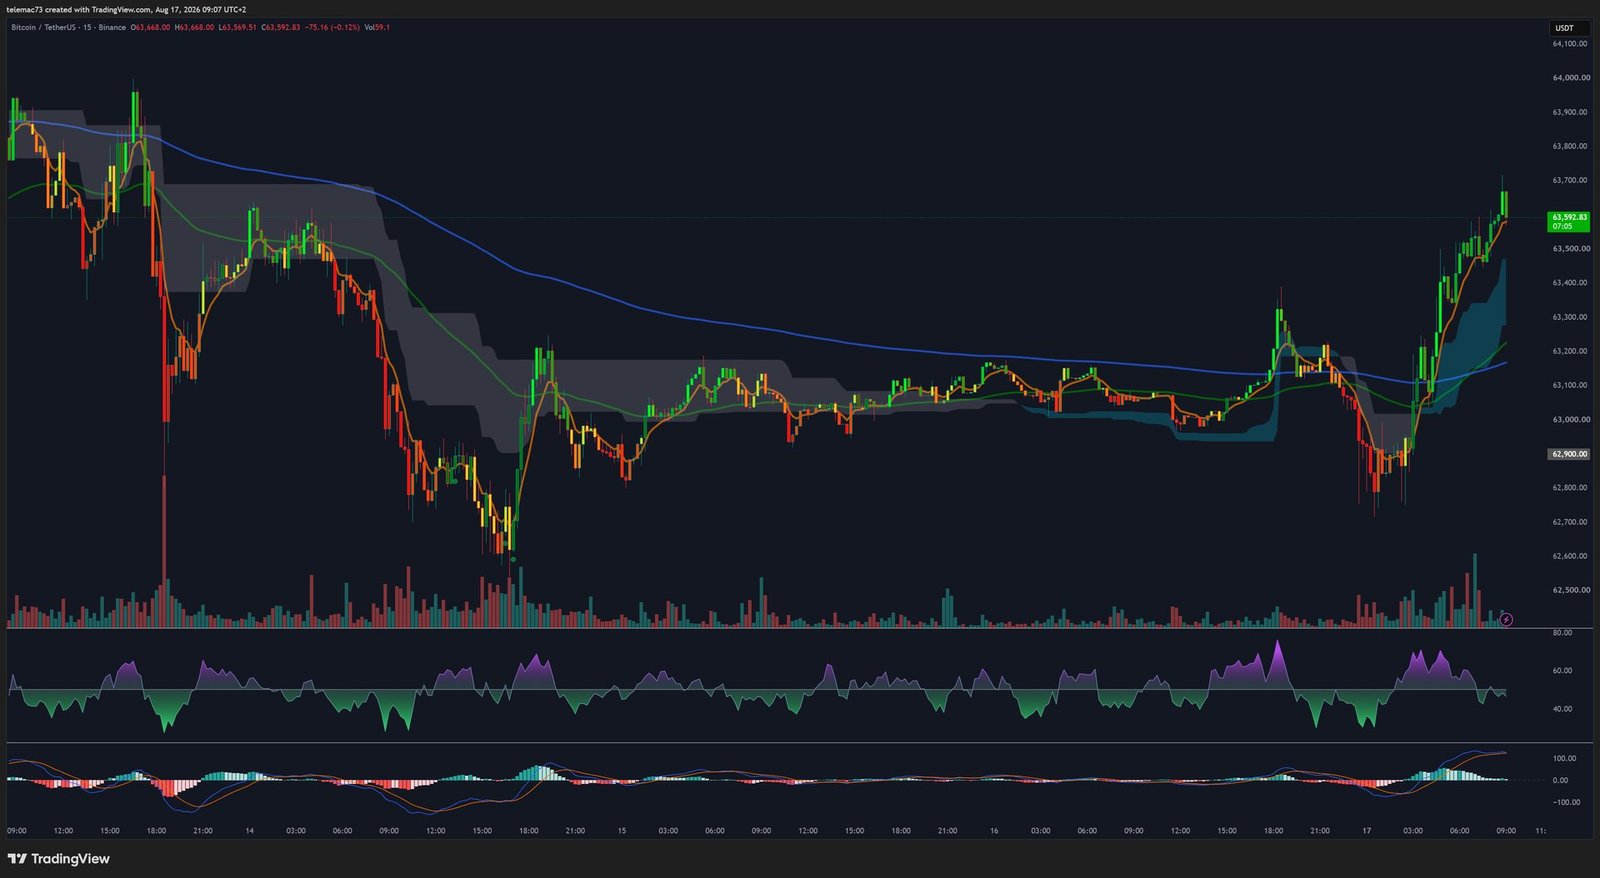
On the shortest timeframe, recent price action shows a sudden bullish impulse, pushing prices from local lows to brush against the $63,600 zone, accompanied by a clean “Golden Cross” between the fast and slow moving averages — confirming that intraday control has shifted to buyers.
This vertical acceleration, however, carries the seeds of its own correction: the RSI has been pushed to elevated readings, moving deep into overbought territory. Such overextension typically triggers algorithmic mean-reversion strategies, making a sideways consolidation phase or a minor pullback likely before any renewed attack on the $64,000 sell wall.
Given the high leverage characteristic of crypto derivatives markets, sudden flash crashes can instantly wipe out hundreds of millions of dollars in over-exposed long positions, a reminder that even robust supports can be transiently pierced during systemic deleveraging events. Wick analysis within the $62,400 zone nonetheless confirms that aggressive buyers step in to absorb these liquidations and restore balance.
Strategic synthesis: two scenarios on the table
Bitcoin currently sits at a critical intersection between a robust macro-structural support and an implacable institutional resistance, effectively trapped between whale appetite accumulating in discount zones ($62,000) and traditional capital’s anxiety as it unloads via ETFs near resistance ($64,000).
Bullish scenario: if inflation data cools decisively and the Federal Reserve firmly confirms its easing trajectory, institutional capital could flow back massively into ETFs. Once the $65,500 zone is absorbed and the upper pivot breaks, the liquidity void above could trigger a directional squeeze, propelling price discovery to new levels, supported by upward-sloping daily moving averages.
Bearish scenario: if dissent among monetary authorities persists and validates a prolonged restrictive rate environment, ETF selling pressure could overwhelm native liquidity absorption capacity. Repeated failure to validate a sustained “Golden Cross” on higher timeframes, combined with a hidden bearish divergence, could exhaust buyers and break the $62,400 heatmap support, opening the path toward the deep structured liquidity between $56,000.
Against this backdrop, an asymmetric, reactive rather than predictive risk-management approach remains warranted, with close monitoring of the order book to anticipate the moment one of these liquidity poles finally gives way.
Disclaimer: this article is published for purely educational and informational purposes. It does not constitute investment advice, a recommendation to buy or sell, or a solicitation to carry out any transaction. Cryptocurrency markets are highly volatile and carry significant risk of capital loss. Always do your own research (DYOR) and consult a licensed financial advisor before making any investment decision.

