


Bitcoin trades near $80,383 after a rebound of roughly 6.2% from the recent low of $75,690 printed on November 4 on the H4 chart. The price still sits about 8% below the period high of $87,385 reached on September 21, and it is recovering from the October 29 sell-off triggered by the Binance hack. The global bias is neutral, with low conviction and a confluence score of 2/5: the Daily remains under pressure while the H4 and M15 are turning higher.
The dominant event remains the Binance hack, which Cointelegraph describes as a record $6.3B theft (November 4). According to CryptoQuant (October 30), 18,279 BTC, roughly $1.4B, left exchanges, the Coinbase Premium fell to -0.27%, its lowest since November 2022, and implied volatility (DVOL) climbed to 42, its highest since August. Short-term holders sent coins to exchanges at a loss for the first time in 72 days. ETF flows weigh on the rebound: according to Farside (date not specified), US spot Bitcoin ETFs logged net outflows of $643M on October 30, $399M on November 2 and $116M on November 3. On the Ether side, Crypto Briefing (November 5) reports a $53M inflow on November 4, after roughly $515M of outflows the week before.
The November 4 bounce, which Bitcoin Magazine frames as a short squeeze after the Democratic sweep in Congress, also draws on macro tailwinds. Amazon gained 8% and Apple nearly 7% (CNBC, November 4), while the 10-year Treasury yield of 4.9% cited by MarketWatch did not slow equities. The Block notes that markets have shrugged off both the hack and the elections. On the data front, US JOLTS job openings came in at 7.523M against 7.1M expected, and the ISM manufacturing index printed 52.4 versus 52, but ISM services fell to 54.5 against 54.8 expected. The euro area flash core CPI held at 2.5%, the BoJ kept its rate at 1.25% as expected, and German preliminary GDP reached 0.4% versus 0.2% forecast. The Digital Chamber called Sherrod Brown’s win the “most consequential unfavorable result” for the sector (The Block, November 5), and the Fed Governor Lisa Cook hearing has been delayed to December 14 (CNBC, November 4).
This backdrop neutralizes the technical signal. The squeeze and the easing in equities support the bounce, but ETF outflows, a negative Coinbase Premium and the political shift do not point to a durable recovery. The technical reading below should therefore be treated as a decision grid.
Multi-Timeframe Technical Analysis
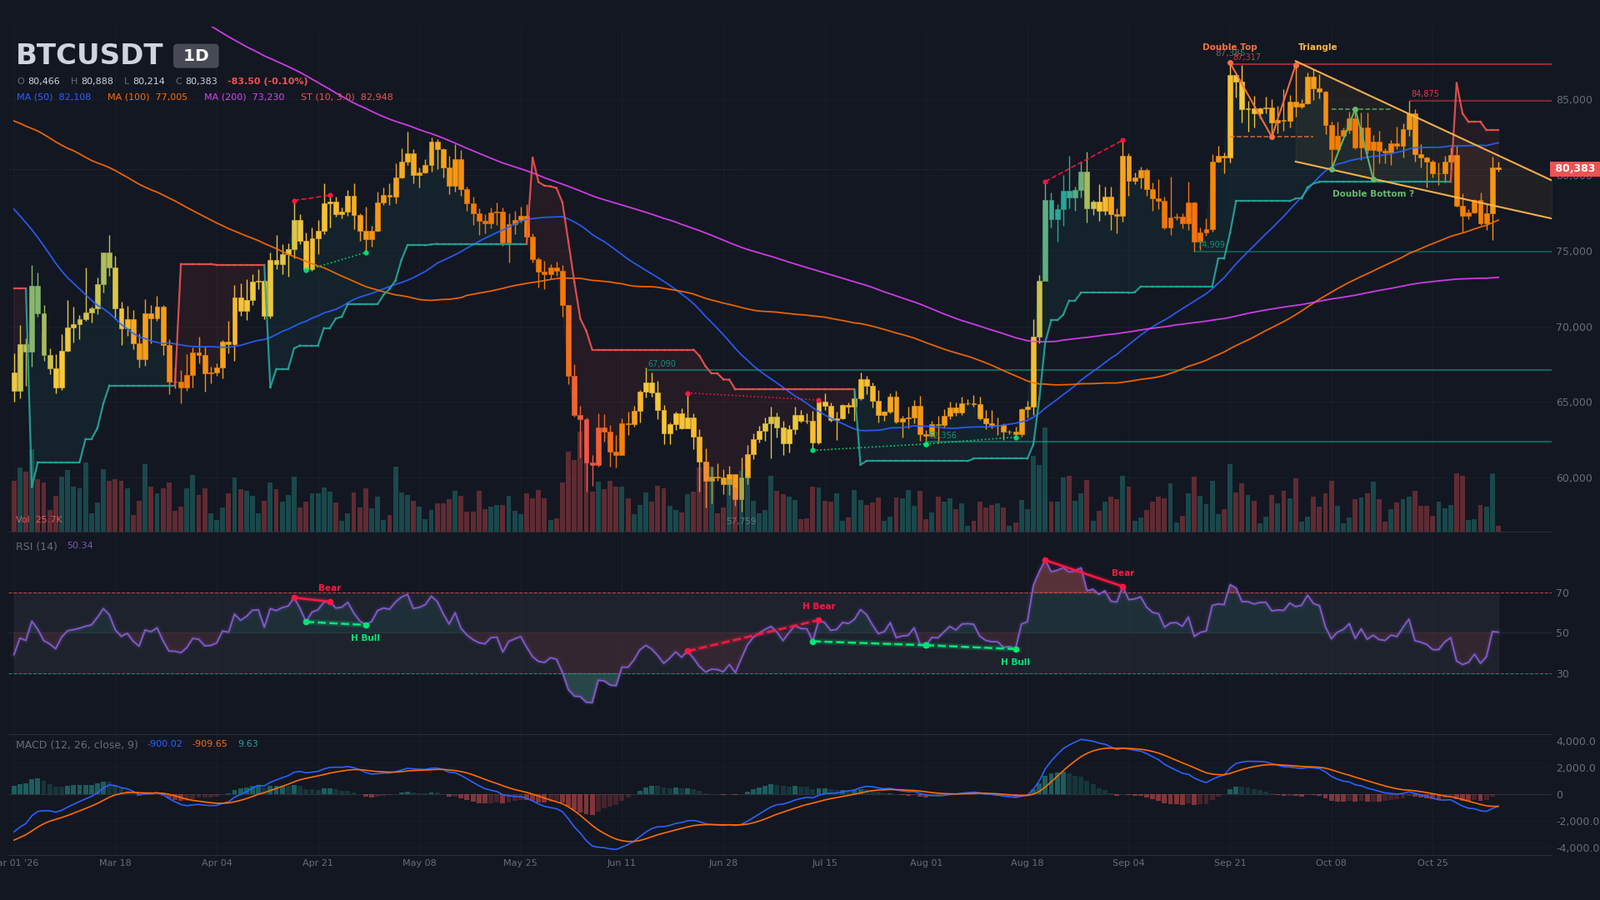
Daily Timeframe (1D): Confirmed Double Top Inside a Bearish Wedge
The daily phase is a consolidation with a bearish tilt after the September 21 peak. Lower highs line up: $87,385, then $84,875 (October 21), then $81,954 (October 29). The algorithm detects a confirmed double top with a neckline at $82,500 and a target at $77,683; the October 30 low at $76,270 came close to that objective. A compression wedge (started October 2, apex estimated December 10) is bounded between $78,500 and $82,550, and the SuperTrend remains bearish at $82,950. A bullish double bottom has been detected but remains unconfirmed, with a neckline at $84,340 and a target at $88,640.
Price holds above the 20-period moving average ($80,220) and the 200-day SMA ($73,230), but sits below the 50-day SMA ($82,110), with no recent 50/200 crossover. The relative strength index (RSI) reads ~50, after ~38 and ~51 in prior sessions. Swing highs show a falling RSI, from 74 on September 21 to 36 on October 29, which confirms the erosion of momentum. The MACD (moving average convergence divergence) has just crossed higher today, but remains below zero with a barely positive histogram. The signal is provisional because the candle is still open. Current volume is only 20% of its 20-period average, while the November 4 session ran well above it.
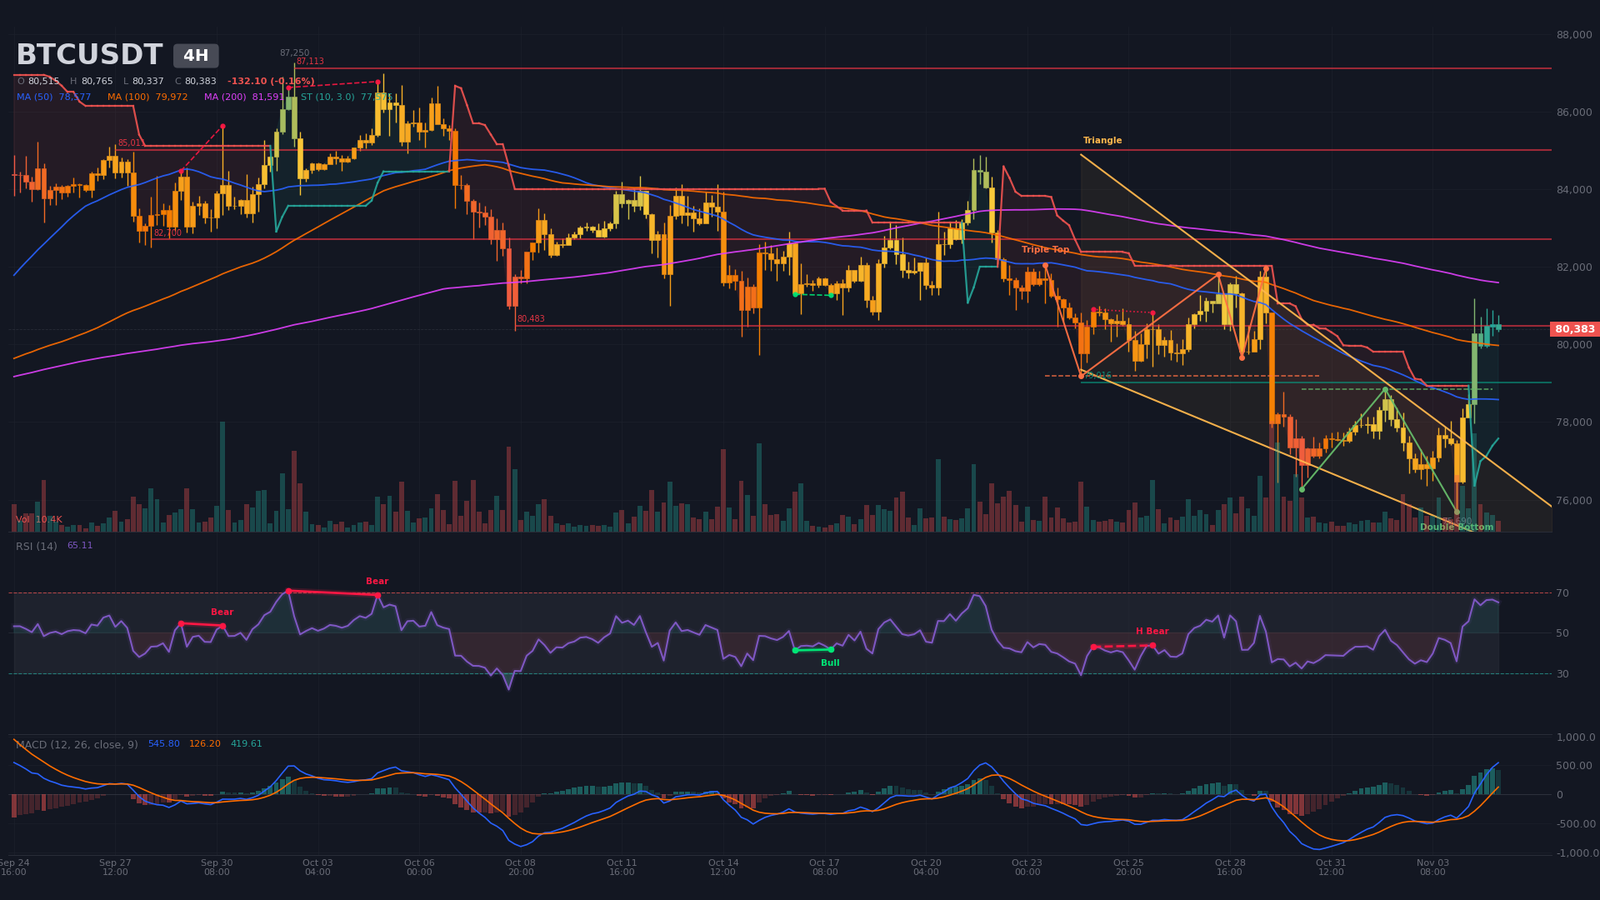
Intermediate Dynamics (4H): Bullish Wedge Breakout, Confirmed Double Bottom
The H4 chart tempers the daily picture in the short term. A wedge bounded by $77,650 on top and $75,340 below, with an apex estimated for November 11, has been broken to the upside. A bullish double bottom is confirmed, with a neckline at $78,850 and a target at $81,730; the November 4 high of $81,188 came close to it. The bearish triple top (neckline $79,180, target $76,430) was reclaimed by price, which weakens it. The SuperTrend is bullish at $77,575.
Price trades above the SMA20 ($78,200) and SMA50 ($78,580), but below the SMA200 ($81,590). The RSI at ~65 is approaching overbought territory. The MACD has been bullish since November 3 at 12:00, above zero, with a positive histogram, and the current candle’s volume reaches 42% of its average. The structure remains incomplete: the November 4 low ($75,690) is below that of November 3, and the November 4 high stays under $81,954. The key resistance is $80,480 (two contacts), with support at $79,020.
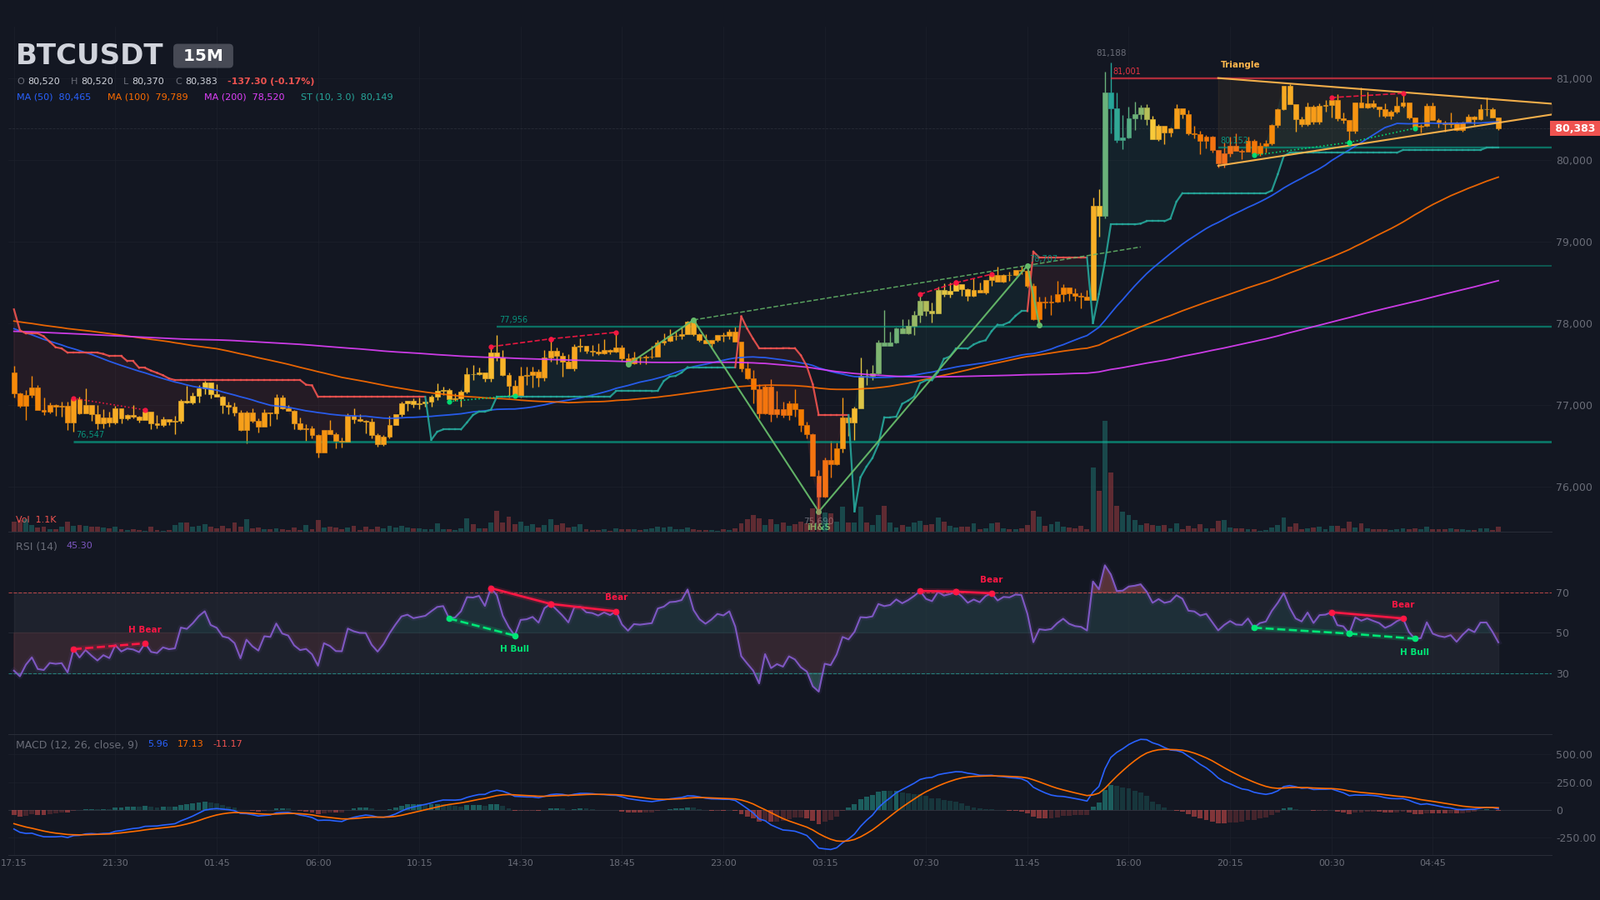
Intraday Structure (15m): Symmetrical Triangle Nearing Its End
A symmetrical triangle has been tightening since November 4 at 19:45, between $80,390 and $80,770, with an apex estimated near 11:40 today. Price, at $80,383, is testing the lower boundary. Support at $80,150 (three contacts, with the M15 SuperTrend at the same level) and resistance at $81,000 (three contacts) frame the range. The RSI is ~45, the MACD has just crossed lower at 07:15 while staying above zero, and a recent regular bearish divergence between 00:30 and 03:30 signals fading momentum. Provisional volume stands at 169% of its average.
The trigger is therefore a triangle breakout: an M15 close below $80,150 would open the way to $78,700–$79,000, while a close above $80,770 would target $81,000. The M15 average true range (ATR) is only $172, which calls for wide stops or an execution anchored on the H4.
Multi-Timeframe Synthesis
The three timeframes must be read together: the daily chart sets the bias, the H4 carries the rebound, and the M15 defines the trigger.
| Timeframe | Dominant trend | RSI (14) | MACD | Chart pattern |
|---|---|---|---|---|
| Daily (1D) | Bearish (consolidation) | ~50 | Bullish crossover today, below zero | Confirmed double top, wedge |
| 4 hours (4H) | Bullish (rebound) | ~65 | Bullish, above zero | Confirmed double bottom |
| 15 minutes (15M) | Neutral (compression) | ~45 | Recent bearish crossover | Symmetrical triangle |
Level Mapping: Technical Levels and Pivots
The map combines classic pivots (Daily, H4, M15), algorithmic supports and resistances, the Daily wedge boundaries, order-book walls and estimated liquidation pockets. No clean reference impulse can be isolated in the swings, so no Fibonacci extension is retained. The short-term central pivot sits between $80,150 and $80,560.
| Level | Price (USD) | Category | Technical basis |
|---|---|---|---|
| Major resistance 3 (R3) | $84,300–$85,100 | Resistance | Daily double-bottom neckline ($84,340), October 21 high ($84,875), estimated liquidation pocket $84,260–$84,450, H4 resistance $85,010 |
| Major resistance 2 (R2) | $82,500–$83,000 | Resistance | Daily wedge upper bound ($82,555), Daily R1 ($82,540), H4 resistance ($82,700), Daily SuperTrend ($82,950), estimated liquidation pocket $82,540–$82,790 |
| Immediate resistance (R1) | $80,500–$81,200 | Resistance | H4 resistance ($80,483), M15 resistance ($81,000), sell walls $80,400–$80,510, November 4 high ($81,188) |
| Central pivot (P) | $80,150–$80,560 | Pivot | H4 ($80,539) and M15 ($80,561) pivots, Daily SMA20 ($80,220), M15 support ($80,152) |
| Immediate support (S1) | $78,700–$79,200 | Support | H4 support ($79,016), Daily pivot ($79,115), H4 ($78,853) and M15 ($78,707) necklines |
| Major support 2 (S2) | $76,300–$77,100 | Support | Daily S1 ($77,042), October 30 low ($76,270), H4 SuperTrend ($77,575) |
| Major support 3 (S3) | $74,900–$75,700 | Support | Daily support ($74,909), estimated liquidation pockets $75,080–$75,620, November 4 H4 low ($75,690) |
Order Book and Liquidity Heatmap
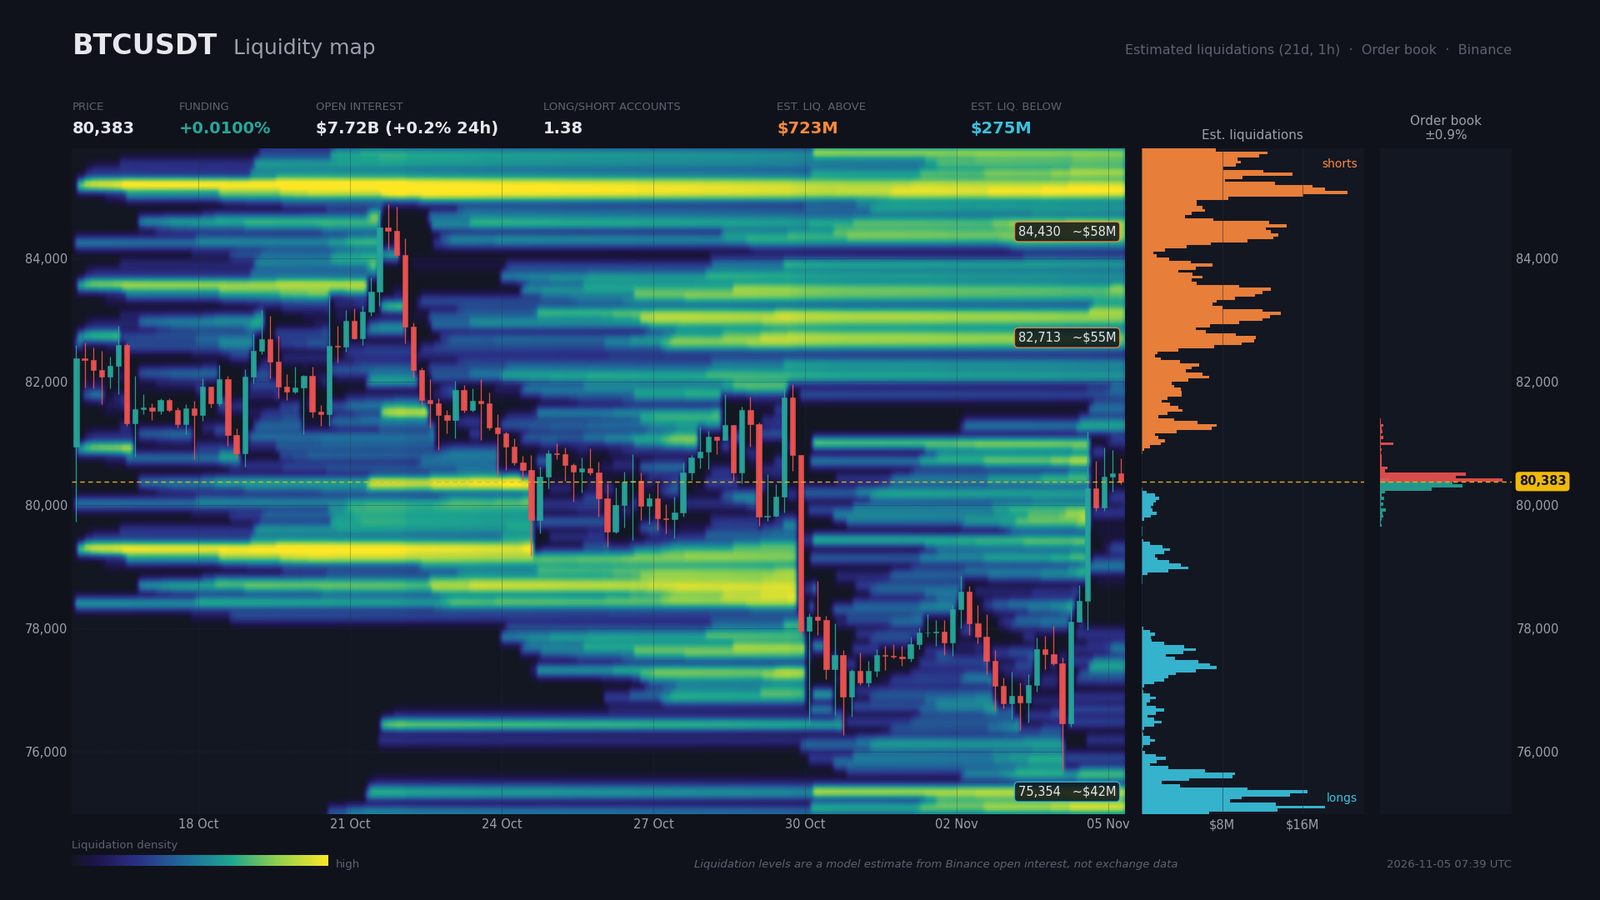
Binance order-book coverage, perpetual and spot combined, extends only 0.9% around the price. Sell walls sit at $80,407 ($32.7M), $80,457 ($20.3M) and $80,506 ($22.9M), then $80,996 ($3.5M). Buy walls are at $80,358 ($19.4M), $80,309 ($22.0M) and $80,260 ($13.6M), then $79,917 ($1.4M). Within a 2% band, buyers total $64.9M against $87.6M for sellers, a 14.9% imbalance in favor of supply.
Liquidation zones, which are model-based estimates rather than measured data, are asymmetric. Above the price, shorts are estimated at roughly $723M: $55M between $82,540 and $82,790 (+2.9%), $58M between $84,260 and $84,450 (+5.0%) and $50M between $84,995 and $85,090 (+5.8%). Below, longs are estimated at about $275M, roughly 2.6 times less. Funding is neutral at 0.01% (10.9% annualized), open interest stands at $7.72B and is nearly flat, and the account long/short ratio is 1.38, versus 1.94 for large traders.
The consequence is twofold. Mechanically, shorts trapped between $82,500 and $82,800 form the nearest magnet, but the absence of fresh leverage suggests the bounce is more a position clean-up than a trend build. A liquidity sweep toward $79,000 remains plausible, since buy walls are thinner than sell walls.
Calendar: Catalysts to Watch
The calendar is dense, but one release can realistically move price out of its $79,000–$81,000 zone: the November 6 jobs report, preceded by the Bank of England decision on November 5.
- Thursday, November 5, 13:00 (Zurich) — BoE rate decision, consensus 4.00% versus 3.75% previously: a miss can weigh on the dollar and risk assets.
- Thursday, November 5, 14:30 (Zurich) — US initial jobless claims, consensus 196,000 versus 194,000 previously.
- Friday, November 6, 14:30 (Zurich) — NFP, consensus 65,000 versus 29,000 previously, average hourly earnings expected at 0.3% (0.1% previously), unemployment at 4.2%: the central test for the bullish case.
- Friday, November 6, 16:00 (Zurich) — UoM sentiment, consensus 48 versus 46.3 previously.
- Friday, November 6, 17:00 (Zurich) — remarks from BoJ Governor Ueda.
Three Scenarios for the Coming Weeks
The three scenarios cover the coming sessions, until the NFP and the M15 triangle resolve. The rebound toward the short pocket remains the most likely path, but it is fragile.
Scenario A — Rebound Toward the Short Pocket (probability 40%)
The trigger is holding the $80,000–$80,350 zone, supported by buy walls and M15 support, followed by an H4 close above $81,200. The catalyst is the November 6 NFP at 14:30, in line with or below the 65,000 consensus. The path leads to $82,540 (Daily R1), then $82,700–$82,800 (estimated short pocket and H4 resistance), then $84,340 (Daily double-bottom neckline). Execution zone: $80,000–$80,300. Stop at $78,650, or $1,500 of risk, above the H4 ATR of $959; R:R of 1.6 toward $82,540. Invalidation: H4 close below $78,700.
Scenario B — Liquidity Sweep, Then Range Resumption (probability 35%)
The trigger is a rejection below $80,500–$81,000, followed by an M15 triangle breakdown under $80,150. The path calls for a sweep of $78,700–$79,200, then a return toward $80,500 and $81,000. The catalyst is the BoE decision on November 5 at 13:00 or Ueda’s remarks on November 6 at 17:00. Execution zone: reactive long at $78,700–$79,100 after M15 or H4 confirmation. Stop at $77,600, more than one H4 ATR away. Invalidation: H4 close below $77,600, the H4 SuperTrend.
Scenario C — Failed Rebound and Retest of $75,000 (probability 25%)
The trigger is a Daily close below $77,000 (Daily S1) after losing $78,700. The path leads to $76,430, the H4 triple-top target, then to estimated long pockets between $75,080 and $75,620, and finally $74,910. The catalyst is an NFP well above the 65,000 consensus, or fresh ETF outflows. Execution zone: short on a retest of $78,600. Stop at $79,700, or $1,100 of risk, for a R:R of about 2 toward $76,430. Invalidation: H4 close above $80,500.
Synthesis and Conclusion
The phase is a consolidation inside a Daily wedge, with a technical rebound running through it. The bounce is supported by a short squeeze and easing in US equities, but not by flows: Bitcoin ETFs logged three sessions of cumulative outflows before the rebound (Farside), and the Coinbase Premium was negative (CryptoQuant). As long as the Daily does not close above $82,500–$83,000, the confirmed double top and the bearish SuperTrend remain dominant.
The dominant technical strategy is to wait for the M15 triangle and the $80,500–$81,000 zone to resolve, then favor dips toward $80,000 as long as $78,700 holds. Below that level, protection moves to $77,000. Critical levels to watch are $81,000–$81,200 (decision resistance), $80,150 (M15 support and pivot), $78,700–$79,200 (H4 structural support), $82,500–$83,000 (short pocket, wedge boundary, Daily SuperTrend) and $77,000 (Daily S1, the bearish threshold).
Sources
- Bitcoin Price Holds Near $80,000 as Democratic Sweep Sparks Short Squeeze — Bitcoin Magazine, November 4, 2026
- Bitcoin rebounds past $80,000 as markets shrug off midterms and Binance hack — The Block, November 4, 2026
- Binance hack may be ‘temporary setback’ for crypto, Grayscale’s Pandl says — Cointelegraph, November 4, 2026
- Quicktake — CryptoQuant, publications of October 29 and 30, 2026
- Bitcoin ETF Flow (US$m) — Farside Investors, date not specified
- BlackRock leads $53.02 million Ethereum ETF inflow, ending a weeklong outflow streak — Crypto Briefing, November 5, 2026
- Hyperscalers and Apple surge after election results remove investor uncertainty — CNBC, November 4, 2026
- White House panel delays hearing on Fed’s Lisa Cook to Dec. 14 — CNBC, November 4, 2026
- These 12 stocks are good bets to beat the 10-year Treasury over the next decade — MarketWatch, November 4, 2026
- The Digital Chamber Calls Sherrod Brown’s Win the ‘Most Consequential Unfavorable Result’ for Crypto — The Block, November 5, 2026
- Mercado Bitcoin to Restore Access After Hack — Cointelegraph, November 4, 2026
- Credit Mutuel Arkea Confirms Cyberattack as ZachXBT Estimates Losses Above $133 Million — Bitcoin Magazine, November 4, 2026
- SEC Proposes Custody Rule Updates and Crypto Custody Framework — Sewkis, October 15, 2026 (date not confirmed)
- SEC.gov, Adviser and Regulated Fund Custody Rules; Crypto Custody Rules — SEC, October 12, 2026 (date not confirmed)
Disclaimer: This article is for educational and informational purposes only. It does not constitute investment advice, a recommendation to buy or sell, or an invitation to trade any financial asset. Cryptocurrency markets are extremely volatile; any investment decision should be based on your own research (DYOR) and, where appropriate, the advice of a licensed financial adviser.

