


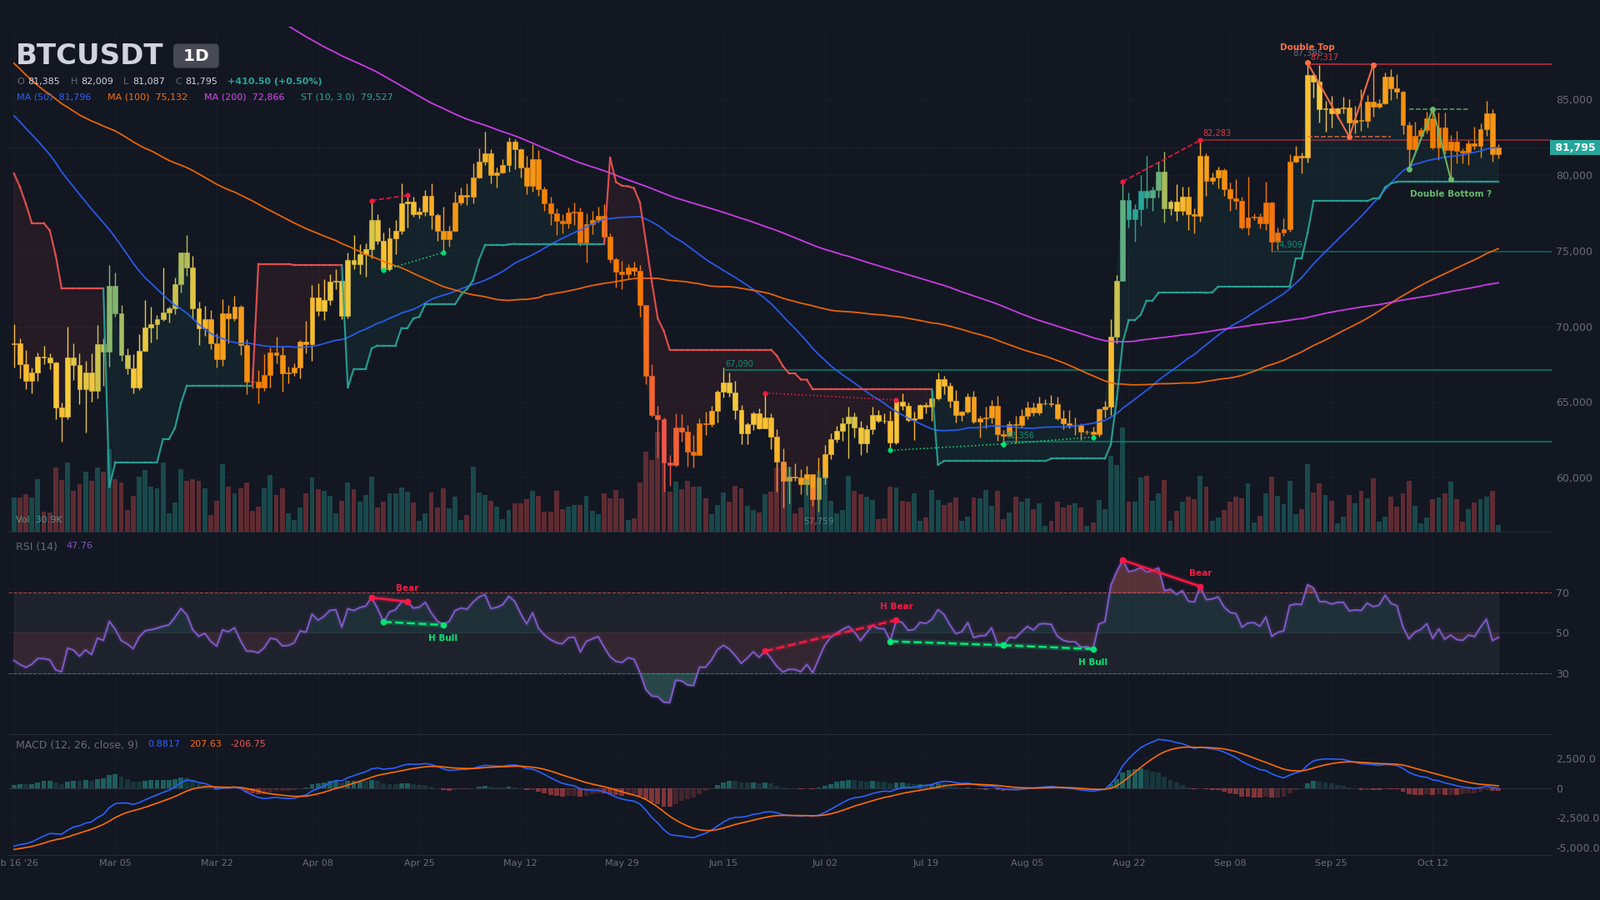
Bitcoin trades just below $82,000, at $81,800 when this note was written on October 23, 2026, roughly 6.4% under the period high of $87,385 set on September 21. Over the past 24 hours it has shed 3.4% to $81,387. The daily window’s low sits at $57,759, with no date given in the available data. The current phase is a consolidation that followed distribution under $87,000, and the price now drifts beneath its 50-period simple moving average (SMA50) on the daily chart.
The immediate driver is a risk-off shock in technology stocks. On Thursday, October 22, the Nasdaq fell 2.6%, its worst session since June, and the S&P 500 lost 1.21%, its worst since July, according to The Block (October 23) citing CNBC. Worries centre on the funding of artificial intelligence, notably at Meta, and Asian markets followed, with the Kospi down 2.3% and the Nikkei 1.6% on Friday morning. In derivatives, liquidations reached $440.9M, including $397M of long positions according to CoinGlass via The Block, while Crypto Briefing (October 23) counts $383M of longs against $124M of shorts. Laevitas sums up the asset as a « high-beta tech position ».
On the macro side, the US 10-year yield dropped more than 17 basis points to 4.972%, falling below 5% for the first time since September 23 (CNBC, October 22). Lower yields are usually supportive for risk assets, but here they reflect a flight to safety. In Japan, September core inflation reached 2.1% against 1.7% in August, a high for the year, while the yen trades at 156.15 per dollar. Recent releases offer no independent catalyst: UK inflation came in at 3.5% against a 3.4% consensus on October 21, and UK retail sales fell 0.4% against -0.1% expected on October 23; in the US, housing starts printed 1.221M against 1.3M expected on October 20, with no documented BTC reaction. Flows remain supportive. US spot ETFs took in $524.8M on Wednesday, about $1.07B over three days, and October has turned positive again by roughly $460M after a $615M outflow the week before (Decrypt, October 22). Santiment also records a record 20,338 wallets holding between 10 and 10,000 BTC. In Switzerland, FINMA approved the first retail spot bitcoin ETF under Swiss law, expected on SIX in November, while the SEC custody proposal published in the Federal Register on October 6 remains open for a 60-day comment period. China, meanwhile, is seeking to confiscate about 62,000 BTC in a fraud case, a supply risk with no known timetable.
This tension between falling equities and steady ETF demand neutralises much of the technical signal. The bias is neutral, conviction is low, and confluence stands at 3 out of 5. The technical reading that follows must therefore be read through this compression.
Multi-Timeframe Technical Analysis
Daily Timeframe (1D): double top confirmed below the SMA50
The daily structure is neutral, with a cautious tilt. The highs of September 21 ($87,385), October 2 ($87,250) and October 5 ($86,976) were followed by lower lows at $80,345 on October 8 and $79,732 on October 15. The algorithm flags a confirmed double top with a neckline at $82,500 and a target at $77,680; only this pattern is active. A bullish double bottom, with a neckline at $84,340 and a target at $88,640, remains an unconfirmed hypothesis. Price sits below the SMA20 ($82,900) and on the SMA50 ($81,800), but well above the SMA200 ($72,870). The 50/200 golden cross dated September 8 and now 45 candles old has not been invalidated. The daily SuperTrend remains bullish at $79,530.
Oscillators are more hesitant. The RSI, at about 48, is neutral, after a regular bearish divergence between August 21 and September 3 (RSI falling from about 86 to about 73) that preceded the drop. The MACD has sat below its signal line since the bearish crossover of September 29 (24 candles), with the line hovering near zero and a negative histogram. Finally, volume on the still-forming candle is only 25% of its 20-period average: the market is not backing the decline with conviction, but it is not rejecting it either.
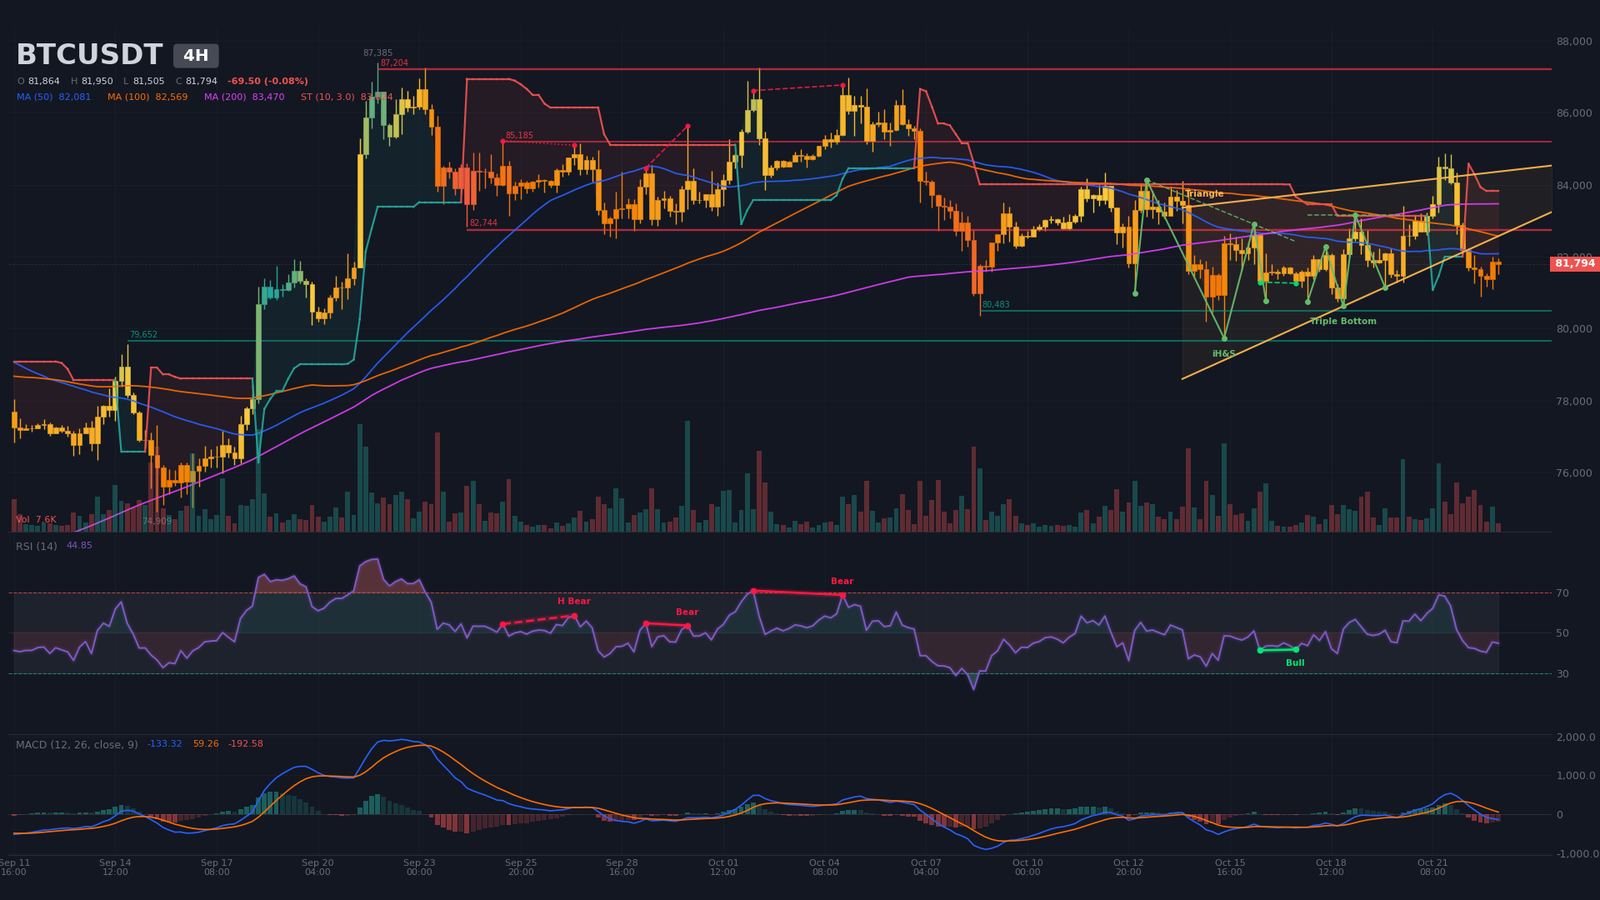
Intermediate Dynamics (4H): wedge under two unvalidated bullish patterns
The 4-hour chart is weaker than the daily. Price trades below the SMA20 ($82,520), SMA50 ($82,080) and SMA200 ($83,470). The 50/200 cross has been bearish since October 16, and the SuperTrend is bearish at $83,820. Peaks have been descending since the October 21 high of $84,875, with lows tested at $80,890 on October 22. The RSI, at about 45, is neutral, while the MACD, below zero and under its signal since October 22 at 08:00, shows a negative histogram.
Two bullish patterns nonetheless register as confirmed: a triple bottom, with a neckline at $83,160 and a target at $85,480, and an inverse head and shoulders, with a neckline at $82,900 and a target at $86,270. In the analyst’s reading, the slide below these necklines weakens their follow-through. A wedge tightens between $81,900 and $84,190, with an estimated apex on October 28 around 12:00; price trades just under its lower boundary, and volume is only 31% of its average. Supports sit at $80,480 and $79,650, and resistance at $82,740 (three contacts). This wedge is therefore the key to the next directional move, and it converges on the Fed decision.
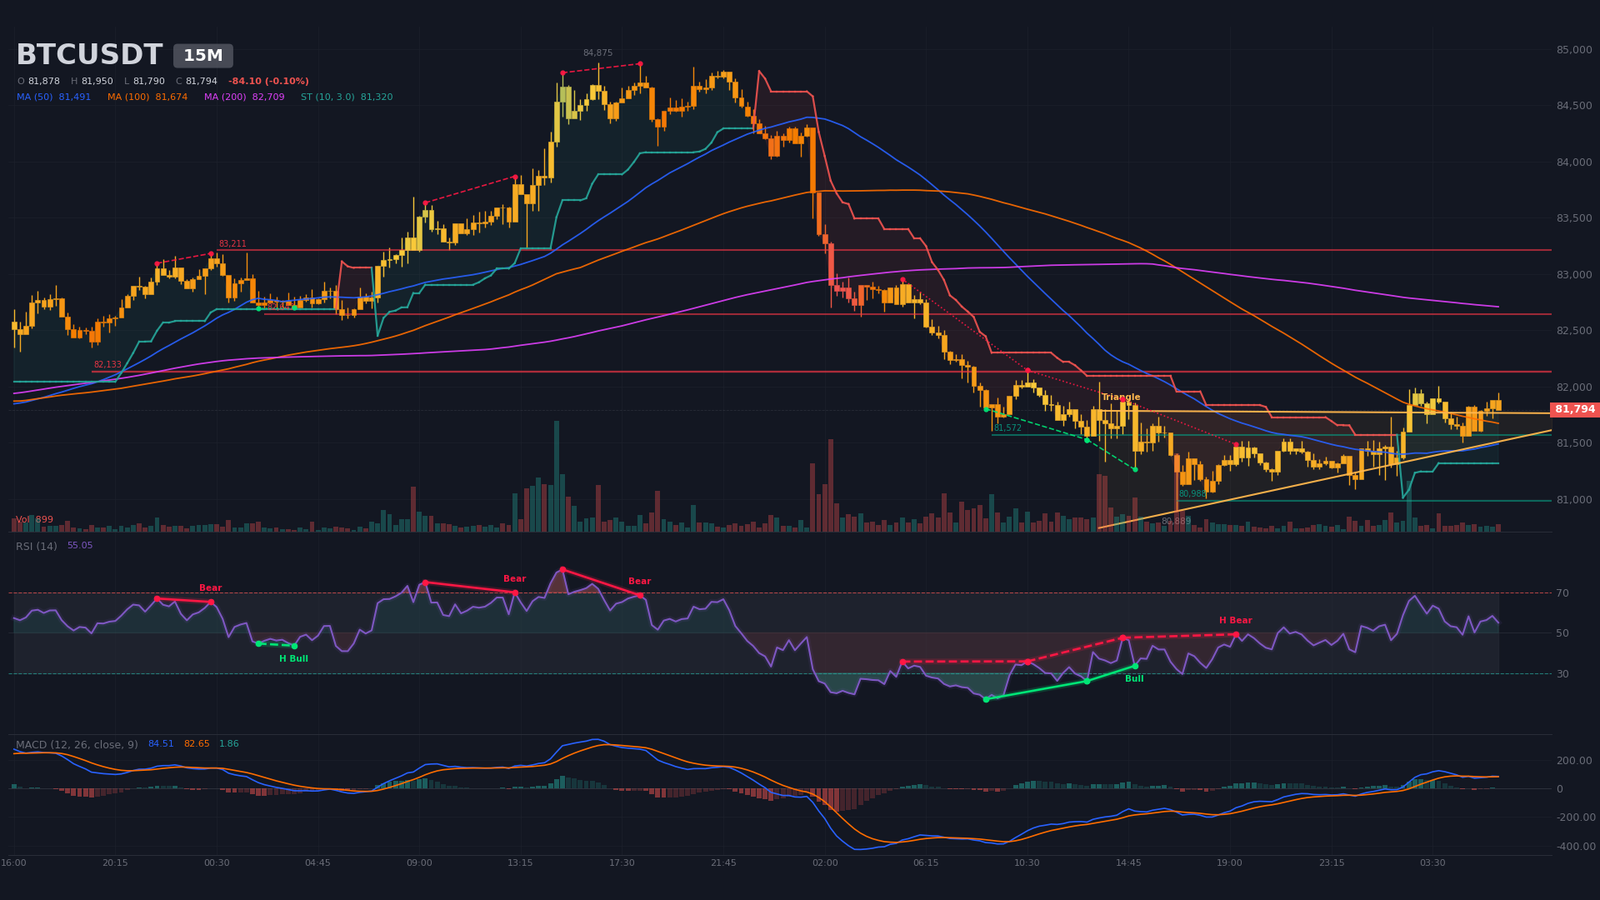
Intraday Structure (15m): ascending triangle breaking out tentatively
The 15-minute chart is the only timeframe showing a bullish bias, though the breakout remains fragile. The ascending triangle is bounded by $81,440 and $81,770, with an estimated apex on October 23 around 11:40. Price, at $81,794, sits just above the upper boundary, with a bullish MACD crossover at 06:00 and an RSI near 55. It holds above the SMA20 ($81,710) and SMA50 ($81,490), but below the SMA200 ($82,710), and the M15 SuperTrend is bullish at $81,320. A regular bullish divergence on October 22 (RSI from about 26 to about 34) preceded this rebound.
Resistances stack at $82,130 (three contacts), $82,640 and $83,210, with supports at $81,570 and $80,990. The M15 ATR is near $187, and volume stands at only 74% of its average, so an exit without volume remains suspect. The near-term invalidation is an M15 close below $81,440.
Multi-Timeframe Synthesis
| Timeframe | Dominant trend | RSI (14) | MACD | Chart pattern |
|---|---|---|---|---|
| Daily (1D) | Neutral (consolidation under $87,000) | ~48 | Bearish crossover on Sept 29, line near zero | Confirmed double top |
| 4 hours (4H) | Short-term bearish | ~45 | Bearish crossover on Oct 22 below zero | Compression wedge |
| 15 minutes (15m) | Bullish (compression) | ~55 | Bullish crossover on Oct 23 | Ascending triangle |
Technical Level Map and Pivots
The map combines classic daily pivots, swings and resistances detected across the three timeframes, pattern targets, order-book walls and estimated liquidation zones. Fibonacci extensions are not retained, since the available swings show no clean impulse. The short-term central pivot sits at $82,200: while price stays below it, the reading remains defensive.
| Level | Price (USD) | Category | Technical basis |
|---|---|---|---|
| Major resistance 3 (R3) | $87,200 – $87,600 | Resistance | September 21 high ($87,385), daily resistance at $87,317, estimated short pocket $87,498–$87,612 |
| Major resistance 2 (R2) | $84,900 – $85,300 | Resistance | Estimated short pocket (about $158M), 4H resistance at $85,185, October 21 peak |
| Immediate resistance (R1) | $82,300 – $82,750 | Resistance | Daily resistance at $82,283, double-top neckline at $82,500, 4H resistance at $82,744 |
| Central pivot (P) | $81,800 – $82,200 | Pivot | Daily pivot at $82,201, daily SMA50 at $81,796 |
| Immediate support (S1) | $80,250 – $80,500 | Support | 4H support at $80,483, October 8 low ($80,345), estimated long pocket ($80,340) |
| Major support 2 (S2) | $79,200 – $79,700 | Support | October 15 low ($79,732), 4H support at $79,652, daily SuperTrend at $79,527, estimated long pocket $79,227–$79,342 |
| Major support 3 (S3) | $77,700 – $78,800 | Support | Double-top target ($77,683), daily S2 at $78,760, estimated long pocket $78,600–$78,828 |
Order Book and Liquidity Heatmap
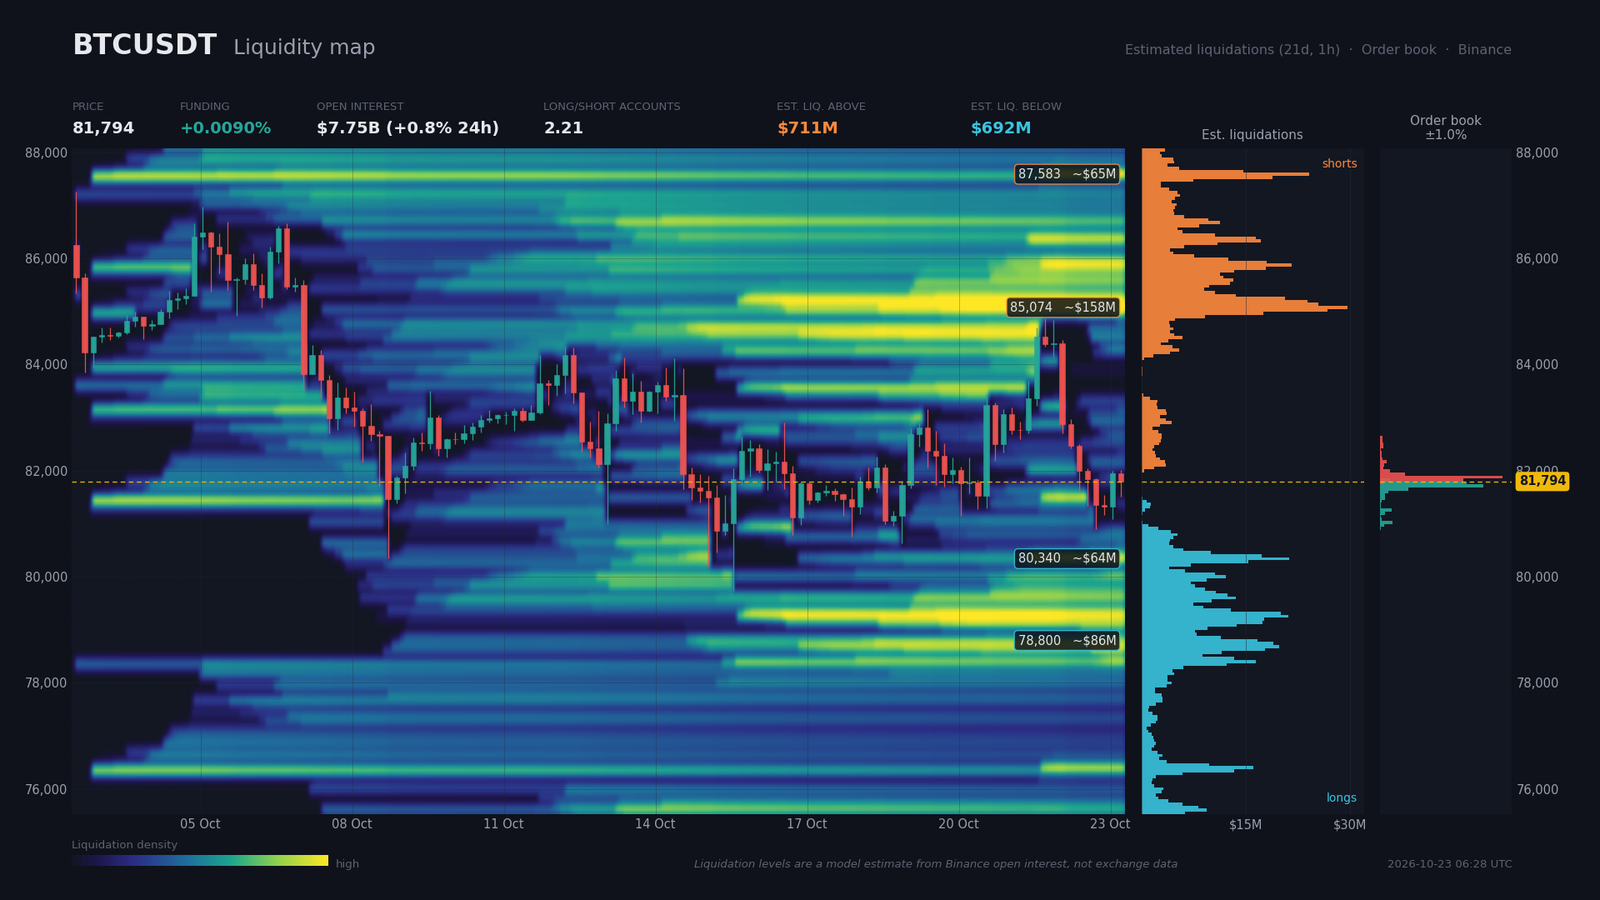
The order book is only visible within about 1.02% of the price, and it stays balanced. Sell walls sit at $22.3M at $81,820 and $32.8M at $81,880, facing buy walls of $23.1M at $81,765 and $27.8M at $81,710. Within ±2%, $75.5M of bids face $72.8M of asks, an imbalance of 1.8%: no clear directional signal.
Estimated liquidation zones (a model, not measured) are split almost symmetrically. Roughly $711M of shorts sit above, the densest pocket between $84,930 and $85,270 (about $158M, around 4% higher), and roughly $692M of longs lie below. The nearest and densest pocket is nonetheless under the price, between $80,250 and $80,430 (about $64M, around 1.8% lower), just above the $80,340 support. Funding at 0.009% (about 9.9% annualised) shows no overheating. Open interest reaches $7.75B (+0.77% over 24 hours), the long/short ratio is 2.21 across accounts against 1.53 among top traders, and the taker buy/sell ratio stands at 0.97 over 24 hours.
This setup reflects a long-heavy positioning among retail traders, which mechanically exposes the market to a liquidity sweep toward $80,300 before any durable rebound. Conversely, a squeeze toward $85,070 would require a 4H close above $82,750.
Calendar: Catalysts to Watch
The next ten days are dominated by the Fed. No Deribit options expiry or CME settlement appears in the calendar provided. These are the high-impact dates the analyst retains.
- Oct 23, 10:30 (Zurich) — UK flash manufacturing PMI (consensus 51.8; previous 52.1): a gauge of European risk appetite, with limited expected impact on the price.
- Oct 27, 13:30 (Zurich) — US durable goods orders excluding transportation (consensus 0.6%; previous 0.3%): the first macro test of the week for rates.
- Oct 28, 19:00 (Zurich) — Fed decision (consensus 4; previous 4, hold expected), press conference at 19:30: a major event, coinciding with the estimated apex of the 4H wedge.
- Oct 28 (Zurich) — UK Autumn Budget: political and fiscal risk, with no direct link to the price.
- Oct 29, 13:30 (Zurich) — US advance GDP (previous 6.1) and core PCE m/m (consensus 0.5%; previous 0.3%): a print above consensus would weigh on risk assets.
- Oct 29, 14:15 (Zurich) — ECB deposit rate (consensus 2.5%; previous 2.5%): a signal on European monetary policy, relevant to global liquidity.
Three Scenarios for the Coming Weeks
The probabilities below, assigned by the analyst, cover the coming weeks and are paced by the October 28 Fed decision. Together they total 100%.
Scenario A — Technical rebound within the range (probability 45%)
The central case assumes equities steady ahead of the October 28 FOMC and continued ETF inflows. The trigger is a hold of $81,440 on the M15, followed by a reclaim of $82,130. Targets sit at $82,640, then $83,160–$83,210, matching the 4H necklines and the M15 resistance. The R:R is about 1.9 (risk of roughly $750 for a gain of roughly $1,460 toward $83,160). Execution zone: buy between $81,570 and $81,800 (wall at $81,650, M15 support). Invalidation: a 4H close below $80,480, with a stop at $80,950, more than one 4H ATR away.
Scenario B — Bearish liquidity sweep (probability 35%)
The bearish case extends the Nasdaq sell-off, with the FOMC or the October 29 PCE as possible catalysts. The trigger is a 4H close below $80,480. Targets are $80,340, then $79,230–$79,700, with an extension to $78,600–$78,830; a move to $77,680 would activate the daily double-top target. Execution zone: sell on a rebound between $80,400 and $80,600. Invalidation: a 4H close above $82,750, with a stop at $81,300.
Scenario C — Bullish breakout and squeeze (probability 20%)
The bullish case rests on a Fed judged accommodative on October 28 and on falling yields. The trigger is a 4H close above $83,160 after $82,750, which would invalidate the daily double top. Targets are $84,340 (double-bottom neckline), $85,070 (estimated short pocket), then $85,480–$86,270 (4H pattern targets). Execution zone: buy on a retest between $82,700 and $83,000. Invalidation: a 4H close back below $81,500, with a stop at $81,800.
Synthesis and Conclusion
The current phase is a partial distribution-type consolidation under $87,000, with no structural break: the daily trend still holds above the SMA200. ETF flows of roughly $1.07B over three days and the accumulation by large holders contrast with the macro fragility, and Santiment records a record 20,338 wallets holding between 10 and 10,000 BTC. Hashrate above 1 ZH/s, its highest since March 3, confirms the network’s resilience without clarifying the short term. This divergence explains the range and rules out high directional conviction.
The dominant technical strategy is to wait for the 4H wedge to resolve, or to trade the range with stops of at least one ATR. The key protection level is $80,480 on a 4H close: below it, scenario B dominates; above $82,750, the bias turns constructive. The critical levels to watch remain $80,250–$80,500, $81,440–$81,770, $82,300–$82,750, $83,160 and $84,900–$85,300.
Sources
- Bitcoin slides below $81,500 as tech stock sell-off spreads to Asian equities — The Block, 23/10/2026
- Switzerland Approves First Retail Spot Bitcoin ETF — Cointelegraph, 23/10/2026
- Bitcoin ETFs Erase October Losses With $1 Billion in Three Days — Decrypt, 22/10/2026
- 10-year Treasury yield tumbles below 5% to lowest level in nearly a month — CNBC, 22/10/2026
- Japan core inflation in September surges to its highest this year at 2.1% — CNBC, 23/10/2026
- $383 million in crypto longs liquidated in 24 hours — Crypto Briefing, 23/10/2026
- Bitcoin ETFs Shed $487M, Every Fund Sees Outflows — Altcoin Buzz, 08/10/2026
- Bitcoin Whale Wallets Reach Record 20,338 as Large Holders Defy October Slide — BigGo Finance, 16/10/2026
- Bitcoin hashrate hits seven-month high as AI shift fails to ease mining competition — Cointelegraph, 22/10/2026
- China Moves to Confiscate $5 Billion in Bitcoin From Fraudster Who Fled to UK — Bitcoin Magazine, 22/10/2026
- Blockchain Association Presses Congress on Crypto Taxes as Clarity Act Stalls — Bitcoin Magazine, 22/10/2026
- SEC proposes crypto asset custody framework for investment advisers and regulated funds — A&O Shearman, 15/10/2026
Disclaimer: This article is for educational and informational purposes only. It does not constitute investment advice, a recommendation to buy or sell, or an invitation to trade any financial asset. Cryptocurrency markets are extremely volatile; any investment decision should be based on your own research (DYOR) and, where appropriate, the advice of a licensed financial adviser.

