


Bitcoin trades just below $76,000 on November 7, 2026, 1.5% above the November 6 low of $74,810 and roughly 13% beneath the October 2 peak of $87,250. That low is the lowest since August 21. The market is in an orderly correction after a run of lower highs, and it is still digesting a leverage purge that erased more than $1 billion of positions in 24 hours.
The immediate driver is capital leaving the market. According to Decrypt (November 6, CoinGlass data), $1.05B of liquidations hit in 24 hours, including $930M of long positions, or 88.2%. US spot ETFs shed $430.2M on Thursday according to Farside, with $199.9M from FBTC and $105M from IBIT, and the week now totals $869.8M of outflows after $643.2M the previous Friday. The Block puts total crypto ETF outflows above $540M. The trigger, however, came from equities: the Nasdaq fell 5.5% and the S&P 500 4.4% on Thursday, per Decrypt, and Bitcoin gave back its post-election rebound after clearing $80,000 on Wednesday. On Friday it broke $75,000 shortly after the Wall Street open, while the Nasdaq was rebounding 1.2% to 1.8% (Cointelegraph).
On the macro front, October nonfarm payrolls came in at 165,000 against 65,000 expected, with unemployment at 4.1% versus 4.2% and hourly wages up 0.4% against 0.3%. Before the release, Reuters noted that economists still expected a Federal Reserve rate hike in December, so a strong print reinforces that scenario, which is unfavorable to risk assets. Earlier in the week, JOLTS job openings surprised at 7.523 million against 7.1 million, ISM services slipped to 54.5 against 54.8, and University of Michigan sentiment rose to 51 against 48. The Bank of England raised its rate to 4%, in line with consensus. On the regulatory side, Democrats now control Congress, which reshuffles the cards for the CLARITY Act (Cointelegraph, November 6). FinCEN has cut the exchange MEXC off from the US financial system over an estimated $16B of alleged illicit flows, an order that takes effect 30 days after publication in the Federal Register.
For the technical reading that follows, this sets the frame: as long as ETF outflows and equity weakness persist, rebounds remain vulnerable. Regulatory progress, such as the SEC custody proposal open to comments until December 7, matters over the medium term but does not offset current flows.
Multi-Timeframe Technical Analysis
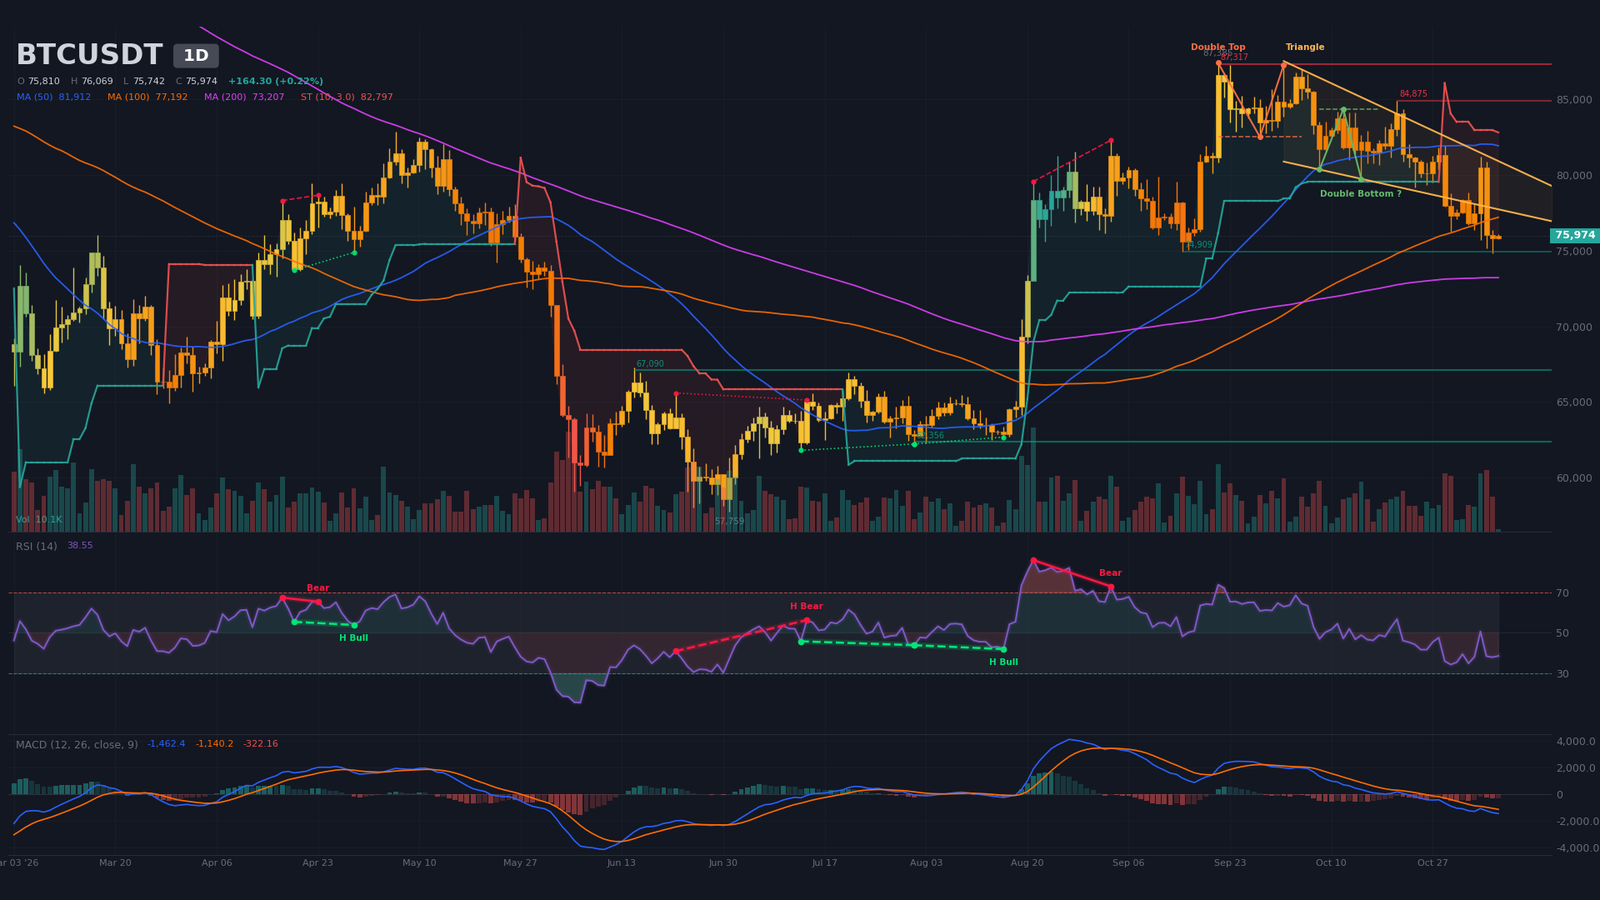
Daily Timeframe (1D): confirmed double top and wedge break below the SMA50
The daily trend is bearish, in a distribution phase followed by a correction. Peaks are falling from $87,250 (October 2) to $81,190 (November 4), and troughs from $82,500 (September 28) to $76,270 (October 30), then $74,810 (November 6, adjusted on the H4). Price sits below the 20-day simple moving average (simple moving average, SMA), near $79,400, and below the SMA50, near $81,900. It remains above the SMA200, near $73,200, which becomes the strategic pivot. No 50/200 cross is flagged, and the SuperTrend, a band-based trend indicator, stays bearish at $82,800.
The algorithmic double top is confirmed: the neckline sits at $82,500 and the target at $77,680, already exceeded. The wedge drawn on October 2, bounded by $78,510 and $82,550 with an apex estimated around December 10, gave way to the downside at the end of October. The double bottom at $84,340, targeting $88,640, is not confirmed and remains a remote hypothesis that contradicts the observed structure. Algorithmic supports sit at $74,910 with one contact, then $67,090 and $62,360 with two contacts each.
Oscillators confirm the weakness without a reversal signal. The relative strength index (relative strength index, RSI) reads ~39, a neutral zone, after a low near 34 on October 30. No recent bullish divergence is detected on the daily chart: the October 30 low at $76,270 with an RSI of 34 is lower in both price and RSI than October 24 ($79,180, RSI 44). The MACD (moving average convergence divergence) remains below zero and its signal line, with a negative histogram and a bearish crossover dated September 29, 39 candles earlier. Volume on the current candle, at 7% of its 20-day average, is provisional; by contrast, the November 4 and 5 sessions show spikes, a sign of partial capitulation.
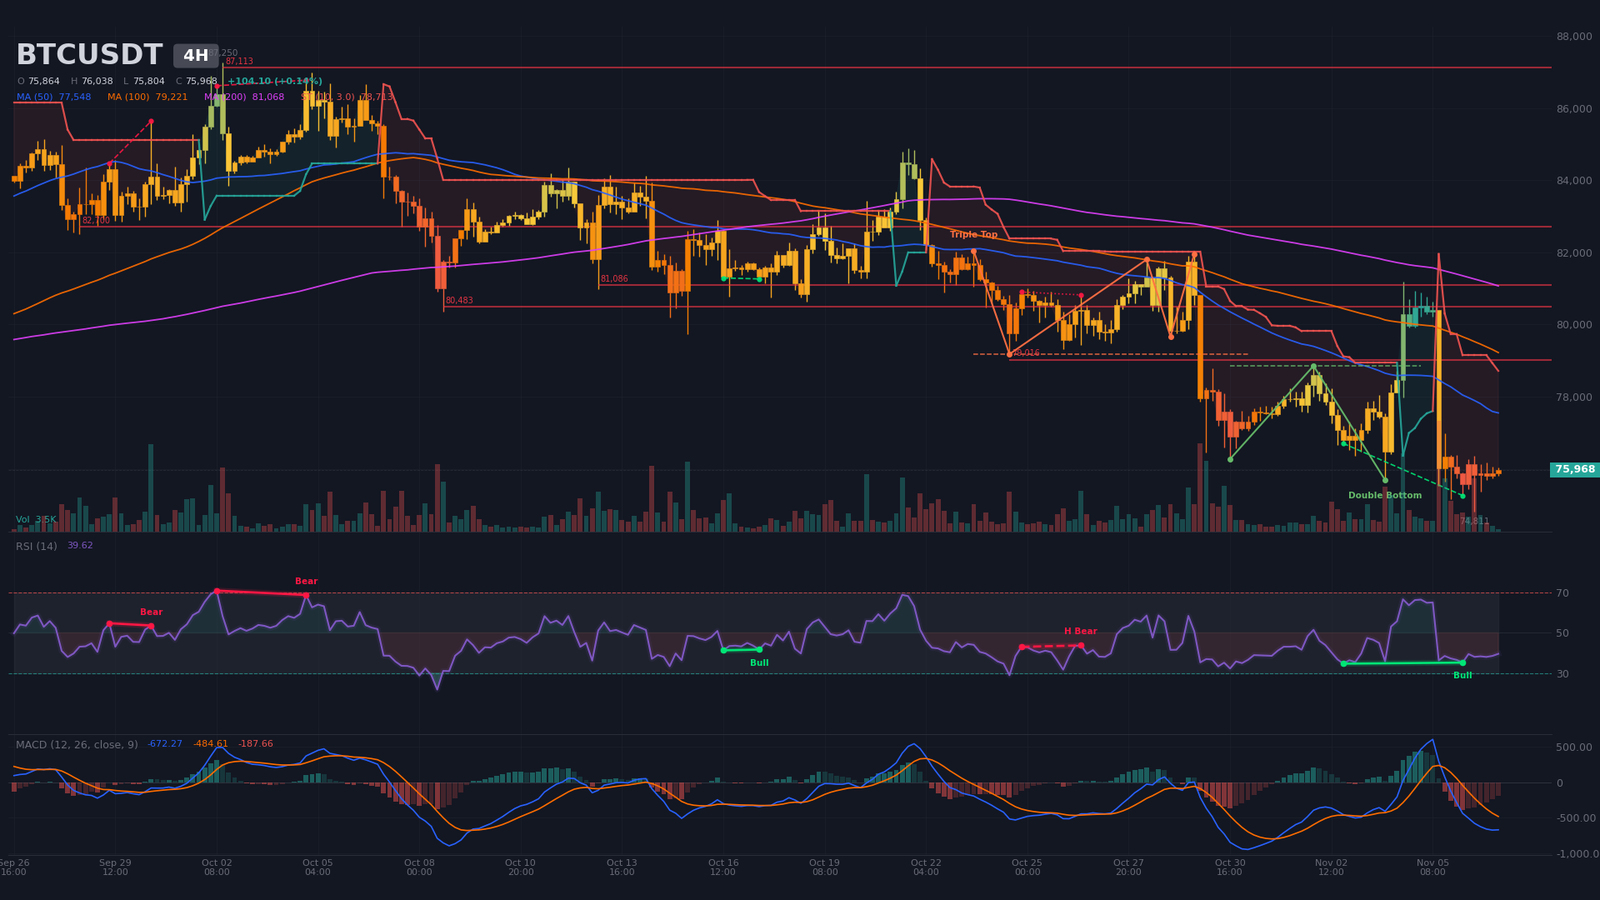
Intermediate Dynamics (4H): confirmed triple top and stabilization on bullish divergence
The H4 chart validates the daily bias. Price remains below the SMA20, near $77,500, the SMA50, near $77,550, and the SMA200, near $81,070. The SuperTrend is bearish at $78,710. Peaks are falling, from $81,190 on November 4 to $76,350 on November 6, and troughs too, at $75,690, $75,160 and $74,810. The triple top is confirmed, with a neckline at $79,180 and a target at $76,430, which has been reached. The H4 double bottom, flagged as confirmed with a neckline at $78,850 and a target at $81,730, is in practice invalidated because price has slipped back below that line. This is an analyst reading and should be treated with nuance.
The RSI is at ~40, with a floor between 35 and 38 for three days. A recent regular bullish divergence, from November 2 to 6, shows price moving from $76,700 to $75,260 while the RSI held at 35, suggesting seller exhaustion that needs confirmation through an H4 close above $77,550. The MACD stays below zero and below its signal line, with a bearish crossover on November 5 and a negative histogram. Volume is only 10% of its average on the current candle, after a spike on November 5. Resistances to watch are $79,020, $80,480 and $81,090.
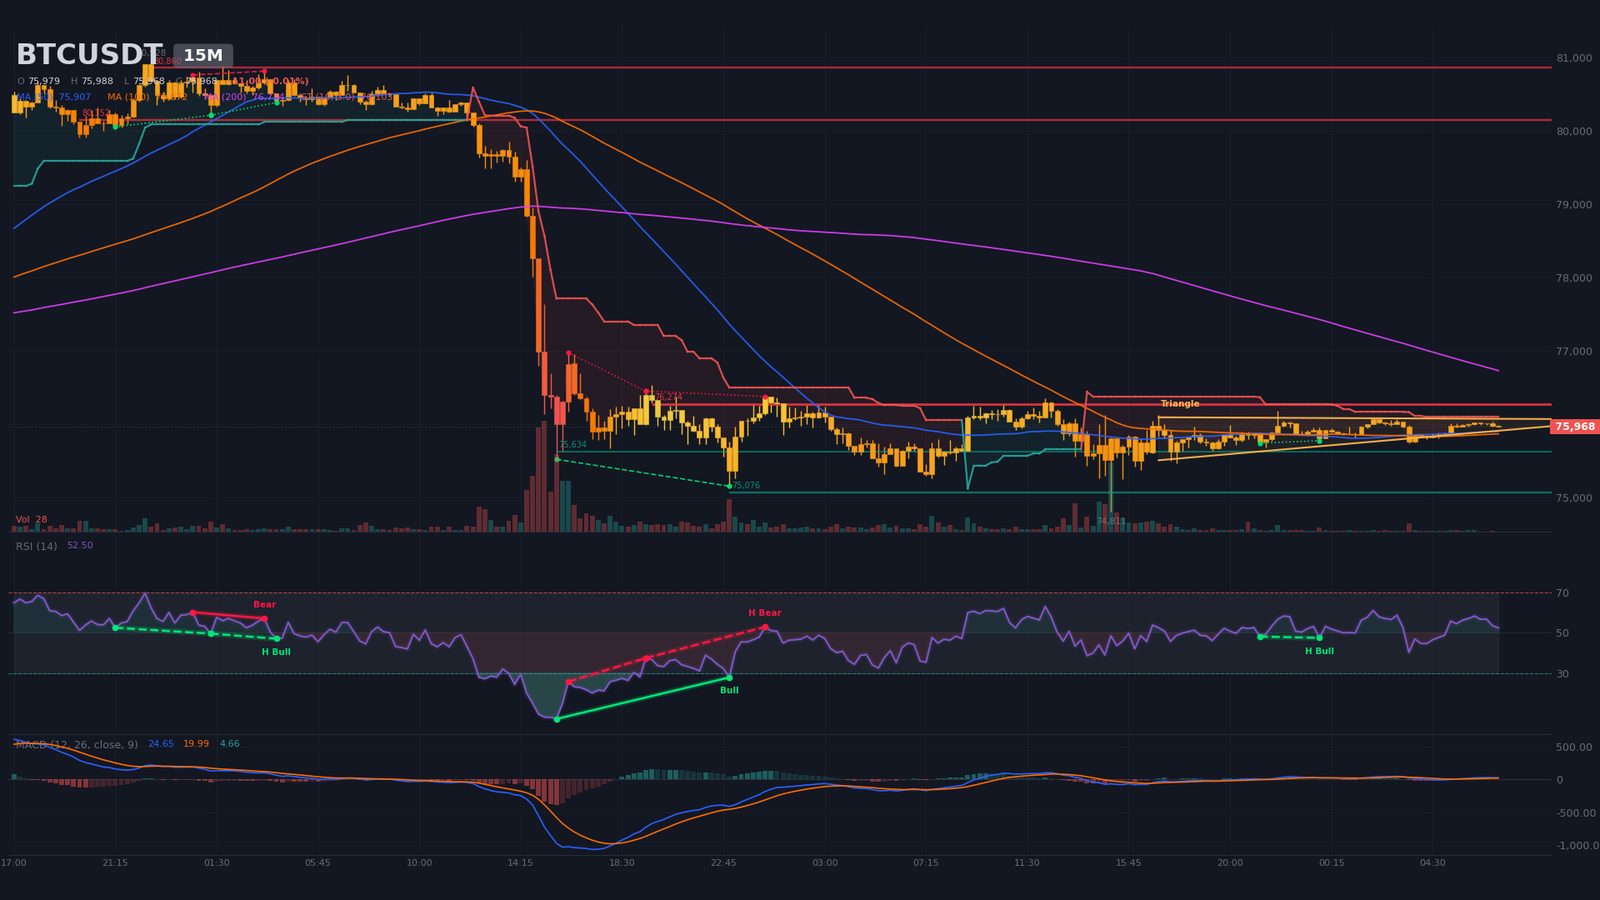
Intraday Structure (15m): ascending triangle under resistance
The M15 chart forms an ascending triangle (ascending triangle) bounded between $75,810 and $76,080, with horizontal resistance at $76,270 carrying six contacts. Its apex is estimated around midday on November 7, so resolution is imminent. Below, supports sit at $75,630 with two contacts and $75,080 with three. Price is above the SMA20 and SMA50, near $75,900, and below the SMA200, near $76,730; the SuperTrend remains bearish at $76,100.
The RSI is ~52, and the MACD has been above zero and above its signal line since the bullish crossover early on November 7, with a slightly positive histogram. A recent hidden bullish divergence (hidden bullish divergence), between the evening of November 6 and the hours that followed, supports the technical rebound. Volume, at 8% of its average, shows no expansion yet, and the 15-minute ATR (average true range) of about $70 means any move outside the range will be visible quickly. The M15 remains a technical rebound inside a bearish H4, unless it closes above $76,300.
Multi-Timeframe Synthesis
| Timeframe | Dominant Trend | RSI (14) | MACD | Chart Pattern |
|---|---|---|---|---|
| Daily (1D) | Bearish (correction) | ~39 | Bearish crossover on September 29, below zero | Confirmed double top, broken wedge |
| 4-hour (4H) | Bearish (stabilization) | ~40 | Bearish crossover on November 5 | Confirmed triple top |
| 15-minute (15m) | Neutral to bullish (compression) | ~52 | Bullish crossover on November 7 | Ascending triangle |
Level Mapping: Pivots and Technical Levels
The map combines classic pivots from the daily, H4 and M15 charts, algorithmic supports and resistances, moving averages, order-book walls and estimated liquidation pockets. No Fibonacci extension is retained, since the reference low date was not provided. The short-term central pivot sits between $75,700 and $76,000, and intraday reading will hinge on that zone.
| Level | Price (USD) | Category | Technical Basis |
|---|---|---|---|
| Major resistance 3 (R3) | $82,500–$83,600 | Structural resistance | Daily double-top neckline ($82,500), daily SuperTrend ($82,800), estimated short pocket $82,860–$83,600 |
| Major resistance 2 (R2) | $78,500–$79,400 | Swing resistance | Daily wedge base ($78,510), H4 double-bottom neckline ($78,850), H4 triple top ($79,180), daily SMA20 ($79,420) |
| Immediate resistance (R1) | $76,270–$76,520 | Intraday resistance | M15 resistance (6 contacts, $76,270), daily pivot R1 ($76,520), sell wall at $76,290 |
| Central pivot (P) | $75,670–$76,000 | Pivot | Daily P ($75,670), H4 P ($75,890), M15 P ($75,995), walls at $75,920 and $76,015 |
| Immediate support (S1) | $74,800–$75,100 | Support | November 6 low ($74,810), daily support ($74,910), M15 support ($75,080), walls at $74,990 and $75,083 |
| Major support 2 (S2) | $72,300–$73,500 | Dynamic support | Daily SMA200 ($73,210), estimated long pockets $73,170–$73,450 and $72,340–$72,900 |
| Major support 3 (S3) | $66,800–$67,400 | Structural support | Daily support at $67,090 (2 contacts, first contact June 15) |
Order Book and Liquidity Heatmap
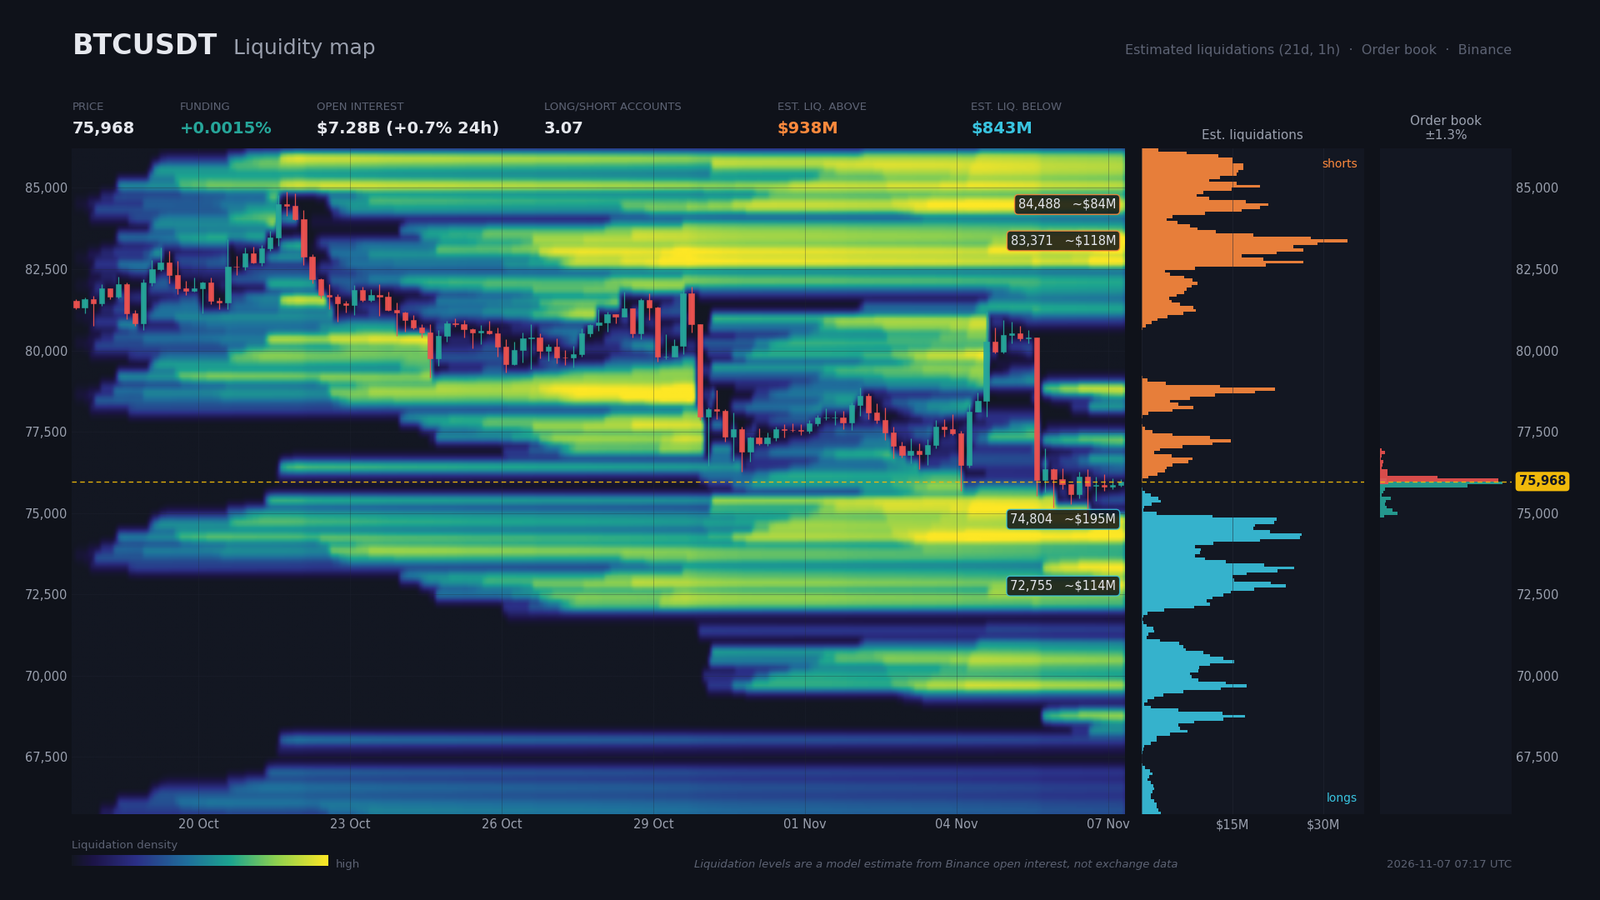
The visible order book covers only 1.3% around the price, so the reading is very local. On the sell side, the main wall sits at $76,015 ($31.9M), followed by $76,108 ($15.5M) and two smaller walls at $76,201 and $76,294 ($2M each). On the buy side, $75,921 ($32.9M) and $75,828 ($23.5M) lead, then $75,083 ($3.3M) and $74,990 ($4.7M). Within ±2%, bids ($76.7M) exceed asks ($57.8M), an imbalance of 14.1%. Mechanically, price is trapped between two nearly symmetric walls less than 0.1% apart, which explains the M15 compression.
Liquidation levels are model estimates, not measured data. Below the price, the densest zone runs from $74,110 to $74,850, with roughly $195M of longs, 1.5% away. Next come $73,170–$73,450 (about $77M) and $72,340–$72,900 (about $114M). Above, shorts cluster between $82,860 and $83,140 (about $75M), $83,230 and $83,600 (about $118M) and $84,260 and $84,630 (about $84M), 9% to 11% from the price. Estimated totals are $938M above and $843M below.
Derivatives reinforce the caution. Funding is nearly flat at +0.0015%, or 1.6% annualized. Open interest stands at $7.28B, up 0.68% over 24 hours but down 2.9% over seven days. The account long/short ratio is 3.07 and the top-trader ratio 2.0, so positioning remains clearly long, while the 24-hour taker buy/sell ratio of 0.967 leans slightly toward sellers. This points to a liquidity sweep (liquidity sweep) risk toward $74,100–$74,850, a natural magnet for price, rather than a short squeeze. Upside squeeze potential for shorts only opens above $82,800, too far to drive the short term.
Calendar: Catalysts to Watch
The calendar is dominated by US inflation, the one release able to resolve the current compression. The items below are the high-impact dates only.
- Monday, November 9, 02:30 (Zurich) — China CPI: 0.8 expected (previous 0.9). Stakes: a cooling would weigh on global demand and on risk appetite.
- Tuesday, November 10, 04:00 (Zurich) — China trade: exports 33 (previous 36.3), imports 33 (previous 31), balance 125 (previous 133.53). Stakes: weak exports would signal softer external demand.
- Tuesday, November 10, 14:30 (Zurich) — US CPI: core month-on-month 0.2% expected (previous 0.3%), index level 337.023 against 330.654. Stakes: the main volatility catalyst, and a hot surprise would weigh on Bitcoin.
- Thursday, November 12, 08:00 (Zurich) — UK GDP quarter-on-quarter, preliminary: 0.7% expected (previous 0.4%). Stakes: a secondary signal for the Bank of England’s path and for risk appetite.
- Friday, November 13, 14:30 (Zurich) — US PPI month-on-month: 0.4% expected (previous 1.3%). Stakes: a second test of inflation pressure, able to confirm or challenge the November 10 reading.
Three Scenarios for the Coming Weeks
The three scenarios below cover the coming weeks. The first favors a continuation of the correction while price remains below $76,500. The probabilities are the analyst’s and total 100%.
Scenario A — Rejection below $76,500 and drift toward the SMA200 (probability 50%)
The most likely trigger is US inflation on November 10 at 14:30: a print at or above consensus (0.2%) would be unfavorable. A failure below the $76,270–$76,520 zone, or a breakdown under the M15 triangle below $75,810 followed by an H4 close under $75,100, would open the way toward $74,100, the first magnet for liquidatable longs, then $73,200, the daily SMA200 and the $73,170–$73,450 pocket. The risk/reward ratio (R:R) is about 1.9 toward $74,100 and 2.7 toward $73,200. Execution zone: sell rebounds between $76,270 and $76,520, around $76,400. Invalidation: H4 close above $77,600, which implies $1,200 of risk, above the H4 ATR of about $960.
Scenario B — Liquidity sweep of the long pocket, then range rebound (probability 35%)
This scenario assumes a soft US inflation print on November 10, or simply absorption of the liquidations. A wick toward $74,100–$74,850 followed by a reclaim above $75,100 would fit the H4 bullish divergence and allow a range rebound toward $76,270, then $77,550, the H4 SMA50. The risk/reward ratio (R:R) is about 2.2 toward $77,550. Execution zone: buy near $75,000 after a confirmed recovery. Invalidation: H4 close below $73,850, which implies about $1,150 of risk, above the H4 ATR.
Scenario C — Invalidation of the bearish bias (probability 15%)
A disinflationary surprise, followed by an equity rebound around November 10 to 13 with the PPI on the 13th as a second test, could revive the market. The trigger requires an M15 close above $76,300, then an H4 close above $77,550 and a daily close above $79,400, which correspond to the daily SMA20 and the H4 triple top. Targets are $78,850, then $82,500–$83,600, the estimated short pocket. The daily double bottom at $84,340, targeting $88,640, remains an unconfirmed hypothesis. Execution zone: buy on a pullback toward $77,500 after the break. Invalidation: return below $76,300 on an H4 close.
Summary and Conclusion
The phase is an orderly correction below the SMA50. The targets of the bearish patterns, $77,680 on the daily and $76,430 on the H4, have been reached, and price rests on the $74,100–$75,100 zone. Flows support this reading: five consecutive sessions of IBIT outflows totaling roughly $1B, $869.8M of net weekly outflows per Decrypt, and 88% of liquidations on the long side. The M15 rebound and the H4 bullish divergence only signal a pause, which needs confirmation above $77,550.
The dominant technical strategy retained by the analyst is to sell rebounds below $76,500, with protection above $77,600, and to wait for a recovery above $75,100 after a sweep before considering a tactical bounce. A daily close below $73,200 would open the way toward $67,100. Critical levels: $76,270–$76,520 (M15 ceiling and R1 pivot), $74,800–$75,100 (November 6 low), $73,200 (daily SMA200), $77,550 (H4 SMA50) and $79,400 (daily SMA20, invalidation of the bearish bias).
Sources
- Bitcoin ETFs Bleed $430 Million as Tech Rout Tests Wall Street Buyers — Decrypt, November 6, 2026
- Crypto Liquidations Top $1 Billion as Bitcoin Tests 11-Week Low — Decrypt, November 6, 2026
- Bitcoin price dips under $75K as crypto markets miss tech-stock rebound — Cointelegraph, November 6, 2026
- Crypto ETFs see over half a billion dollars in outflows amid post-midterm market slide — The Block, November 6, 2026
- Elliptic says Binance hackers swap stolen tokens for $124M in bitcoin — The Block, November 6, 2026
- Strive buys 15,124 Bitcoin in October — Cointelegraph, November 6, 2026
- Russia Approves Bitcoin, Ether and USDT for Retail Trading — Cointelegraph, November 6, 2026
- Treasury Cuts Crypto Exchange MEXC Off From US Financial System — Decrypt, November 6, 2026
- US Treasury Walks Back Crypto Surveillance Travel Rule Proposal — The Block, November 6, 2026
- Trump administration moves closer to allowing crypto in 401(k) retirement plans — The Block, November 6, 2026
- What Democrats’ US midterm sweep means for the CLARITY Act — Cointelegraph, November 6, 2026
- US job growth expected to pick up in October, with moderation in wage gains — Reuters, November 6, 2026
- SEC Proposal Would Address How Investment Advisers and Funds Can Custody Crypto Assets — sec.gov, dated September 30, 2026 (press release of October 1, 2026)
- Bitcoin ETF Flow (US$m) — Farside Investors, date not specified
- Economic and crypto calendar (Zurich time) — provided with the request, November 7, 2026
Disclaimer: This article is for educational and informational purposes only. It does not constitute investment advice, a recommendation to buy or sell, or an invitation to trade any financial asset. Cryptocurrency markets are extremely volatile; any investment decision should be based on your own research (DYOR) and, where appropriate, the advice of a licensed financial adviser.

