


- Bitcoin has rebounded about 5% from its $55,127 cycle low but remains below its key moving averages in a bearish trend.
- Driver: leverage flush, ETF outflows (about $3.5B in November) and a restrictive Fed still leaning toward further hikes.
- Watch: the November 25 PCE print, the November 27 Deribit expiry and the $61,750–$62,750 resistance zone.
Bitcoin trades near $58,140 on November 21, after touching a cycle low of $55,127 earlier in the session. The drawdown from the $87,385 peak of September 21 now stands at 33%, a slide that accelerated over roughly twenty sessions and shed about 25% before a rebound of around 5% from the low. The break below $60,000 for the first time since July marks a capitulation phase inside a trend that is turning over.
The immediate engine is a leverage flush. According to Bitcoin Magazine (November 20), the Nasdaq fell about 5%, the S&P 500 3.5% and Nvidia 12.5% during the session, liquidating $1.53B of crypto positions. US spot ETFs recorded $582M of outflows on Thursday according to The Block (November 21), and November is already approaching $3.5B of cumulative outflows. On the derivatives side, open interest fell 9% over 24 hours and 15.5% over seven days according to Binance, while funding is nearly flat: the market is deleveraging without residual euphoria.
The macro regime remains restrictive. According to Bitcoin Magazine (November 20), Fed official Musalem sees up to four rate hikes by spring 2027, while Treasury Secretary Bessent argues against a 50-basis-point increase at the December 8-9 meeting. MarketWatch (November 20) notes that the Fed remains focused on inflation despite the equity sell-off. Recent releases were mixed: US core retail sales came in at 0.6% against 0.4% expected on November 17 (prior 1.1%), and initial jobless claims printed 203,000 against 197,000 expected on November 19. In Japan, core inflation came in at 2.2% against 2.3% expected, and the Nikkei slipped 2.1% after the release (CNBC, November 20). The Bank of Japan has a 72% probability of a December hike, according to the same outlet.
Two further readings deserve attention. Strategy’s investor relations head attributes the pullback to a rotation into AI after the Anthropic IPO (Bitcoin Magazine, November 20), a view from an interested party, while ARK is trimming its crypto ETFs as it buys Anthropic (Decrypt, November 20). On the supply side, JPMorgan estimates production costs at $86,000, a gap of more than $26,000 below $60,000 that pushes the highest-cost miners to sell (The Block, November 20). These factors explain why the technical read stays bearish until the rebound changes the market structure.
Multi-Timeframe Technical Analysis
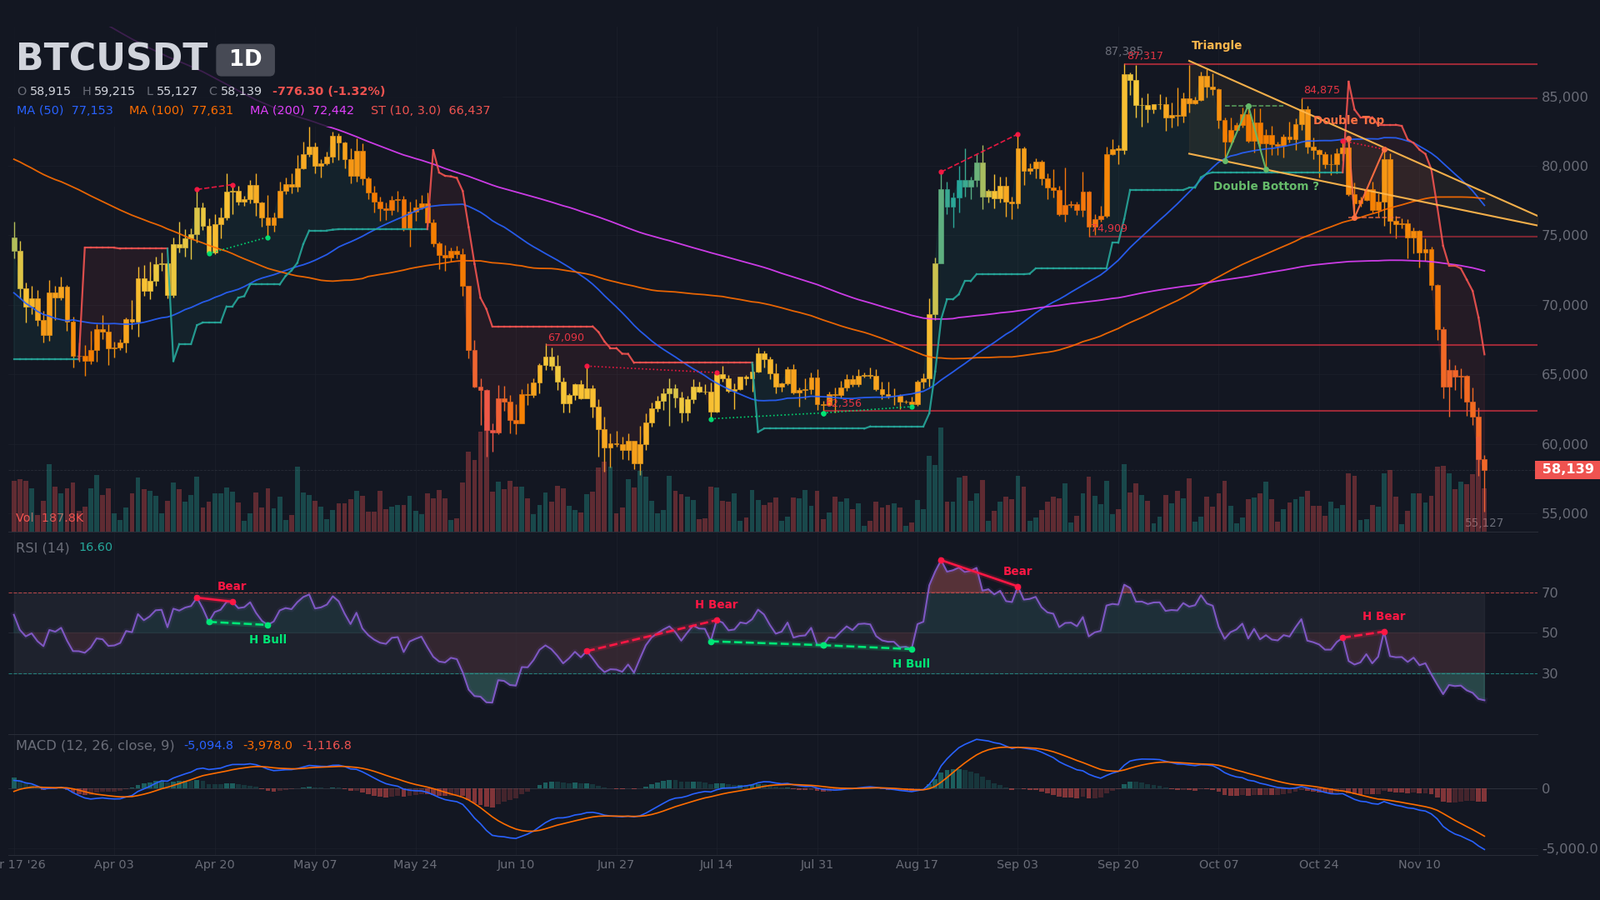
Daily Timeframe (1D): Capitulation Under a Confirmed Double Top
The weekly context points to a reversal rather than a simple correction: six consecutive weeks of decline, a current week down 11%, and price below both the weekly SMA10 (about $77,500) and SMA20 (about $73,600), with weekly RSI near 35. That backdrop places the current move inside a broader bearish trend rather than a pause within a range.
The daily chart is in an established trend (ADX about 47, DI- about 44 against DI+ about 5) and in a bearish impulse phase: peaks and troughs are descending, and the close has slipped below the last low at $61,960. Price sits under the SMA20 (about $70,060), SMA50 (about $77,150) and SMA200 (about $72,440), with no 50/200 crossover detected, and the SuperTrend remains bearish at about $66,440. The bearish double top is confirmed, with a neckline at $76,270 and a $70,970 target that has been far exceeded, so the pattern no longer carries the argument on its own. The Fibonacci retracement of the major impulse, from $87,385 (September 21) to $55,127 (November 21), places price at a 9% retracement. The next rebound levels are $62,740 (23.6%) and $67,450 (38.2%), while a break of the low would open the 1.272 extension toward $46,350.
The daily RSI at 17 and falling signals deep oversold conditions. No daily bullish divergence is detected; only a recent hidden bearish divergence, a continuation signal, appears in the data (October 28 to November 4). The MACD remains below its signal line and below zero since the bearish crossover of September 29, with a histogram clearly negative. The full candle of November 20 weighs 2.4 times the 20-period average volume, a capitulation volume that validates the breakdown, while the current candle at roughly 1.0 times average volume is still provisional. Price trades below the value area ($59,160–$78,650), which explains the speed of moves, and the $64,200 point of control is the first genuine volume resistance.
Intermediate Dynamics (4H): Bearish Impulse Below the Moving Averages
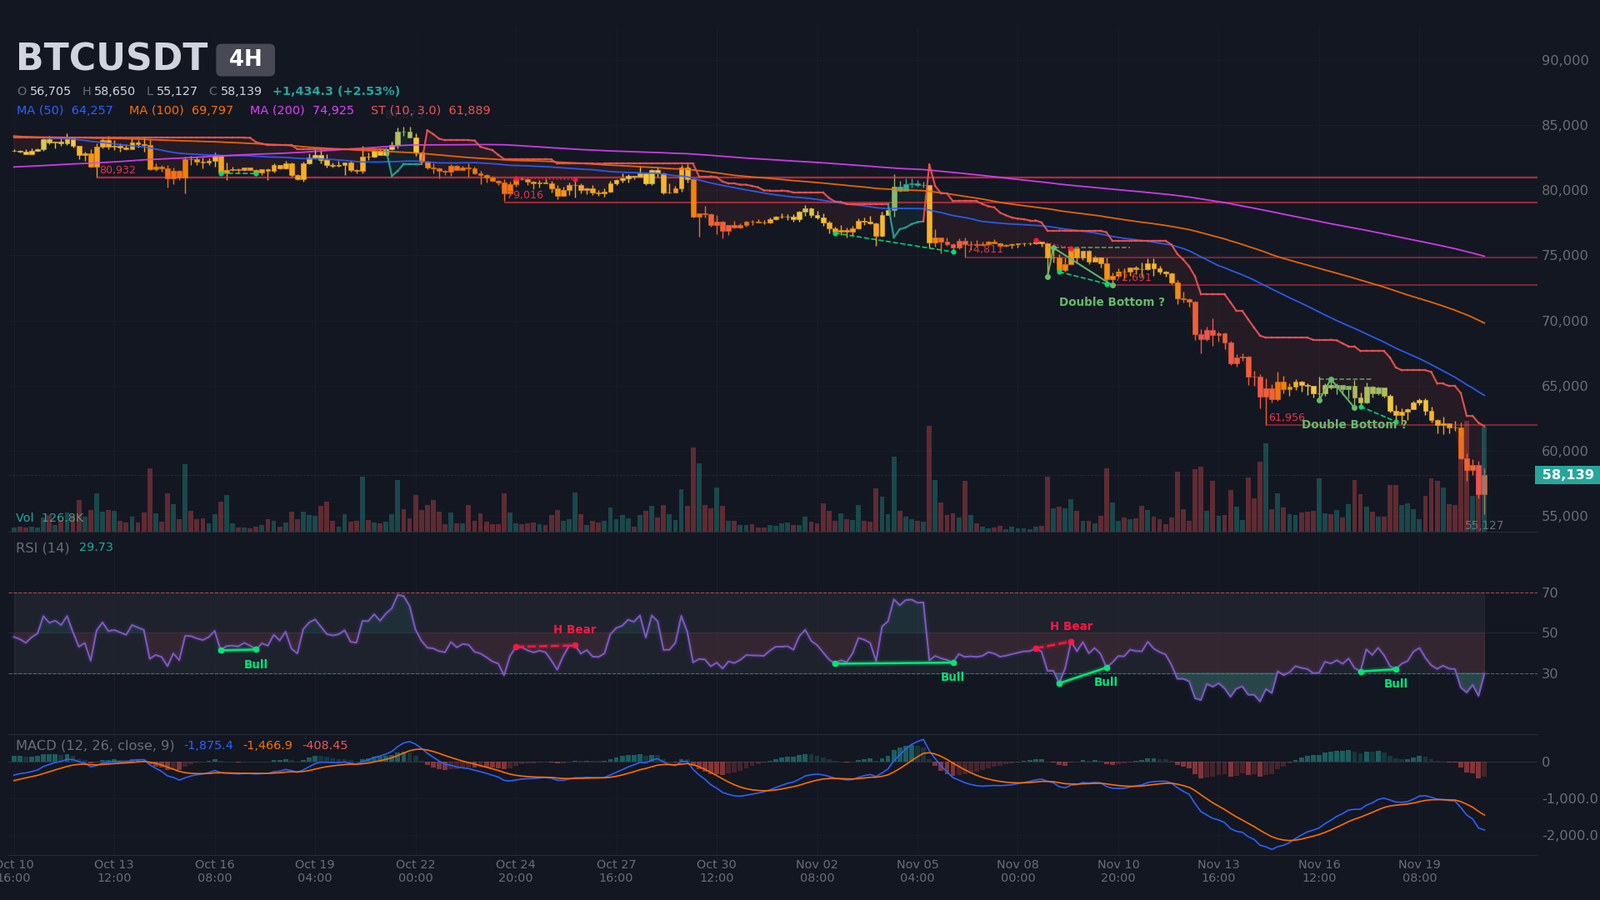
The 4H chart confirms the daily picture. An ADX near 56 and a DI- at 40 point to a trending regime, the structure stays descending, the close has slipped below the last low, and the SuperTrend is bearish at $61,890. Price trades below the SMA20 (about $61,900), SMA50 (about $64,260) and SMA200 (about $74,930). The MACD has been bearish since November 20, under its signal line and zero. Bollinger Bands are expanding (rank 93), with price hugging the lower band (about $57,385). The 4H RSI (about 30) is recovering from oversold territory, but the regular bullish divergence of November 17-18 failed to produce a durable rebound, and price then fell from $63,400 to $55,130. The 4H double bottom, with a neckline at $65,500 and a $67,410 target, remains unconfirmed: it is a hypothesis, far from the current price.
On the recent impulse, from $74,771 on November 11 to $55,127, the 23.6% Fibonacci level sits at $59,760 and the 38.2% level at $62,630, which reinforces the $61,750–$62,750 zone as the natural ceiling of the rebound. The last complete 4H candle prints 1.3 times average volume, while the November 20 spike at 3.1 times average confirms the capitulative nature of the decline. The current bounce does not yet carry the signature of a trend reversal on this timeframe.
Intraday Structure (15m): Confirmed Double Bottom and Wedge Exit
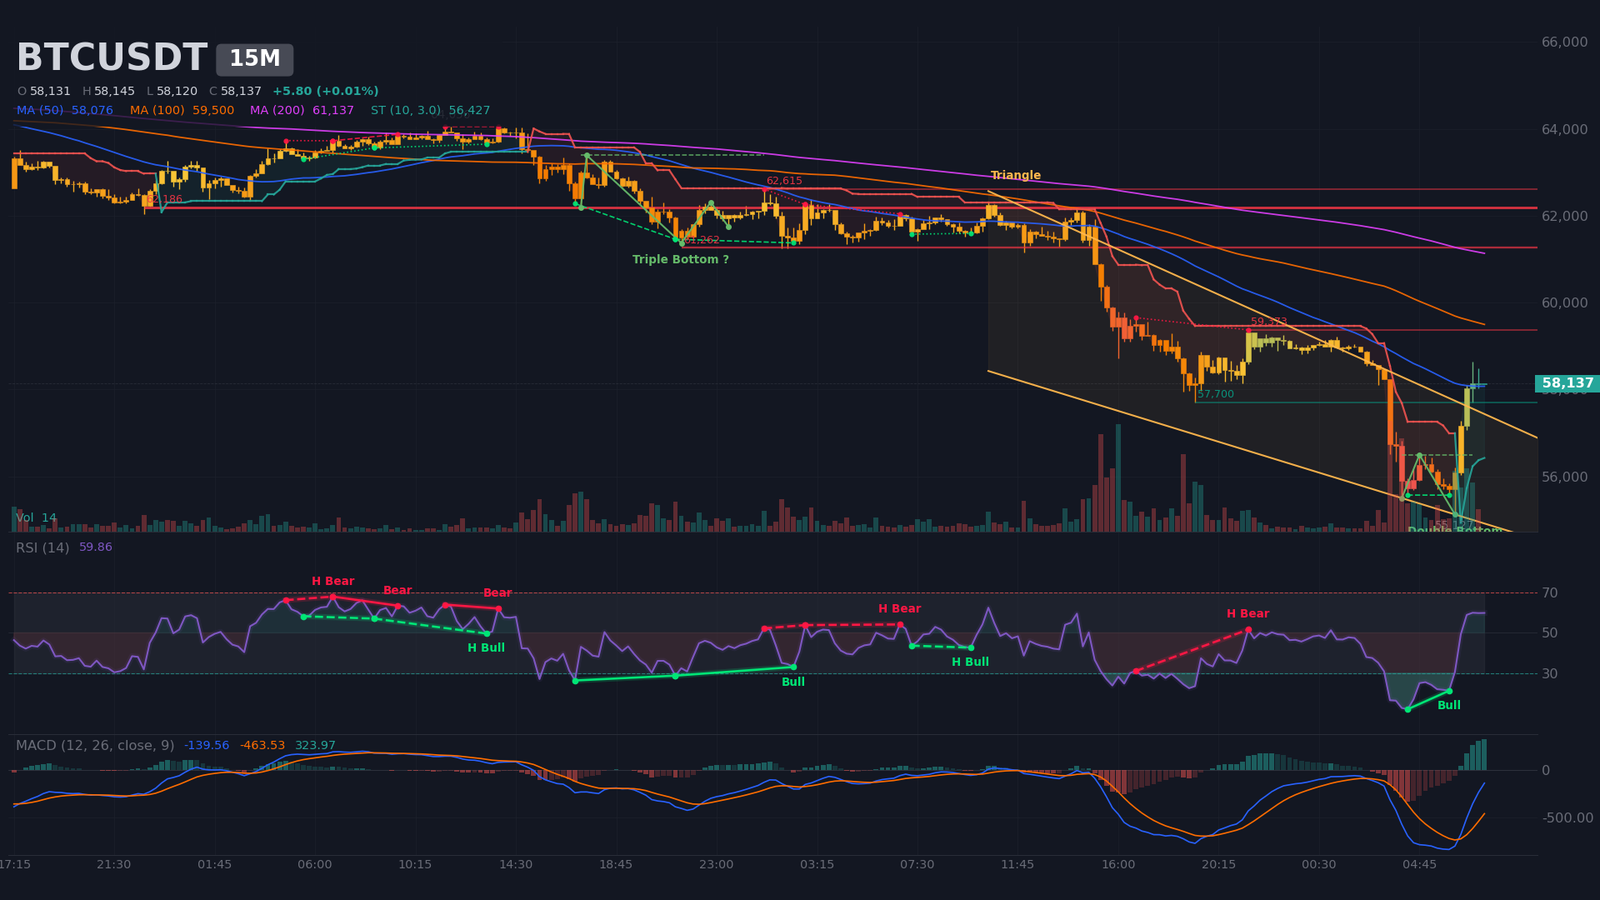
On the 15-minute chart, the structure has flipped higher. Price closed above the last peak at $56,500, the SuperTrend is bullish at about $56,430, a bullish MACD crossover occurred on November 21, the RSI hovers near 60, and the DI+ sits above the DI- (ADX about 37). The double bottom is confirmed on a $56,500 neckline and its $57,680 target has been reached, while price has pushed above the upper boundary of the wedge ($57,740), which the analyst reads as a bullish exit. The regular bullish divergence, with RSI climbing from 12 to 21 overnight, preceded the move.
The last complete candle carries only 0.7 times average volume, while the overnight wick reached 18.8 times average volume, so the bounce lacks conviction. Intraday bounds are support at $57,700, then $56,430–$56,500, and resistances at $59,370 (1 contact), $61,260 (3 contacts) and $62,190 (6 contacts). This bounce is a short-term trigger, not a change of bias.
Multi-Timeframe Summary
| Timeframe | Dominant trend | RSI (14) | MACD | Chart pattern |
|---|---|---|---|---|
| Daily (1D) | Bearish (capitulation) | ~17 (oversold) | Bearish, below signal and zero (crossover on 09/29) | Confirmed double top (target reached) |
| 4 hours (4H) | Bearish (impulse) | ~30 | Bearish (crossover on 11/20) | Unconfirmed double bottom (hypothesis) |
| 15 minutes | Intraday bullish rebound | ~60 | Bullish (crossover on 11/21) | Confirmed double bottom (target reached) |
Pivot Levels and Technical Map
The zones below intersect daily pivots, the Fibonacci retracements of the Daily and 4H impulses, moving averages, detected resistances, the volume profile and liquidation pockets estimated by model. The short-term central pivot sits between $59,350 and $59,800: it marks the frontier between the intraday bounce and a resumption of the decline. The thesis pivot zone, $61,750–$62,750, is where the R1 pivot (about $61,790), the 4H SMA20, the 23.6% Fibonacci of both the 4H and Daily charts, and the Daily resistance at $62,360 overlap.
| Level | Price (USD) | Category | Technical basis |
|---|---|---|---|
| Major resistance 3 (R3) | $65,900 – $67,500 | Daily | Fibonacci 38.2% ($67,450), Daily resistance $67,090, R3 pivot ($66,700), estimated short pockets ($66,140 and $67,410), Daily SuperTrend |
| Major resistance 2 (R2) | $63,900 – $64,700 | Daily/4H | Point of control ($64,200), 4H SMA50 ($64,260), R2 pivot ($64,660) |
| Immediate resistance (R1) | $61,750 – $62,750 | Daily/4H | R1 pivot ($61,790), 4H SMA20, 4H SuperTrend, 23.6% Fibonacci on 4H and Daily, resistances at $62,190 and $62,360 |
| Central pivot (P) | $59,350 – $59,800 | Intraday | Daily pivot ($59,740), recent 4H 23.6% Fibonacci ($59,760), M15 resistance ($59,370) |
| Immediate support (S1) | $56,400 – $57,350 | Daily/M15 | S1 pivot ($56,870), estimated long pocket ($57,190-$57,340), Daily lower band ($56,740), M15 neckline and SuperTrend |
| Major support 2 (S2) | $54,800 – $55,200 | Daily | S2 pivot ($54,830), cycle low of November 21 ($55,127) |
| Major support 3 (S3) | $51,950 – $52,700 | Daily/M15 | S3 pivot ($51,960), estimated long pocket ($52,270-$52,590), M15 1.272 extension ($52,700) |
Order Book and Liquidity Heatmap
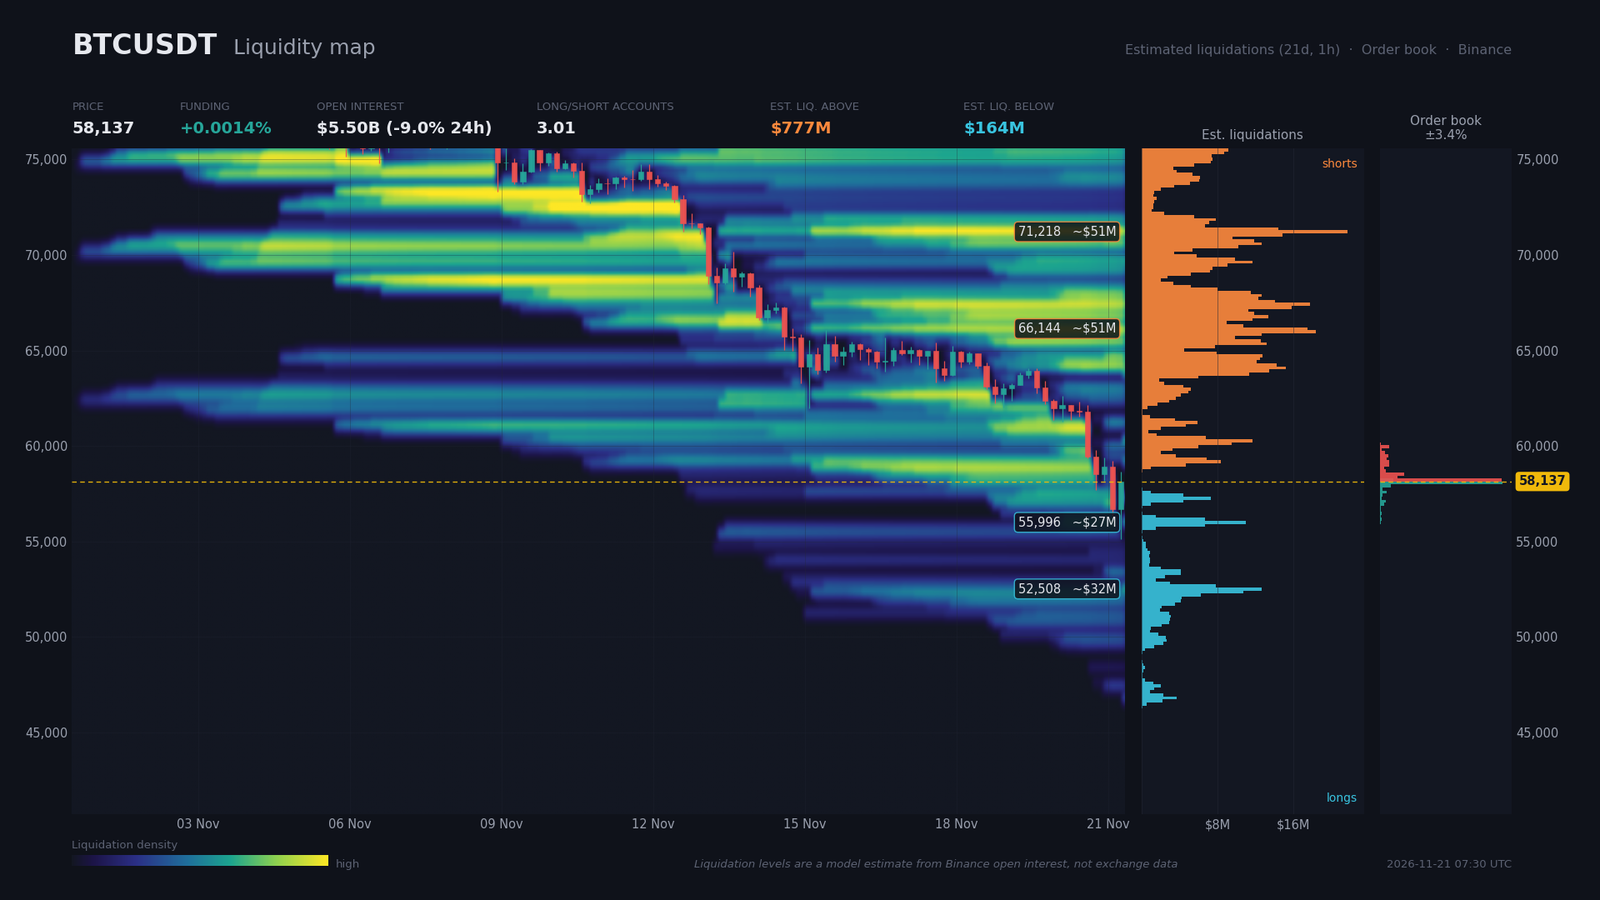
Binance order-book coverage reaches 3.4% around the price. Sell walls sit at $58,220 ($31M, +0.14%), $58,530 ($6.2M) and $59,010 ($2.3M), while buy walls are at $58,060 ($31M, 0.14% below the market), followed by much smaller levels at $57,900 and $57,580. The 2% depth imbalance tilts 7.9% toward sellers ($42M of bids against $49M of asks). The two large walls frame the price and mainly describe an area of immediate indecision.
Estimated liquidation zones (modeled, not measured) are asymmetric: roughly $777M of shorts sit above the price, with peaks at $66,140 ($50M, 13.8% above the market), $67,410 ($46M) and $71,220 ($51M), against roughly $164M of longs below, at $57,260 ($18M), $56,000 ($27M) and $52,510 ($32M). Funding is neutral (about 1.5% annualized), open interest is contracting sharply, the account-level long/short ratio (about 3.0) remains heavily tilted toward buyers, and the taker buy/sell ratio (about 0.94) reflects persistent selling aggression.
Mechanically, a squeeze toward $66,000–$67,500 remains possible, since the estimated shorts attract price. The long base nonetheless remains vulnerable to a fresh liquidity sweep toward $56,000, and possibly $52,500.
Calendar: Catalysts to Watch
The calendar for the coming days is dominated by US macro data. The events retained below run from nearest to furthest, with their consensus or prior reading.
- Tue, Nov 24, 16:00 (Zurich) — CB Consumer Confidence (consensus 92.5, prior 91.7): a read on domestic demand and on risk appetite for cyclical assets.
- Wed, Nov 25, 14:30 (Zurich) — Core PCE m/m (consensus 0.3%, prior 0.4%): an upside surprise would reinforce bets on further rate hikes, which weigh on BTC.
- Wed, Nov 25, 14:30 (Zurich) — Preliminary GDP q/q (consensus 2.3%, prior 6.4%), released in the same window as personal spending (0.4% expected) and durable goods (0.4% expected, prior 1.8%): a test for growth and monetary policy.
- Fri, Nov 27, 09:00 (Zurich) — Monthly BTC and ETH options expiry on Deribit: a volatility catalyst, with possible pinning effects around strike prices.
- Fri, Nov 27, 16:00 (Zurich) — Monthly CME futures settlement: an institutional reference point for futures positions.
- Mon, Nov 30, 02:30 (Zurich) — China NBS non-manufacturing PMI (prior 49.7): a gauge of Asian risk appetite, with secondary effects.
Three Scenarios for the Coming Weeks
The three scenarios cover a one-to-two-week horizon and rest on the probabilities set by the analyst, which total 100%. Scenario A is the most likely, because the trending regime (very high ADX on the Daily and 4H charts, with DI- dominant) and a restrictive Fed weigh on any rebound. Scenario B keeps a meaningful weight because of extreme oversold conditions (Daily RSI at 17) and the imbalance in estimated liquidations.
Scenario A — Oversold Bounce Rejected, Decline Resumes (probability 45%)
The trigger is a bounce toward $61,000–$62,000 rejected on the 4H chart below the R1 zone ($61,750–$62,750), ahead of the November 25 PCE print. The path leads first to $56,900 (S1), then $54,800–$55,200 (S2) and, if the low gives way on a 4H close, $52,000–$52,700 (S3). The risk-reward ratio (R:R) comes out near 2.9: ($61,500 − $56,900) ÷ ($63,100 − $61,500) = 4,600 ÷ 1,600. Execution zone: sell at $61,500. Invalidation: a 4H close above $63,100, above the Daily 23.6% Fibonacci ($62,740) and more than one 4H ATR (about $1,540) away.
Scenario B — Bullish Liquidity Sweep (probability 35%)
The trigger is a 4H close above $59,800, which would mean an exit from the pivot zone. The long case then rests on the M15 wedge exit and on the short pockets sitting above price. The path targets $64,200 (point of control, R2), then $66,150 (short pocket, Daily SuperTrend), with a rejection likely. The R:R is about 2.1: ($64,200 − $59,800) ÷ ($59,800 − $57,700) = 4,400 ÷ 2,100. Execution zone: $59,800. Invalidation: a 4H close below $57,700, the M15 support sitting above S1.
Scenario C — Invalidation, Reversal (probability 20%)
The trigger is a daily close above $67,500, which would validate a reversal of the structure. The path leads to $70,000–$71,300, the zone of the Daily SMA20, the 50% Fibonacci and an estimated short pocket. Execution zone: retest of $67,500. Invalidation: a daily close below $64,200.
The signal to watch: a 4H close above $62,750 on above-average volume would open scenario B, while a daily close above $67,500 would validate scenario C. As long as the $61,750–$62,750 zone holds and price stays below $63,100 on a 4H close, the dominant read remains rejection.
Summary and Conclusion
Overall, the structure is that of a bearish impulse in capitulation, inside a confirmed weekly reversal. Flows (ETF outflows, equity risk, a restrictive Fed) support this reading. Derivatives show deleveraging without excess funding, and whale behavior remains ambiguous: CryptoQuant reports a 2.5% rise in balances to 3.02M BTC over 30 days without distinguishing purchases from internal consolidations, while Swiss Whale Intelligence notes a net inflow of 8,616 BTC to exchanges and a Fear & Greed index at 12. The 18,720 BTC stolen in the Binance hack remain dormant (The Block, November 21), a potential overhang of supply that should not be overinterpreted. No regulatory catalyst weighs on the market in the short term.
The dominant technical strategy is to sell the rebound in the $61,750–$62,750 zone, with protection above $63,100 on a 4H close, while acknowledging the risk of a squeeze toward $64,200–$66,150. A daily close above $67,500 would invalidate this reading. Critical levels to watch: $59,350–$59,800 (short-term pivot), $61,750–$62,750 (thesis pivot zone), $54,800–$55,200 (cycle low) and $67,500 (Daily invalidation).
Sources
- JPMorgan says bitcoin’s price drop pressures miners, Senate passes ‘Death Bets Act’, and more — The Block, 21/11/2026
- JPMorgan says bitcoin price correction widens gap to estimated $86,000 production cost — The Block, 20/11/2026
- Bitcoin falls below $60K for first time since July amid broader market selloff — Cointelegraph, 20/11/2026
- Bitcoin Price Slips to Lows Not Seen Since 2024, Nasdaq Plunges 5% — Bitcoin Magazine, 20/11/2026
- U.S. Treasury Secretary Pushes Back on Bigger Fed Hike — Bitcoin Magazine, 20/11/2026
- MSTR Head of Investor Relations Addresses Bitcoin Pullback, Equity Performance — Bitcoin Magazine, 20/11/2026
- Tracy Schuchart: Bitcoin Trading ‘Like a Risk Asset’ as Fed Hikes Loom — Bitcoin Magazine, 20/11/2026
- The Fed is too busy fighting inflation to rescue the stock market — MarketWatch, 20/11/2026
- Japan core inflation soars to highest this year as energy subsidy expiry pushes up consumer prices — CNBC, 20/11/2026
- Cathie Wood Bets $91M on Anthropic IPO While Paring Crypto Exposure — Decrypt, 20/11/2026
- Binance hack laundering ramps up as $149 million in bitcoin mixed through coinjoins: Elliptic — The Block, 20/11/2026
- Bitcoin whale balances climb 2.5% to 3.02 million BTC — Crypto Briefing, 18/11/2026
- BTC Closes Down 2% as Fear Peaks; Whales Deposit $548M to Exchanges — Swiss Whale Intelligence, 17/11/2026
Disclaimer: This article is for educational and informational purposes only. It does not constitute investment advice, a recommendation to buy or sell, or an invitation to trade any financial asset. Cryptocurrency markets are extremely volatile; any investment decision should be based on your own research (DYOR) and, where appropriate, the advice of a licensed financial adviser.

