


Bitcoin is currently trading around $78,800, after surging more than 22% in just a few trading sessions. A move of this magnitude is not isolated speculation — it originated from a U.S. monetary policy decision that triggered one of the most violent short squeezes in the history of crypto derivatives markets. Bitcoin’s market cap has crossed $1.586 trillion, within a total crypto market now valued at $2.64 trillion.
This analysis provides a complete breakdown of the situation: the macroeconomic backdrop behind the rally, the mechanics of the short squeeze, institutional ETF flows, order-book liquidity mapping (heatmap), a multi-timeframe technical study (daily, 4-hour, 15-minute), and probabilistic projections for the months ahead.

The macro catalyst: U.S. Treasury bond buybacks
The rally that pushed Bitcoin from around $62,800 to intraday highs near $80,000 was directly triggered by an announcement from U.S. Treasury Secretary Scott Bessent on August 19, 2026. Washington doubled the cap on its long-term bond buyback operations, raising it from $2 billion to a minimum of $4 billion per operation, effective between September 9 and November 4, 2026. The policy specifically targets maturities in the 10-to-20-year and 20-to-30-year ranges.
The context matters: U.S. public debt had just crossed the $40 trillion threshold, while the 30-year Treasury yield had reached 5.34%, its highest level since June 2007. By aggressively buying back these bonds, the Treasury mechanically pushed their prices up and yields down, with the 30-year yield quickly retreating to around 5.19%.
Former hedge fund manager Arthur Hayes, through his firm Maelstrom, described this as nothing less than disguised monetary stimulus: the liquidity largely stems from the collapse of the Fed’s Reverse Repo Program balances, which fell from nearly $2.5 trillion to roughly $100 billion. Once released, this liquidity floods private markets and revives fears of currency debasement — a phenomenon known as the “debasement trade.” Geoff Kendrick, Head of Digital Assets Research at Standard Chartered, called the Treasury’s announcement a perfect catalyst for Bitcoin, an asset designed precisely to offer an exit from monetary interventions.
On the political front, the U.S. president’s call on Congress to quickly pass the “Clarity Act” adds another tailwind, promising a clear regulatory framework for digital assets.
Anatomy of an institutional short squeeze
Bessent’s announcement caught a market heavily positioned short after the summer correction off guard. The break of key resistance levels triggered a cascade of forced short liquidations, forcing risk-management algorithms to buy back the underlying asset at any price. This episode ranks among the seven largest liquidation events in crypto market history, with total market capitalization rising by roughly $280 billion in 24 hours.
| Liquidation metric | Estimated amount |
|---|---|
| BTC liquidations (lower estimate) | ≈ $320.6 million |
| BTC liquidations (higher estimate) | ≈ $324 million |
| Global crypto liquidations (24h) | ≈ $1.0 billion |
| Share of longs liquidated | ≈ $862 million (85%) |
After running into resistance around $80,000, the market reversed, triggering the liquidation of overleveraged long positions in turn. Persistent concerns over “sticky” inflation also tempered expectations for further Fed easing: markets currently price a 67% probability that the Fed holds rates steady at its next meeting.
ETF flows and Bitcoin dominance
U.S. Spot Bitcoin ETFs continue to act as a major institutional shock absorber. On August 25, roughly $314 million in net inflows were recorded, extending a seven-day streak totaling $2.569 billion. BlackRock’s IBIT alone accounts for about 90.5% of these recent flows. Since their January 2024 launch, ETFs have cumulatively pulled in around $56.9 billion, steadily draining available spot supply.
Bitcoin dominance (BTC.D) stands at 58.8%, compared to 11.1% for Ethereum. Excluding stablecoin market cap — which represents parked liquidity awaiting deployment rather than genuine speculative demand — Bitcoin’s real dominance exceeds 64.4%. It has not dropped below the 50% mark since September 2023, the longest uninterrupted period of dominance since the 2017 cycle.
CoinSwitch’s Q2 2026 report also reveals a sharp generational divide: Gen Z investors (18-25), who drive mass adoption and make up 54.4% of new market participants, show the most speculative behavior and are the only cohort selling more than they buy. Older cohorts (36 and above), by contrast, favor structural diversification across Bitcoin, Ethereum, and historically resilient assets.
Liquidity mapping: reading the order-book heatmap
The order-book heatmap reveals where institutional players have placed their defensive and offensive orders. Thick bands of sell-side liquidity are concentrated above $80,000, with a particularly dense line identified at $81,273 — an ask wall that explains the recent technical rejection at that level.
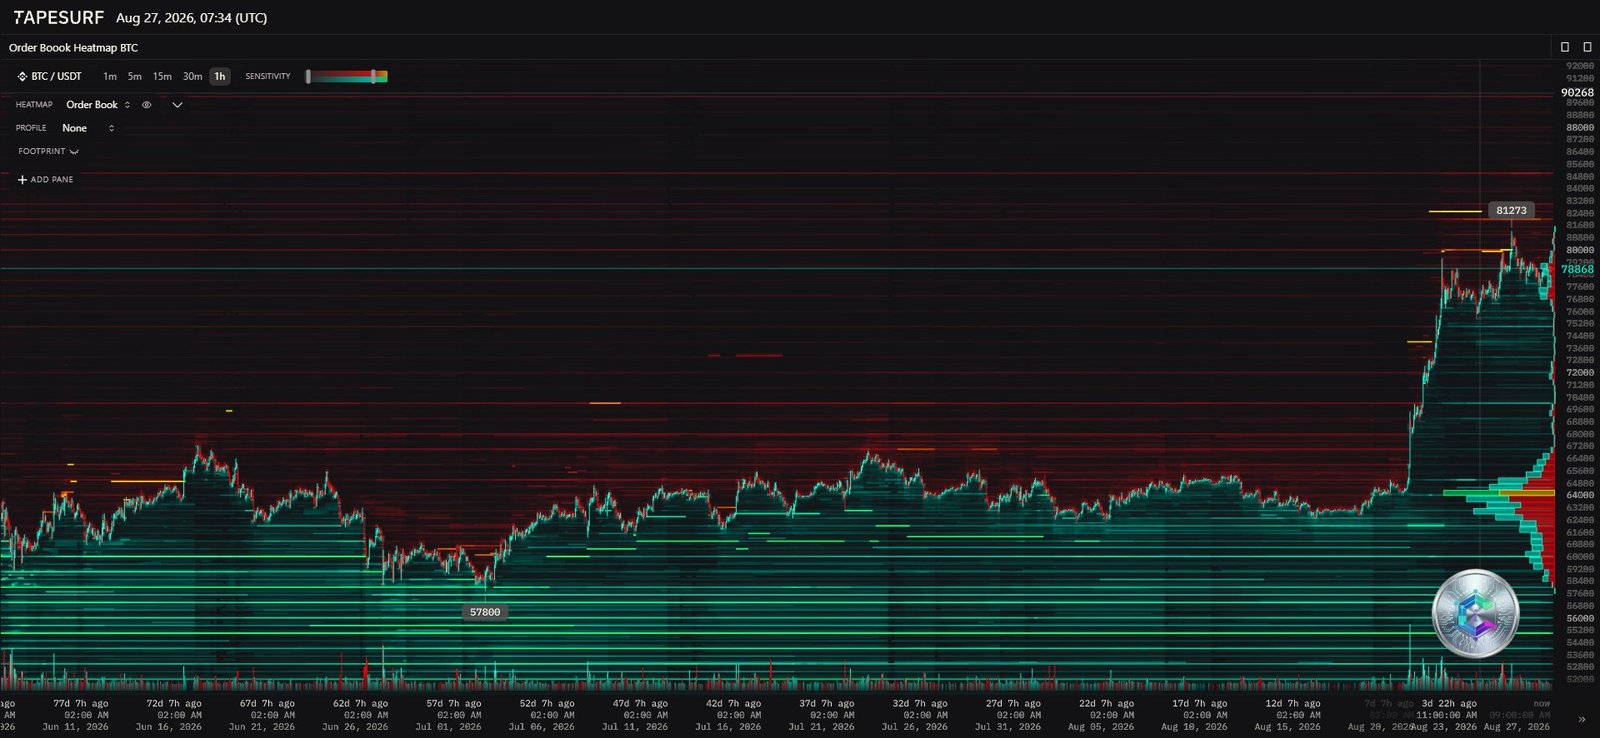
Conversely, the lower part of the chart shows robust buy-side liquidity, stacked between $64,000 and forming a solid landing cushion down to a high-density floor near $57,800. This asymmetric structure — a broad, layered support against a concentrated near-term resistance — supports a fundamentally bullish read on the market, currently capped by a need for volatility decompression.
Multi-timeframe technical study
Daily chart: the macro structure
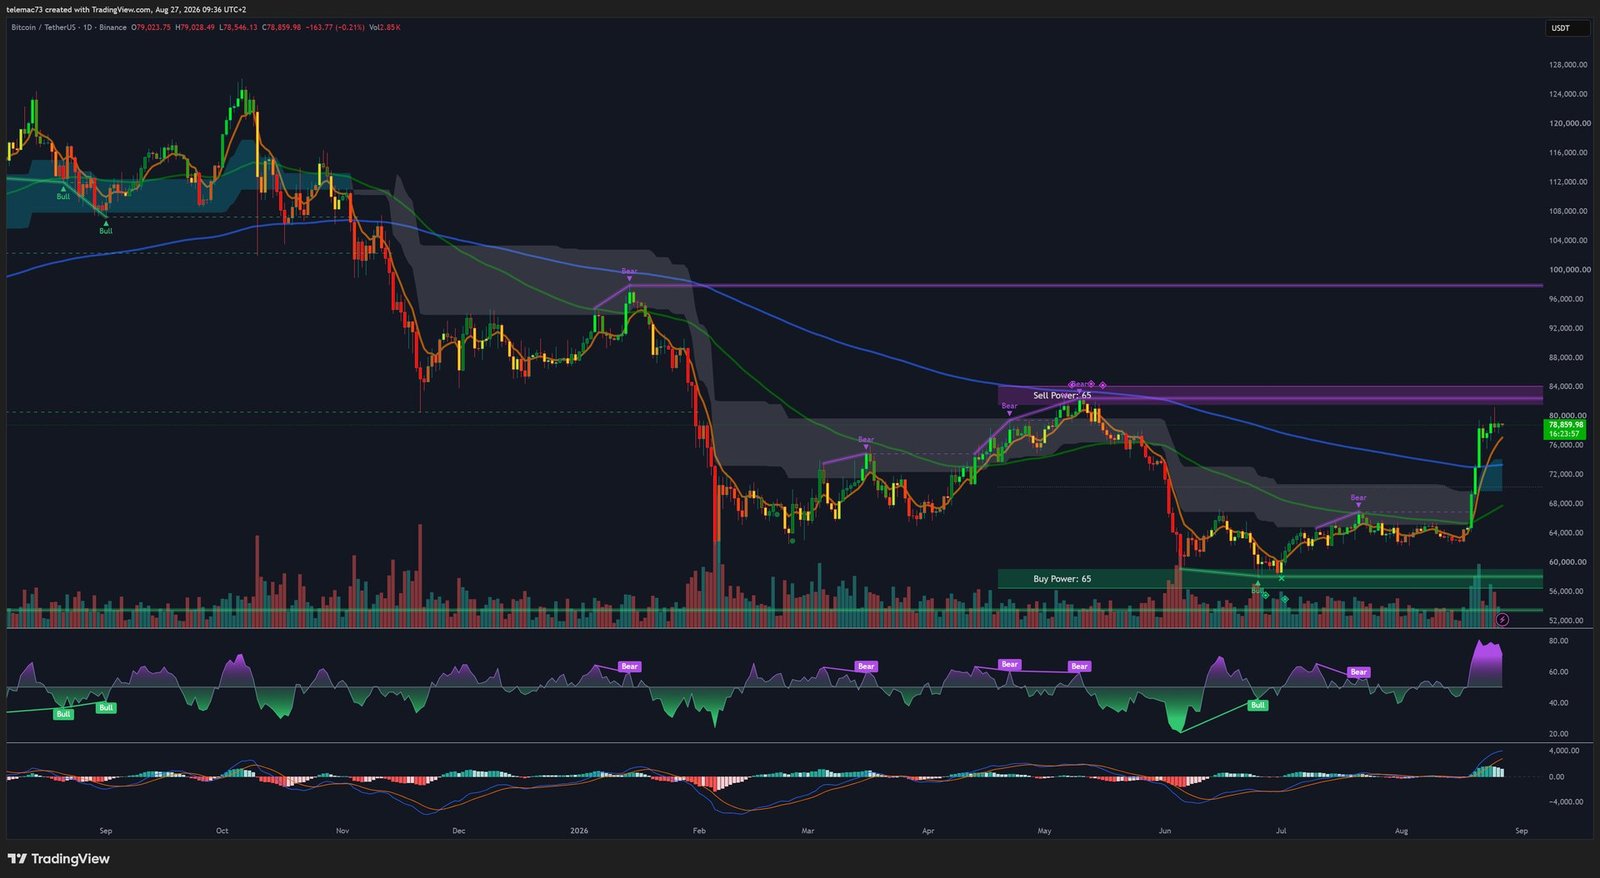
The daily chart shows an asymmetric “V” structure, typical of institutional markets purging excess leverage before a new expansion phase. After a drop toward $52,000, the ensuing rebound saw the price sharply break through the Ichimoku cloud. A major support (“Buy Power: 65”) is now firmly defended around $58,000, while resistance (“Sell Power: 65”) sits near $82,000 — consistent with the wall identified on the heatmap.
Price is trading well above the 50- and 200-day simple moving averages, potentially setting up a “Golden Cross.” The daily RSI, after pushing past 70 into overbought territory, is easing back to around 65 — a healthy pullback rather than a reversal signal. The MACD still shows a bullish divergence, though the histogram is starting to show signs of flattening.
4-hour chart: bull flag consolidation
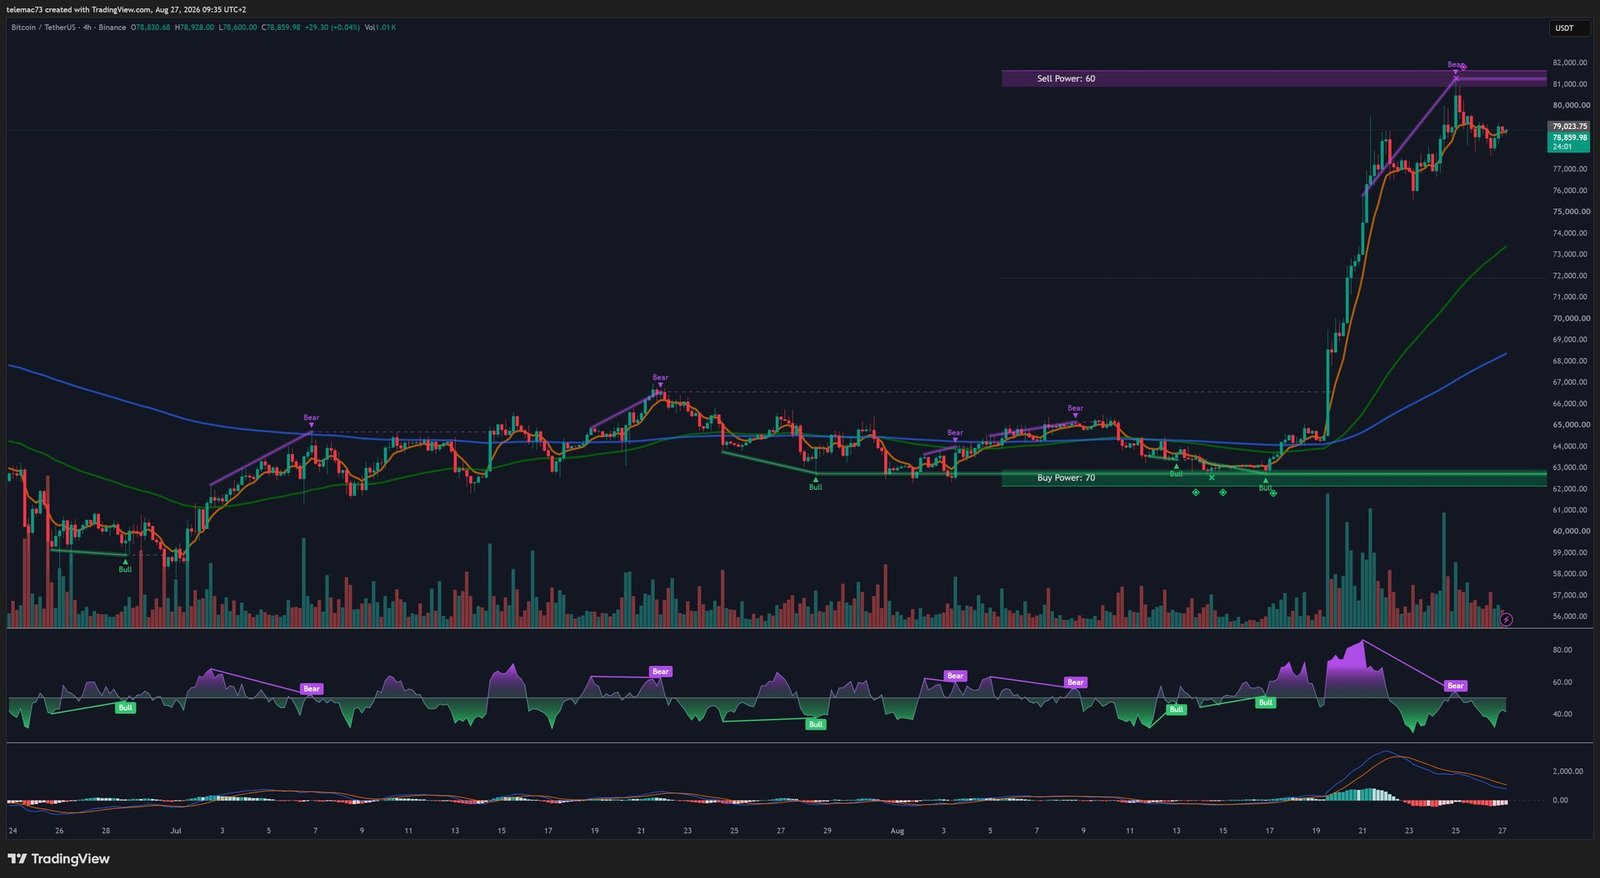
The move from $62,000 to over $81,000 forms a textbook “flagpole,” followed by a sideways, slightly descending consolidation between $78,500 and recent highs — a classic bull flag (or high-tight pennant) continuation pattern. Historically, these structures resolve most often in a breakout in the direction of the primary trend.
A crucial pivot level has formed around $72,000 through polarity: this former resistance should now act as support in the event of a correction. The H4 RSI shows a hidden bearish divergence, with price holding at elevated levels while the indicator drifts back toward 50, and the MACD has formed a medium-term “death cross” — more a pause signal than a reversal.
15-minute chart: compression before a volatility release
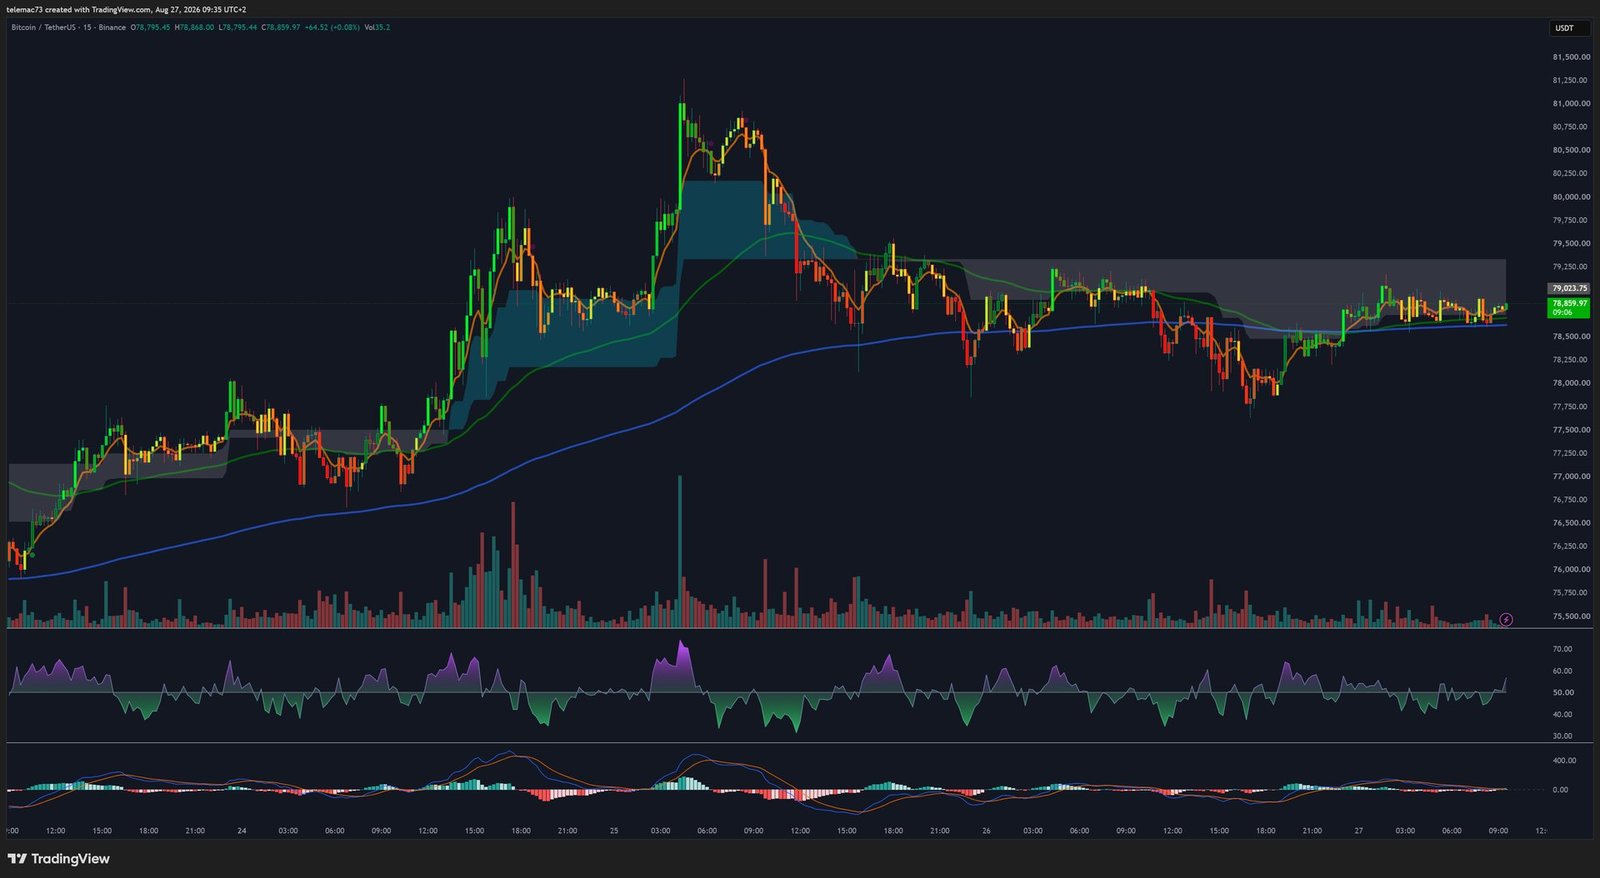
On the shortest timeframe, the market is carving out a symmetrical compression triangle around a pivot near $78,500, with moving averages squeezing together. The MACD oscillates indecisively around zero, and the RSI remains locked between 40 and 60 — signaling a market quietly building energy while waiting for a catalyst. A confirmed close above $79,500 or below $77,500 should trigger the next directional move.
Probabilistic projections and institutional outlook
Prediction markets (Polymarket data, consolidated by CoinGecko) offer a quantitative snapshot of expectations for the end of August 2026:
| Price target | Probability (end of Aug. 2026) |
|---|---|
| $100,000 | 0.5% |
| $90,000 | 3.3% |
| $87,500 | 4.5% |
| $85,000 | 13.5% |
| $82,500 | 32.5% |
| $75,000 (support) | 27.0% |
| $72,500 | 8.5% |
| $70,000 | 4.5% |
This bimodal distribution confirms the consolidation phase visible on the H4 and M15 charts: the market is currently pricing expansion and correction scenarios with nearly equal weight. Looking further out, prediction markets assign a 48.5% probability to Bitcoin closing the year above $90,000, and 25.5% to a break above $100,000.
On the institutional research side, Bernstein expects a new all-time high of $125,000 by the end of 2026, with a cycle target as high as $300,000 by 2029, driven by historically shallower drawdowns thanks to the stabilizing effect of ETFs. Tom Lee, for his part, points to a cycle target of up to $250,000.
Strategic conclusions
Bitcoin’s rally is far from an isolated speculative anomaly: it is a mechanical response to U.S. Treasury debt-management policy, a “debasement trade” that reinforces Bitcoin’s role — alongside gold’s — as a hedge against dollar depreciation. Technically, the market is going through a healthy digestion phase after a historic short squeeze, reflected in a compression triangle on the M15 chart and a bull flag on H4.
On the upside, a confirmed daily close above $81,273 would open the door to $82,500 and, further out, to longer-term institutional targets. On the downside, the market has a solid support network in place: $75,000 as the first line of defense, followed by the $72,000–$74,000 polarity zone, and finally the high-density support near $64,000.
Disclaimer: this article is provided for educational and informational purposes only. It does not constitute investment, trading, or financial advice of any kind. Cryptocurrencies are highly volatile assets; always do your own research (DYOR) and consult a qualified financial advisor before making any investment decision.

