



After a sluggish summer marked by tedious consolidation around $63,000, Bitcoin has just delivered its most violent weekly rally in three years, surging toward a local peak near $80,000. Far from being a simple burst of speculation, this move originated in an emergency intervention by the U.S. Treasury in the bond market, then relayed and amplified by a massive unwinding of short positions in the derivatives market. Here is a breakdown of a pivotal week for the digital asset.
The Macro Trigger: When the U.S. Treasury Wobbles
It all started in the bond markets. During the third week of August, the yield on the 30-year U.S. Treasury bond jumped to 5.34%, its highest level in nineteen years. This sudden dislocation forced Treasury Secretary Scott Bessent to step in with an emergency intervention, doubling the volume of long-dated debt buybacks from $2 billion to $4 billion per operation in order to bring the yield back toward 5.19%.
While the move technically stabilized the yield curve, markets read it very differently: not as a routine adjustment, but as an admission that the U.S. cannot organically absorb a national debt approaching $40 trillion. That interpretation instantly reignited the so-called “debasement trade” — the bet on the continued erosion of fiat currencies.
The direct consequence: the dollar shed about 0.8% against major currencies, while gold surged past $4,612 per ounce, its best month since 1999. Bitcoin, in its role as a non-sovereign store of value, captured part of these flows fleeing fiat risk, rising roughly 30% from its recent lows.
On top of that, a cocktail of geopolitical tensions — the Iran-U.S. conflict, escalation in Eastern Europe, and heightened surveillance of the Taiwan Strait — is reinforcing demand for hedging assets, ahead of the Jackson Hole symposium (August 27-29), where Fed Chair Kevin Warsh’s speech is highly anticipated by already tense markets, with nearly $2.8 billion in options set to expire.
Institutional Flows: The SEC Hesitates, ETFs Accelerate
On the regulatory front, the picture remains mixed. In the U.S., the Senate pushed back the final vote on the CLARITY Act to September 15, while the SEC deferred its decision on fundraising rules for Web3 entities — a legal vacuum that made ETF managers cautious earlier in the month. The UK, by contrast, laid out a clear framework via the FCA, with an authorization gateway opening on September 30, 2026.
Despite this friction, flows have clearly turned: spot Bitcoin ETPs recorded nearly $663 million in net inflows over thirty days (about 10,400 BTC), reversing a prior month that saw an outflow of more than 40,000 BTC. The Treasury catalyst alone generated roughly $650 million in additional inflows within just a few days.
On-chain, the shift is just as striking: long-term holders distributed around 356,000 BTC, pushing their share of supply below 60% for the first time in months — a classic marker of the transition between the end of a bear market and a new cycle. VanEck’s proprietary capitulation indicator, with 8 of 12 signals triggered, places the cycle low near $58,500, back in late June 2026.
Derivatives: Fuel — and the Achilles’ Heel — of the Rally
While spot demand laid the groundwork, it’s the derivatives market that explains the verticality of the move from $63,000 to over $79,000. The breach of the 200-day moving average acted as a massive algorithmic trigger, forcing the liquidation of roughly $4 billion in short positions over two days — $2.5 billion in Bitcoin alone according to Coinglass, and $4.5 billion across all crypto assets.
The result: total open interest nearing $39.93 billion, spread across international venues, Deribit ($2.25 billion) and Coinbase Derivatives ($689 million). A level this high, combined with parabolic price action, signals a market driven more by margin management than by organic value exchange.
The most sensitive point remains the perpetual futures funding rate, which has repeatedly broken above 0.05% per eight-hour interval — an 18-to-20-month high. In practical terms, a $1 million notional position costs its holder about $1,500 per day, or an annualized rate approaching 54.75%. This friction attracts “delta-neutral” strategies (buying spot while shorting perpetuals), which mechanically cap the upside while adding to contract supply.
Historically, funding rates in the 0.1% to 0.3% range have preceded corrections of 10% to 30%. If momentum fades and key supports such as $62,300 or $74,000 give way, a “long squeeze” could drag the price back toward the $53,000 region.
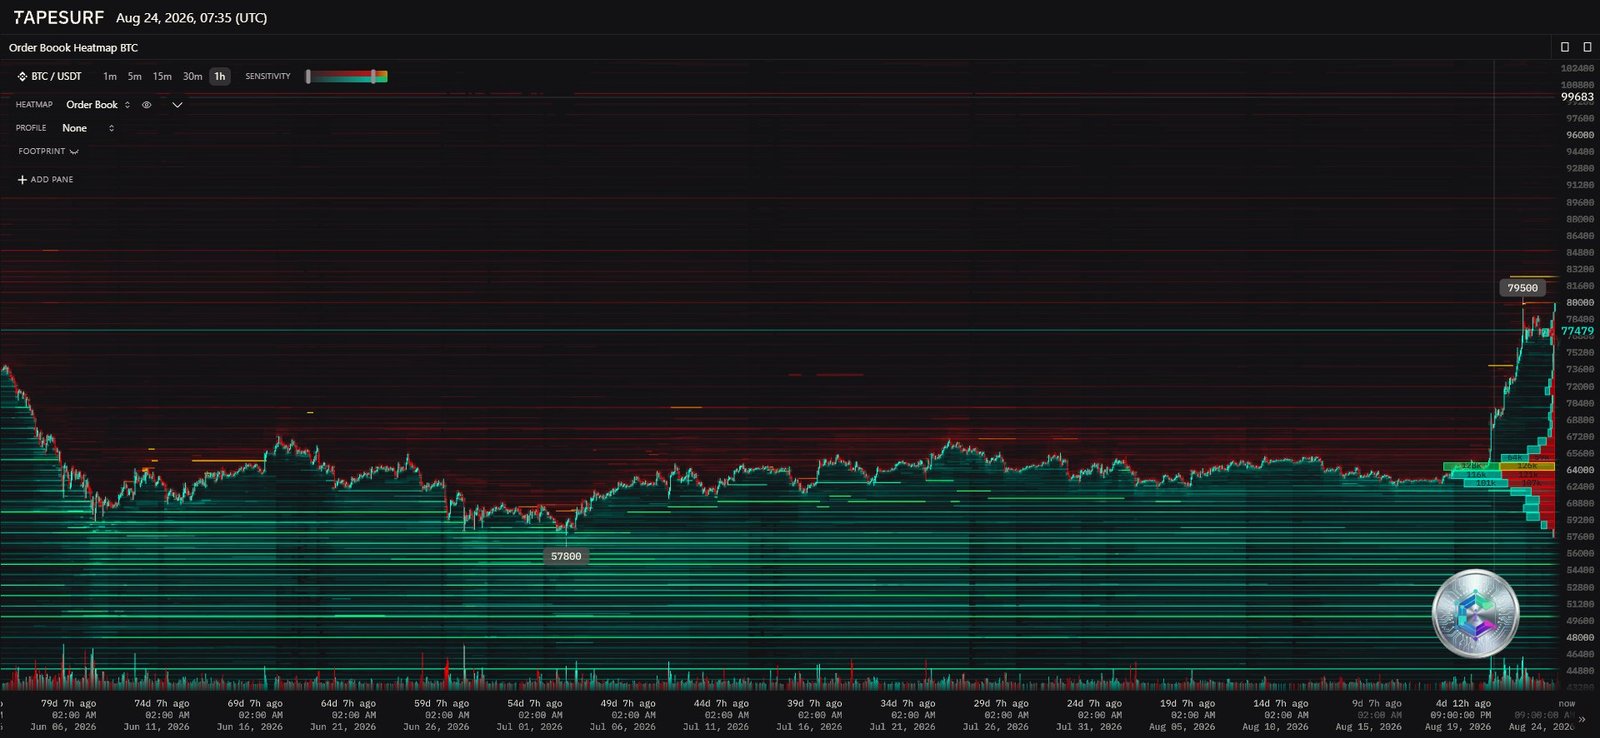
What the Order Book Heatmap Reveals
The liquidity map as of August 24 confirms this reading. Below current price, between $57,800 and $64,000, a dense buy wall (Buy Power) has acted as a genuine shock absorber throughout the summer correction, confirming that this zone forms the foundation of the current cycle.
Between $64,000 and $77,000, however, the heatmap is nearly empty: this liquidity gap is the visual signature of the short squeeze that propelled the price, as there weren’t enough sellers to slow the ascent. Spectacular as it looks, this kind of structure remains inherently unstable and markets tend to “revisit” such zones to rebuild a healthier order book.
Above current levels, between $79,500 and $82,000, a dense sell wall (Sell Power) has formed, explaining the current stagnation below $80,000. Breaking through this resistance will require genuine spot capital inflows, since leverage alone won’t be enough to erode such a thick wall of sell orders.
Multi-Timeframe Technical Read
Daily Chart: The End of the Bearish Regime
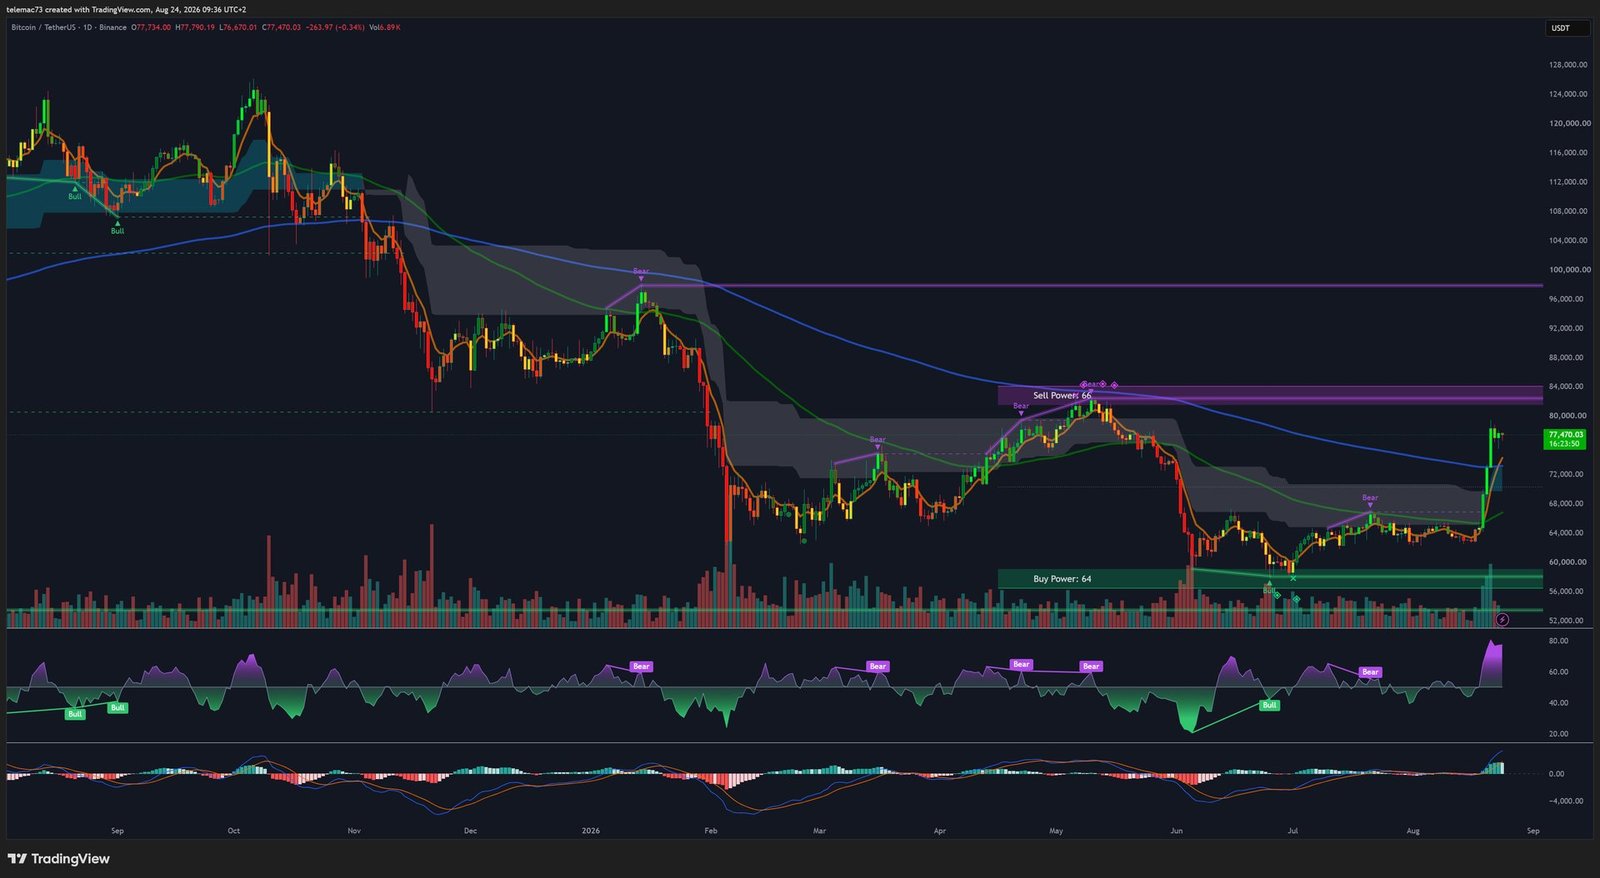
The clean break above the 200-day moving average invalidates the corrective structure that had been in place for months and opens the door to a potential “Golden Cross” should the 50-day average cross above the 200-day. The MACD confirms this expansion with an accelerating histogram, while the RSI, although approaching overbought territory, still shows no bearish divergence.
4-Hour Chart: Overheating and Signs of Fatigue
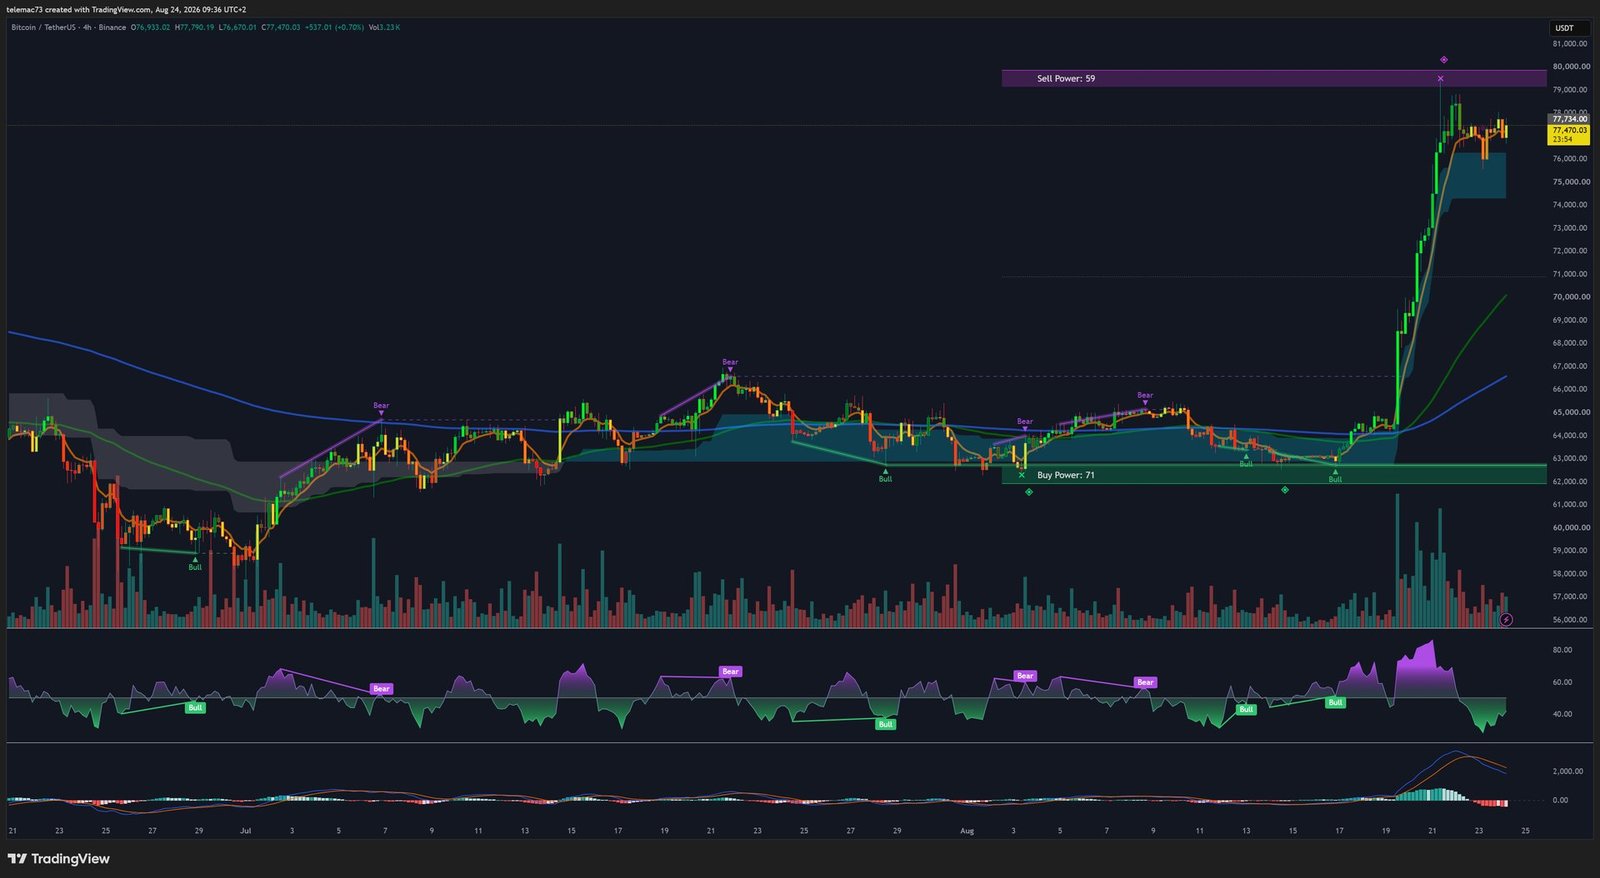
On this timeframe, the succession of marubozu candles from the $62,000 zone illustrates a total seller capitulation, halted abruptly by the $79,500 wall. The $73,500-$74,000 pivot is now critical: above it, the bullish impulse remains intact; below it, a pullback toward the moving averages becomes likely. The RSI, deeply overbought, is starting to roll over and shows early bearish divergences, while the MACD histogram is contracting — all signals pointing toward a digestion phase.
15-Minute Chart: Compression Before the Decision
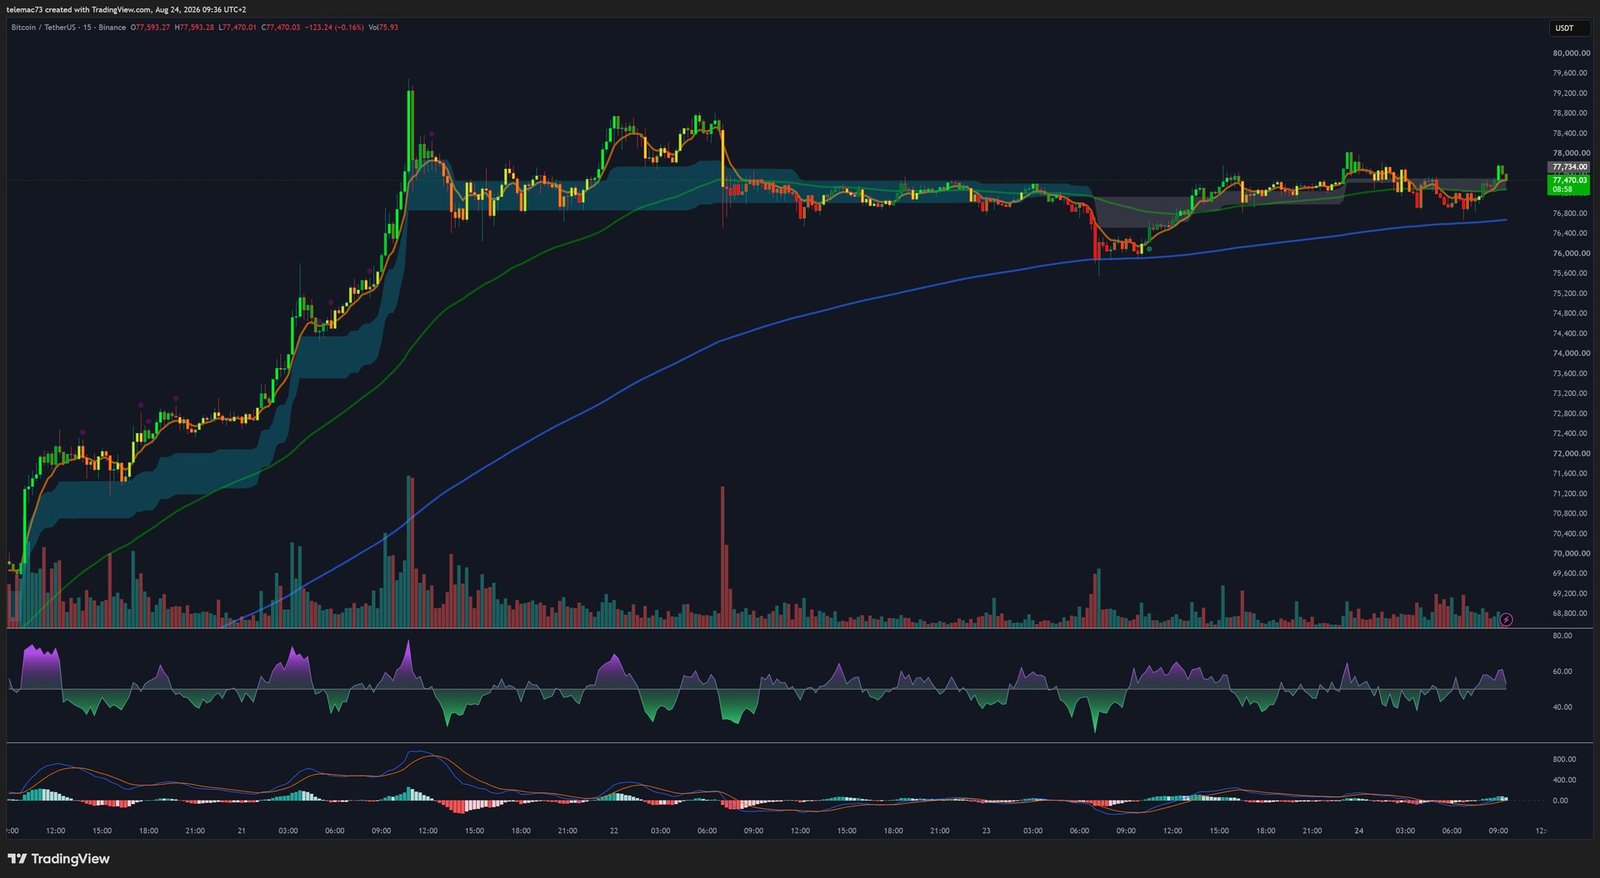
On the very short term, price is structuring into a bull flag between $76,500 and $77,800. The RSI, back to a neutral reading around 50, indicates that intraday overheating has been purged without losing ground on price — a rather bullish signal. A break above $77,800 would target a new test of $79,500, or even $82,000; a drop below $76,000 would open the door to the pullback anticipated on the 4-hour chart.
Key Levels to Watch
| Level | Price (USD) | Meaning |
|---|---|---|
| Ultimate resistance | ~$82,000 – $84,000 | Upper bound of the macro channel, residual sell orders |
| Major resistance | ~$79,500 – $80,000 | Sell wall on the heatmap, top of the short squeeze |
| Compression zone | ~$76,500 – $77,800 | M15 volatility corridor, short-term MA equilibrium |
| Strategic pivot (H4) | ~$73,500 – $74,000 | Invalidation of the immediate bullish impulse |
| Major support | ~$69,000 – $69,884 | 200-day MA, vital test of the regime change |
| Liquidity floor | ~$62,000 – $64,000 | Buy wall, rally origin, institutional support |
| Capitulation support | ~$53,000 – $58,500 | Cycle low, theoretical target in a long squeeze scenario |
The Bottom Line
Bitcoin’s current expansion combines an exogenous macro catalyst — the U.S. Treasury intervention and the resurgence of the debasement trade — with an internal derivatives-market mechanic that has amplified the move dramatically. The reclaim of the 200-day moving average and the technical structure across timeframes validate a regime change, but the hypertrophy of open interest and extreme funding rates keep a very real downside risk asymmetry in place.
What happens next will depend on the market’s ability to absorb resistance at $79,500-$80,000 without buckling under the weight of its own leverage, against a backdrop where the Jackson Hole symposium looms as a major volatility catalyst.
Disclaimer: This article is intended solely for educational and informational purposes. It does not constitute investment advice, a recommendation to buy or sell, or a solicitation of any kind. Cryptoasset markets are highly volatile and carry significant risk of capital loss. Always conduct your own research (DYOR) and consult a licensed financial advisor before making any investment decision.

