


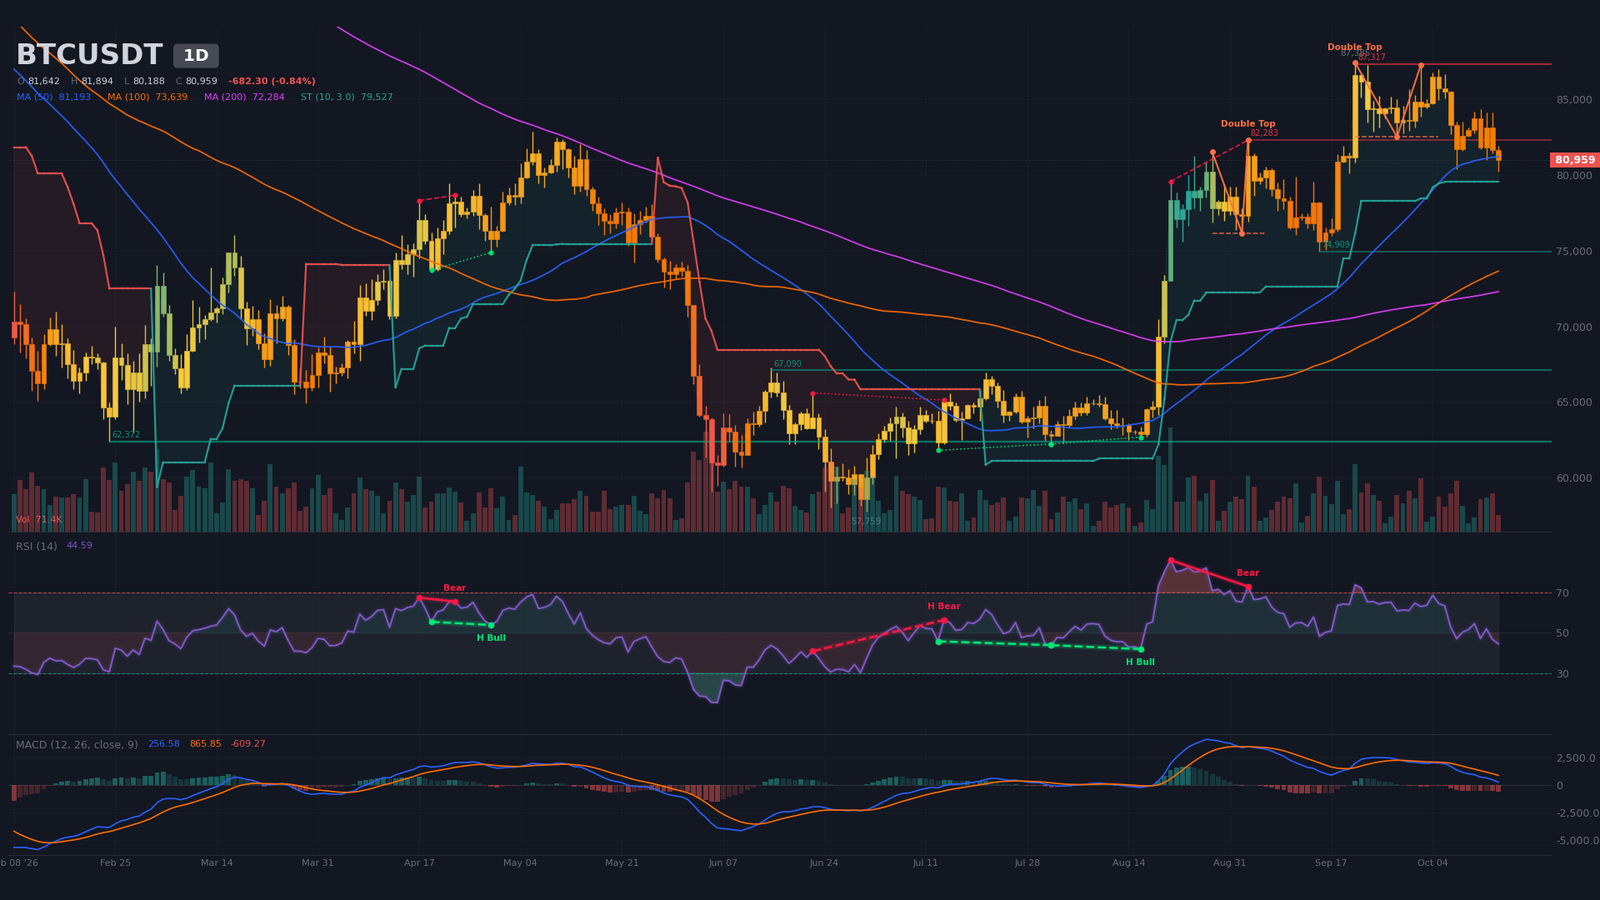
Bitcoin trades at $80,959 on October 15, 2026, down 2.4% over the past five sessions and 7.4% from the September 21 swing high at $87,385. The daily candle is shaping red (-0.8% intraday) on volume running at 57% of its 20-period average — sellers present, but without conviction. Price is testing the daily S1 pivot at $80,656, the last line of defense before the chart-target zone near $77,700. Short-term momentum has rolled over: a confirmed daily double top and a four-hour triple top confirm a bearish reversal structure, even though the SMA 50/200 golden cross from September 8 keeps the long-term read bullish.
Derivatives and liquidations are the proximate driver. Longs paid the biggest toll: $942M in aggregate crypto liquidations over 24 hours (BeInCrypto, Oct. 15 05:31), $863M of which were longs. Binance absorbed 53.7% of the total and logged the single largest order — a $12M BTCUSDT long liquidated at $80,209. Futures open interest has unwound 3.65% in 24 hours and 7.06% over seven days, to $7.39B, a sign of gradual de-leveraging. The 24-hour taker buy/sell sits at 0.911, confirming seller pressure, while funding at 0.0045% (5% annualized) stays neutral, well below the >0.02% crowding levels seen in early October. Spot Bitcoin ETF flows have turned negative, with $487M in outflows on October 7 — $208M from BlackRock’s iShares IBIT alone — for an October month-to-date of -$163M (24/7 Wall Street, Oct. 8). The same report flags a whale that accumulated 86,702 BTC over three weeks without halting the slide, evidence that selling pressure originates from order books and ETFs rather than on-chain distribution.
The US macro backdrop turned abruptly hawkish. October 14 core CPI m/m printed 0.3% against a 0.2% consensus, reviving expectations of a Fed rate hike as early as October (Cointelegraph, Oct. 14 18:51; The Block, Oct. 14 18:51). Headline CPI m/m landed at 336.94 versus 336.65 expected — also slightly hot. Wall Street took its worst session since July: S&P 500 -1.1%, Nasdaq -1.9%, and listed miners fell as much as 13% (Cointelegraph, Oct. 15 05:29). Asia followed: Kospi shed 7.85% and the Nikkei 4% on October 15 (The Block, Oct. 15 06:38; CNBC, Oct. 15 02:42). On the regulatory and infrastructure side, two constructive signals without immediate price impact: Russia’s central bank authorized Sberbank to exchange digital assets from December 1 (Bitcoin Magazine, Oct. 14 23:30), and Standard Chartered opened BTC/ETH trading to wealthy UAE clients (Decrypt, Oct. 14 19:46). The combination undermines the long-term bullish read and validates the near-term bearish dynamic: traders must now contend with sticky US inflation and a technical compression that expires in ten days.
This setup — a 4H symmetrical triangle compression, a daily double top, and an intraday range — calls for a methodical Bitcoin technical analysis, timeframe by timeframe, before any positioning decision. Critical levels cluster in a $2,000 band around spot, and three US macro catalysts between today and Friday will force a direction.
Multi-Timeframe Technical Analysis
Daily Timeframe (1D): Confirmed Double Top Below Major Resistance
October 15’s daily candle closes below the three daily pivots R1 ($83,372), P ($82,387), and is approaching S1 ($80,656). The session candle is forming at -0.8% intraday on 57% of 20-period average volume — light participation that signals a lack of commitment from sellers. Daily MACD retains a positive line at 256.08, but its histogram sits at -$609 in expansion since the September 29 bearish cross — 16 candles of established downside pressure. RSI at 44.6 remains neutral, well clear of oversold, leaving additional technical room to the downside. The algorithmic pattern retained is a confirmed bearish double top, neckline at $82,500, target at $77,693, last pivot on October 2. A regular bearish RSI divergence had been flagged between August 21 (price $79,555, RSI 86) and September 3 (price $82,282, RSI 72.99) — it has now done its work. The daily SMA 200, near $72,217, remains the only strictly bullish long-term indicator; the SMA 50/200 golden cross from September 8 holds.
The algorithmic picture is now explicit: since October 2, the structure has flipped to distribution (supply outweighing demand at the highs), and every bounce to $82,500 has failed beneath the daily SuperTrend, which turned down at $84,008. Until price clears $84,100 on a close, the bias stays negative on the daily. The probability of sliding through S1 toward $80,080 and then $79,700 rises with every session that fails to print a bullish breakout.
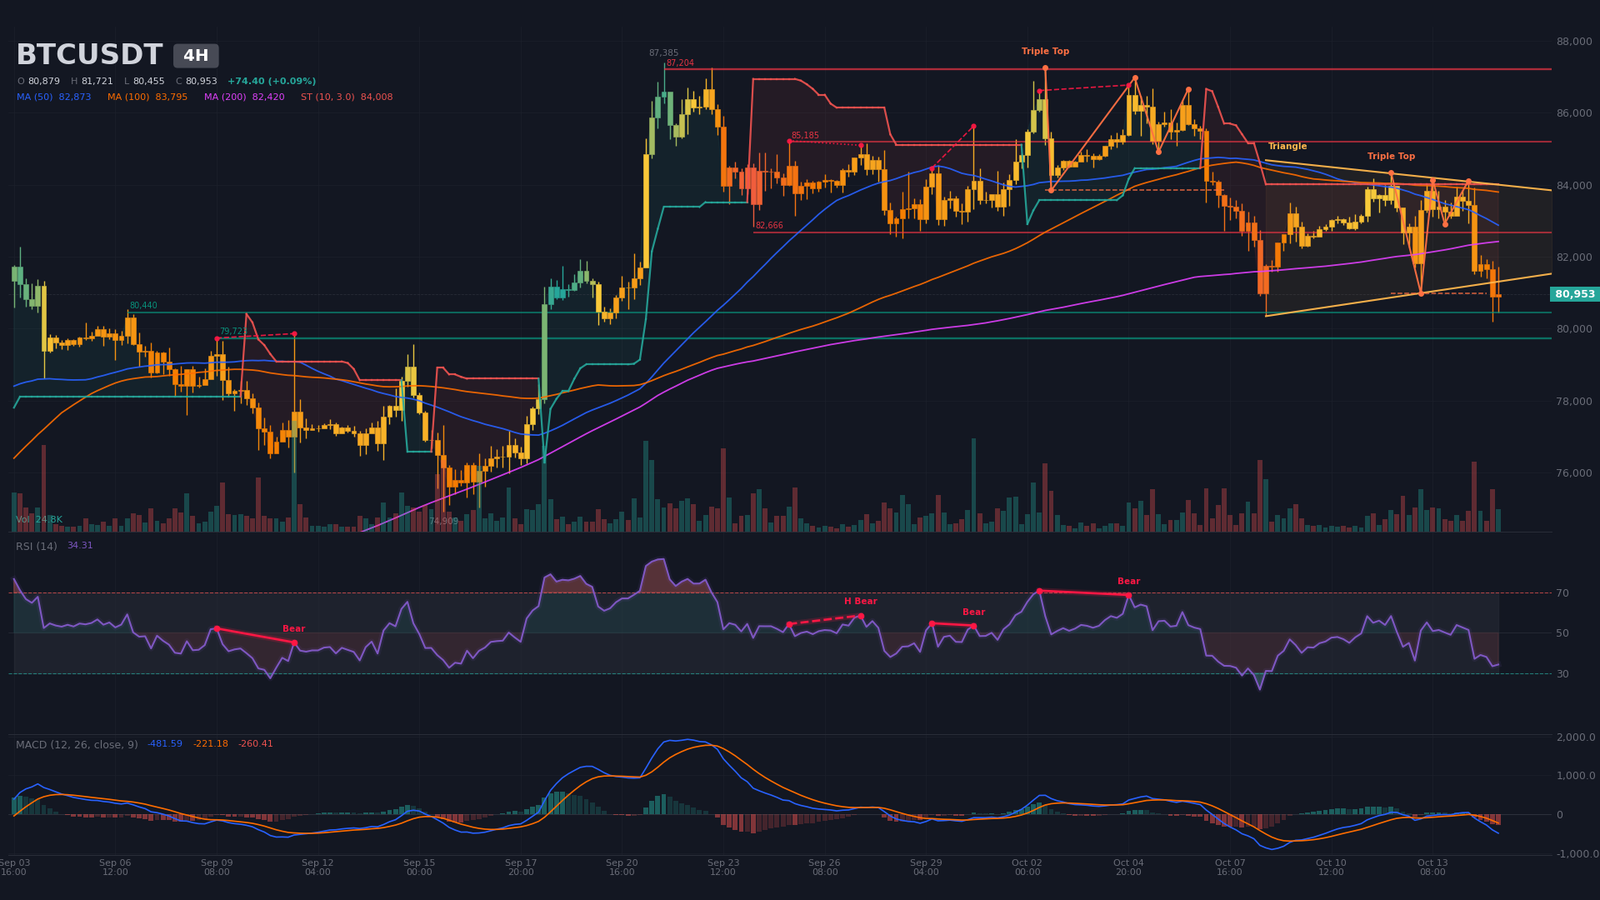
Intermediate Dynamics (4H): Triple Top Inside a Symmetrical Triangle
The intermediate structure is more advanced still. Three tops near $84,134, $84,086, and $83,985 triggered a confirmed bearish triple top, neckline at $80,985, target at $77,773 (last pivot October 14 08:00). Price is now trading within a clearly identified symmetrical triangle, bounded at $81,182 and $84,087, with the apex projected for October 25 at 20:04. 4H MACD crossed below zero (line -481.59 vs. signal -221.18, histogram -$260 in expansion) after a bearish cross on October 14 12:00; RSI at 34.3 is flirting with the lower neutral zone and the daily SuperTrend has turned bearish at $84,008. A regular bearish RSI divergence, formed between October 2 and 4 (price $86,617 then $86,770, RSI 70.93 then 68.76), reinforces the bearish conviction.
The symmetrical triangle is the centerpiece of the analysis: it condenses 16 days of price into a single indecision pattern with a predictable apex. Any break below $80,080 triggers the measured move toward $77,770 (the $84,087 minus $81,182 range applied to the lower bound); any break above $84,087 voids the bearish thesis and reopens the path toward $87,200. The apex expires October 25: ten days to resolve.
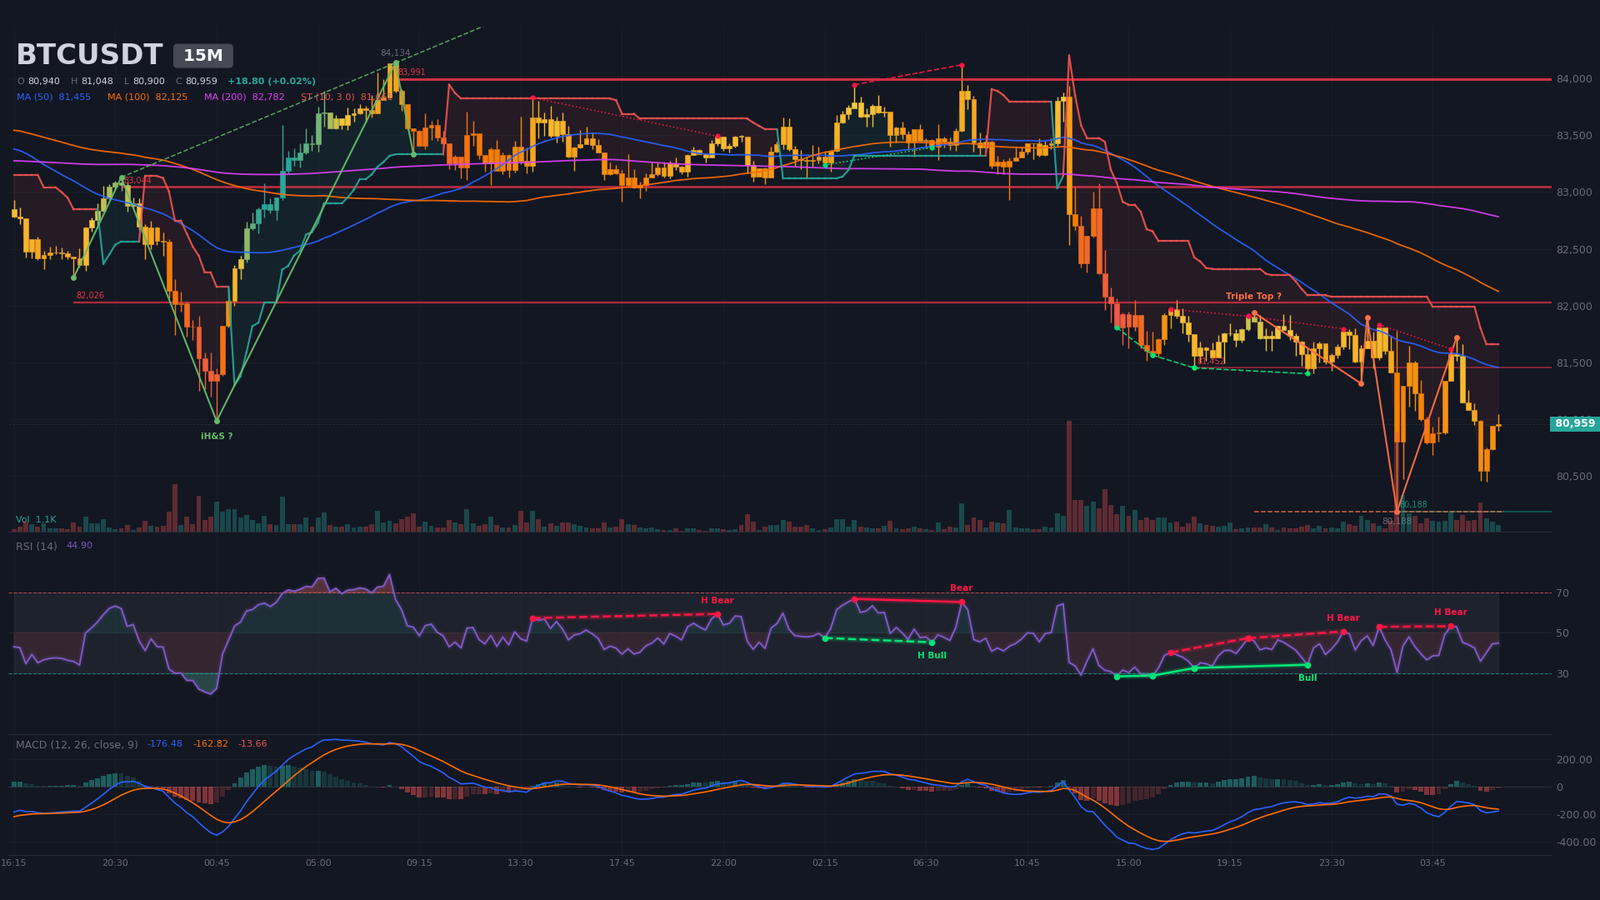
Intraday Structure (15m): Compression After the Bearish Trigger
On the 15-minute chart, price is ranging tightly from $80,188 to $81,720 since the October 15 02:15 intraday drop (low wick at $80,188). An unconfirmed triple top is forming, neckline at $80,188, last pivot at 04:45, along with an unconfirmed inverse head and shoulders (neckline $84,134, target $86,693) — an inactive pattern, with price too far from the neckline. RSI at 44.9 is neutral, MACD just crossed below its signal at 05:45, and the M15 SuperTrend is bearish at $81,661. A regular bullish RSI divergence between October 14 17:45 and 22:30 (price $81,452 then $81,401, RSI 32.6 then 34.2) argues for a near-term technical bounce, pending confirmation via a break of $81,452.
Multi-Timeframe Synthesis
| Timeframe | Dominant Trend | RSI (14) | MACD | Chart Pattern |
|---|---|---|---|---|
| Daily (1D) | Bearish (double top) | ~45 | Bearish cross, histogram expanding below signal | Confirmed double top |
| 4 hours (4H) | Bearish (triple top in triangle) | ~34 | Below zero, recent bearish cross | Confirmed triple top + symmetrical triangle |
| 15 minutes | Neutral (compression) | ~45 | Recent bearish cross (3 candles) | Unconfirmed triple top + unconfirmed IH&S |
Technical Levels and Pivots Map
The method combines daily pivots, classic extensions, swing highs and lows across the three timeframes, augmented by liquidity concentrations from the order book and estimation models. The short-term central pivot sits between $80,990 and $81,500 — the intersection of the 4H pivot and former daily supports, the current equilibrium zone where the market hesitates ahead of the catalyst.
| Level | Price (USD) | Category | Technical Foundation |
|---|---|---|---|
| R3 | 87,200 – 87,800 | Major resistance 3 | 4H resistance (87,204, 3 touches) + estimated shorts liquidation pocket 87,470-87,865 ($60-64M) |
| R2 | 84,800 – 85,200 | Major resistance 2 | Daily R2 (85,103) + 4H resistance (85,185, 2 touches) + 4H triangle upper bound (84,087) |
| R1 | 83,000 – 83,500 | Immediate resistance | Daily R1 (83,372) + M15 resistance (83,043, 4 touches) + swing high Oct. 12 (84,340) |
| P | 80,900 – 81,500 | Central pivot | 4H P (80,987) + Daily P (82,387); current equilibrium |
| S1 | 79,700 – 80,200 | Immediate support | Daily S2 (79,670) + 4H S1 (80,080) + M15 swing low (80,188) + daily SMA 50 (81,193) |
| S2 | 77,700 – 78,500 | Major support 2 | 4H triple top target (77,773) + daily double top target (77,683) + M15 triple top target (78,525) |
| S3 | 75,500 – 76,000 | Major support 3 | Estimated longs liquidation pocket 75,556-76,017 ($104M) + anticipated SMA 26 trough zone |
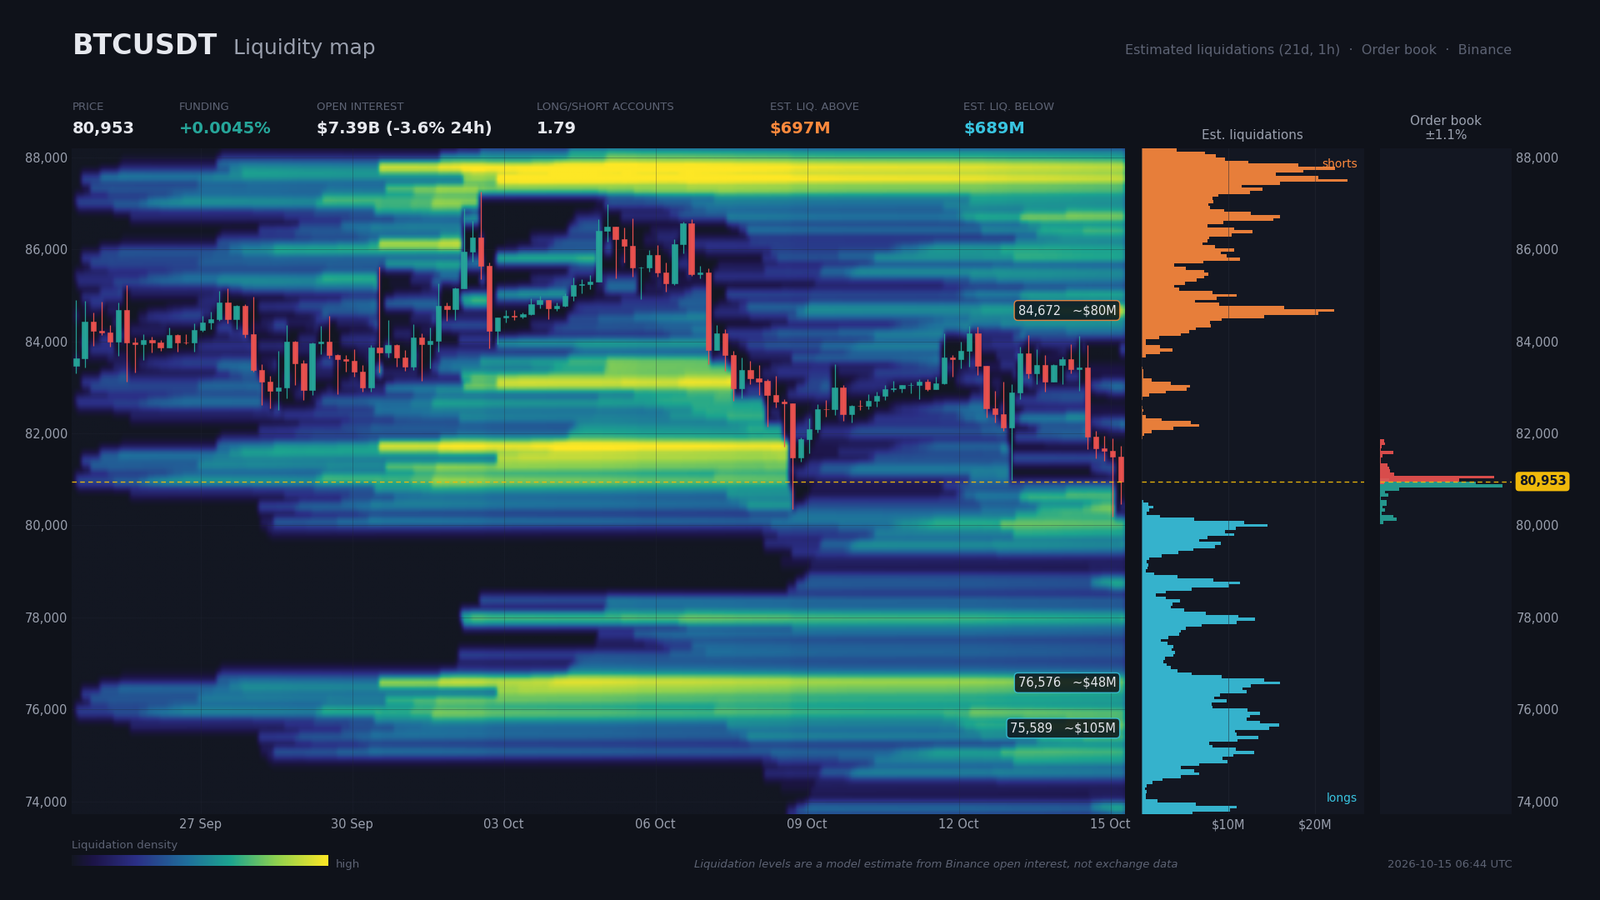
Order Book and Liquidity Heatmap
The Binance order book shows 1.08% coverage on each side of price — slightly bid: 2% bids at $69M, 2% asks at $58M, a +8.7% imbalance. Buy walls cluster just under price ($80,921 for 21M, $80,855 for 27M); sell walls mirror above ($80,929 for 17M, $81,052 for 25M). The configuration forms a dense liquidity belt between $80,855 and $81,052, nearly equidistant from price — a true short-term magnet.
On the derivatives side, funding at 0.0045% (5% annualized) stays neutral, well below the >0.02% crowding levels seen before the 10-10 (per Yahoo Finance, Oct. 7) — the market is not crowded in longs. Open interest at $7.39B has unwound 3.65% in 24 hours and 7.06% in seven days, a de-leveraging signal consistent with the price decline. The global long/short ratio at 1.83 still shows a retail bid lean, though the top-trader ratio at 1.45 is more neutral, and the 24-hour taker buy/sell at 0.911 confirms selling pressure. Estimated liquidation pockets (model-based, not direct measurement) total $697M above (shorts) and $689M below (longs) — a near-perfect balance. The densest upper pocket sits between $84,508 and $84,771 ($80M), the densest lower pocket between $75,556 and $76,017 ($105M).
Consequence: the market is de-leveraged yet still long-biased. A sweep toward $81,050 then $82,000 (short pockets) or a bearish squeeze toward $79,700 (long pockets) are equally plausible. The price magnet remains the $80,500-$81,500 zone as long as no macro catalyst breaks the compression.
Calendar: Catalysts to Watch
Three US macro releases dominate the next ten days and will determine how the current compression resolves.
- Thursday Oct. 15, 14:30 (Zurich) — US core retail sales m/m (consensus 0.3%, prior 1.2%), core PPI m/m (consensus 0.5%, prior 0.4%), jobless claims (consensus 200k, prior 197k): major stakes after the CPI surprise, any soft print would extend the slide.
- Friday Oct. 16, 05:30 (Zurich) — Fed Chair Kevin Warsh speech: dominant catalyst, likely to confirm or invalidate October rate-hike probabilities.
- Monday Oct. 19, 04:00 (Zurich) — China GDP, industrial production and retail sales: health check on Asian demand, first impact test.
- Tuesday Oct. 20, 14:30 (Zurich) — US housing starts and permits: leading signal on the housing market, a key inflation expectations component.
- Wednesday Oct. 21, 01:50 (Zurich) — Japan trade balance: risk indicator for Asian flows.
- Thursday Oct. 22, 14:30 (Zurich) — US leading indicators: weekly confirmation or invalidation of the macro trend.
Three Scenarios for the Coming Weeks
Three trajectories emerge, ranked by probability based on the most likely macro trigger.
Scenario A — Bearish Break of the 4H Triangle (probability 50%)
The main catalyst is the US PPI and retail sales release on October 15 at 14:30. Any hot surprise would flip the 4H symmetrical triangle into a bearish continuation pattern. The technical trigger is a 4H close below $80,080 (4H S1), opening a path toward $79,283 (4H S2, with daily ATR of $2,201 implying a stop of at least $963 from entry), then toward $77,700-$78,500, the overlapping target of the 4H triple top and the daily double top. Execution zone: $79,950-$80,080. Invalidation: 4H close above $82,500 (daily double top neckline). R:R ≈ 1.6.
Scenario B — Liquidity Sweep Toward the Short Pocket (probability 30%)
The catalyst is Fed Chair Warsh’s speech on October 16 at 05:30, which could trigger a technical squeeze. The trigger is a break above $82,500 (daily neckline). Price would retrace toward $83,372 (daily R1), then $84,087-$84,200 (4H triangle upper bound and bearish SuperTrend), before the R2 zone between $84,700 and $85,200 where the $80M short pocket sits. Execution zone: $82,500-$82,700, gradual profit-taking, expected reversal. Invalidation: 4H close above $85,200 with volume, confirming a bullish daily reversal. Short-side R:R ≈ 2.0 (return target $80,900).
Scenario C — Range Until the Triangle Apex (probability 20%)
In the absence of any macro surprise and with orders intact, the market would stay in a range between $80,188 and $82,500 until the 4H triangle apex on October 25 at 20:04. Execution zone: accumulation between $80,500 and $81,500. Invalidation: a range break on either side with volume-validated direction.
Summary and Conclusion
Bitcoin has entered a technical transition phase: the long-term structure remains bullish (daily golden cross, SMA 200 near $72,200), but the intermediate structures (4H and daily) have rolled over and confirm a reversal pattern. Outflows from ETFs and the renewed US inflation impulse invalidate, in the near term, the case for an immediate breakout above $87,000. Price is bracing for a triggering event: the 4H triangle compression expires on October 25, but the PPI and Warsh releases will land first and force a direction.
Three critical levels dictate strategy: $80,080 (4H S1) — below this threshold, Scenario A activates; $82,500 (daily double top neckline) — above, Scenario B becomes dominant again; $84,087 (4H triangle upper bound and SuperTrend) — above, the bearish pattern is invalidated. The dominant strategy is to sell bounces toward $82,500-$83,400, with protection above $84,100 on a 4H close, and successive targets at $79,700 then $77,700.
Sources
- Bitcoin drops below $81,000 as risk-off sentiment weighs on Asian equities — The Block, Oct. 15 2026, 06:38
- Bitcoin miners plunge up to 13% in Wall Street’s worst selloff since July — Cointelegraph, Oct. 15 2026, 05:29
- Bitcoin falls below $82,000 as hotter core CPI revives Fed hike concerns — The Block, Oct. 14 2026, 18:51
- Crypto Liquidations Near $1 Billion as Longs Take the Majority of Losses — BeInCrypto, Oct. 15 2026, 05:31
- Will the Crypto Market Repeat 10-10? Here’s What the Data Says — Yahoo Finance, Oct. 7 2026
- Whales Bought 86,702 Bitcoin in Three Weeks… — 24/7 Wall Street, Oct. 8 2026
- From a record high to a 10% drop in just two months — MarketWatch, Oct. 14 2026, 23:54
- SK Hynix plunges 8% amid Asia tech rout — CNBC, Oct. 15 2026, 02:42
- Standard Chartered Opens Bitcoin and Ethereum Trading to Wealthy UAE Clients — Decrypt, Oct. 14 2026, 19:46
- Russia’s Central Bank Authorizes Sberbank to Exchange Cryptocurrencies — Bitcoin Magazine, Oct. 14 2026, 23:30
- Patrick Witt exits White House crypto role as Clarity Act stalls — The Block, Oct. 14 2026, 22:30
- VanEck seeks to withdraw application for Lido staked Ether ETF — Cointelegraph, Oct. 15 2026, 03:21
- Bitcoin ETF Flow — Farside Investors, page updated Oct. 7 2026
- Adviser and Regulated Fund Custody Rules; Crypto Custody Rules — SEC, Oct. 13 2026
- Anthropic’s third-quarter revenue is said to hit $16.8 billion ahead of IPO — CNBC, Oct. 15 2026, 05:48
Disclaimer: This article is for educational and informational purposes only. It does not constitute investment advice, a recommendation to buy or sell, or an invitation to trade any financial asset. Cryptocurrency markets are extremely volatile; any investment decision should be based on your own research (DYOR) and, where appropriate, the advice of a licensed financial adviser.

