


- Bitcoin has confirmed a double top and is compressing on its 200-day SMA: distribution still dominates below $76,270.
- Driver: $1.28B of net spot ETF outflows last week and CPI above consensus, with a 25 bp hike in December almost fully priced.
- Watch: the Friday 13 November PPI at 14:30 Zurich time, as the 4H and 15m wedge apexes come due.
Bitcoin trades at $73,614 this Thursday, November 12, 15.8% below its period high of $87,385 set on September 21. The recent low, $72,691 on November 10, sits only 1.3% under the current price. Over 30 days the decline reaches 11.4%, and the weekly chart shows five consecutive weeks of losses. The market is no longer in a simple correction; it has entered a distribution phase that is accelerating.
The immediate driver is derivatives. According to The Block (November 12), Derive options now give a 31% probability of Bitcoin below $70,000 by Christmas, up from 15% a week earlier, while the chance of a move above $80,000 has fallen to 26% from 53%. Puts account for 55% of premiums. Yet perpetual open interest, roughly 353,000 BTC according to K33, rose 12% over 30 days despite the price drop, so positions are building against the trend and the market is vulnerable to a purge.
Flows confirm the pressure. US spot ETFs recorded $1.28B of net outflows last week, then $296M on Monday and Tuesday, after the $643M exit of October 30, the largest since June 25, which followed the Binance hack (CoinDesk, November 2). Glassnode (Decrypt, November 11) reports a $14.2B contraction in stablecoin supply over 30 days, the fastest since June 2022, and a price below the short-term holders’ cost basis near $75,600. MSCI also removes Strategy from its indices effective November 30 (Bitcoin Magazine, November 12), forcing index funds to sell; the company holds 850,364 BTC at an average cost of $75,456, now above the market price.
On the macro side, October CPI came in at +0.4% month over month against 0.3% expected, and core at +0.3% against 0.2% expected. Markets price a 25 basis-point hike in December as « almost certain » (CME, via WSJ), and Governor Waller has hinted at a larger move if core reaches 0.3%. The US 10-year yield stands at 5.01% and the 2-year at 4.78% (CNBC, November 12). The SEC’s proposed crypto custody framework (A&O Shearman, October 15) is positive over the long term but has no price effect on the horizon studied. The backdrop supports the bearish technical signal, although the purge of leveraged longs and accumulation by wallets holding 100 to 10,000 BTC temper that picture around $73,000.
This Bitcoin technical analysis is organized across three timeframes, from daily to 15-minute, followed by a map of key levels, the order book and the scenarios that follow from them.
Multi-Timeframe Technical Analysis
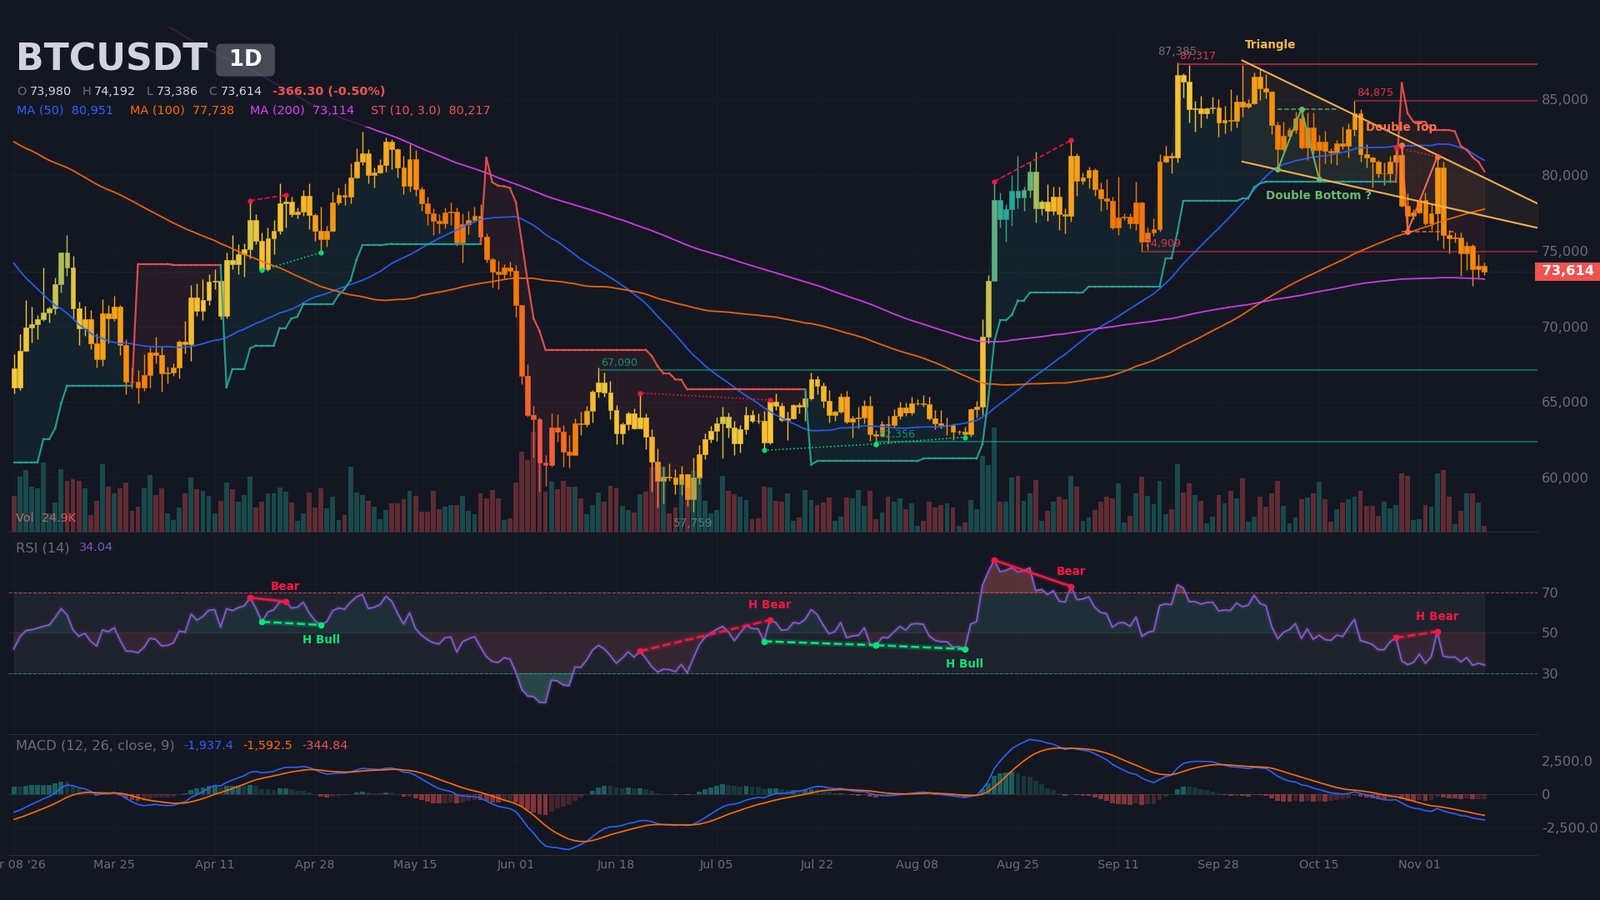
Daily Timeframe (1D): double top confirmed below the 200-day SMA
The weekly context is neutral to bearish: weekly RSI at 48, price below the weekly SMA10 (~$80,150) and the weekly SMA20 (~$74,300), with lower highs and lower lows since late September. The daily SuperTrend remains bearish at $80,200. This looks like the early stage of a reversal rather than a simple correction, although the reversal will only be confirmed by a loss of the daily 200-day SMA.
On the daily chart, price stays below the 20-day SMA (~$77,400) and 50-day SMA (~$81,000), but sits right on the 200-day SMA (~$73,100), with no 50/200 cross. The double top is confirmed: the close broke below the $76,270 neckline, and the measured target of $70,970 has not yet been reached. The daily wedge broke its lower boundary near $77,980. The bullish double bottom, with its neckline at $84,340, remains a distant hypothesis with no weight. The ADX at 23, with DI- above DI+, describes a nascent bearish trend that is not yet strong.
On the major impulse from $57,759 (July 1) to $87,385 (September 21), the retracement has reached 46%. Price sits between the 38.2% Fibonacci (~$76,070) and the 50% level (~$72,570), with the 61.8% (~$69,080) as the next target. RSI at 34 is neutral, stable and close to oversold, with no bullish divergence. MACD remains below its signal line and below zero, with a bearish crossover since September 29. The latest complete daily candle (November 11) traded at 91% of average volume, with no capitulation; the November 5 spike (206%) matches a downward rejection. Price is inside the value zone ($60,200 – $78,700), with a volume node at $77,200 above and a distant point of control near $64,200.
Intermediate Dynamics (4H): compression wedge under resistance
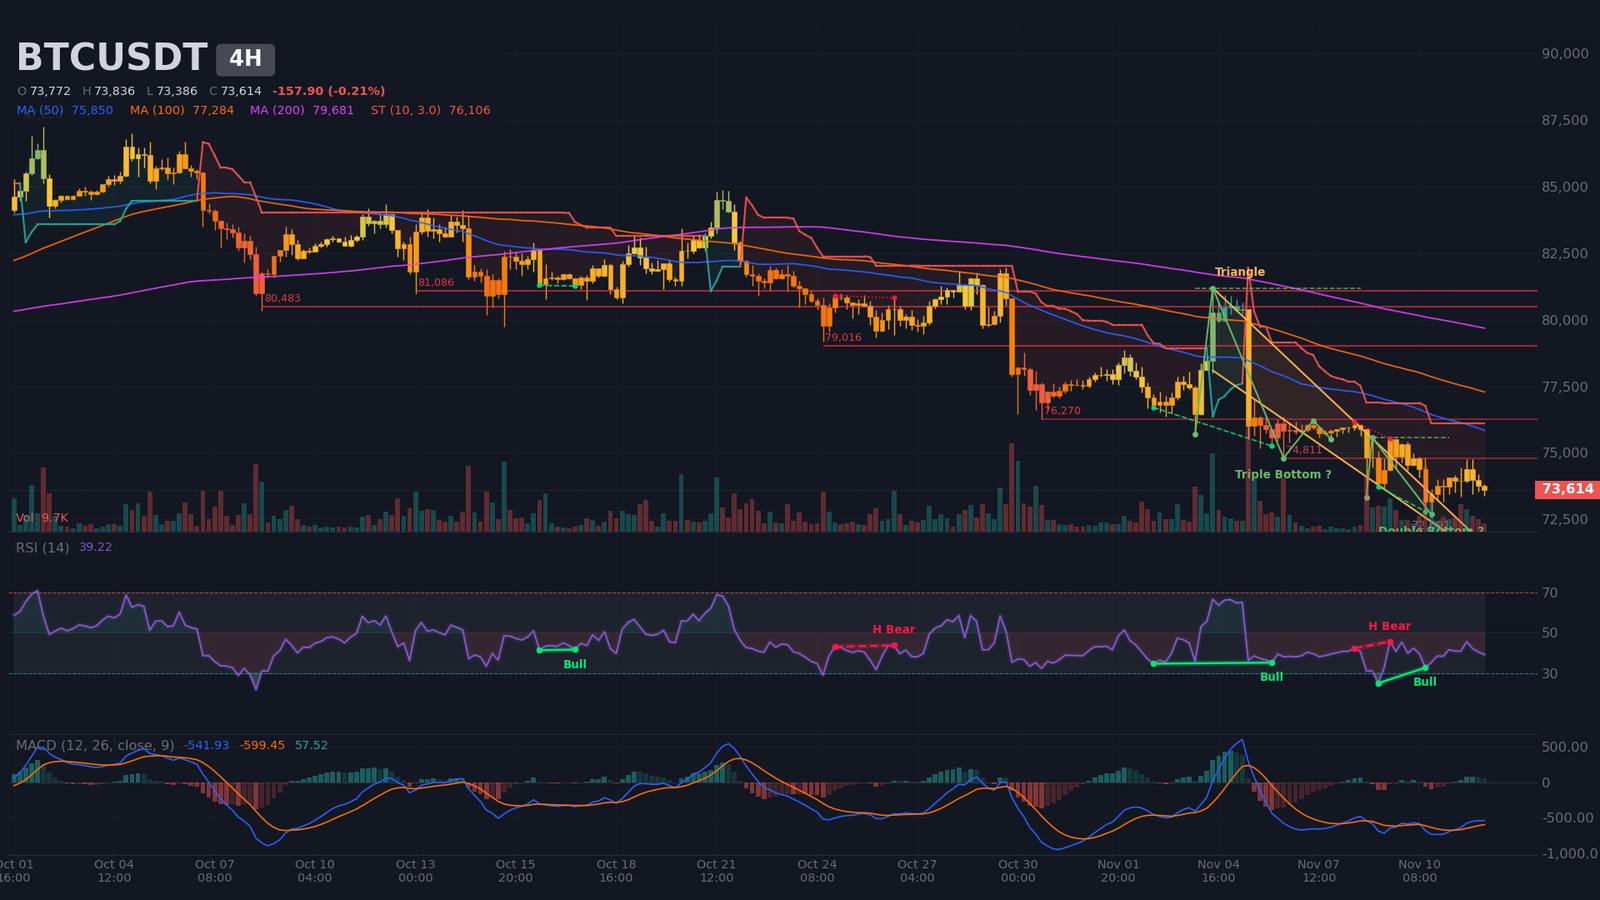
The 4H chart validates the daily: ADX at 44, DI- dominant, price below its 20, 50 and 200 SMAs (~$74,200, $75,850 and $79,700), and a bearish SuperTrend at $76,100. A wedge is tightening, with an apex estimated on the evening of November 13. The double bottom (neckline $75,575, target $78,140) and the triple bottom (neckline $81,190) remain unconfirmed and are only rebound hypotheses. The regime is trending, which favors bearish continuation and selling rallies.
The bullish nuances are real. A regular bullish divergence (November 9-10) pairs a lower price low near $72,800 with a higher RSI, after RSI dipped below 30. MACD crossed up on November 11, but below zero, which makes it a technical bounce rather than a reversal. The November 10 session, at 471% of average volume, suggests a partial capitulation. Two resistances matter: $74,800 (23.6% Fibonacci of the $81,188 to $72,691 decline), then $76,270. Price sits below the 4H value zone ($78,450 – $86,950), so a breakout would move quickly.
Intraday Structure (15m): tight Bollinger range
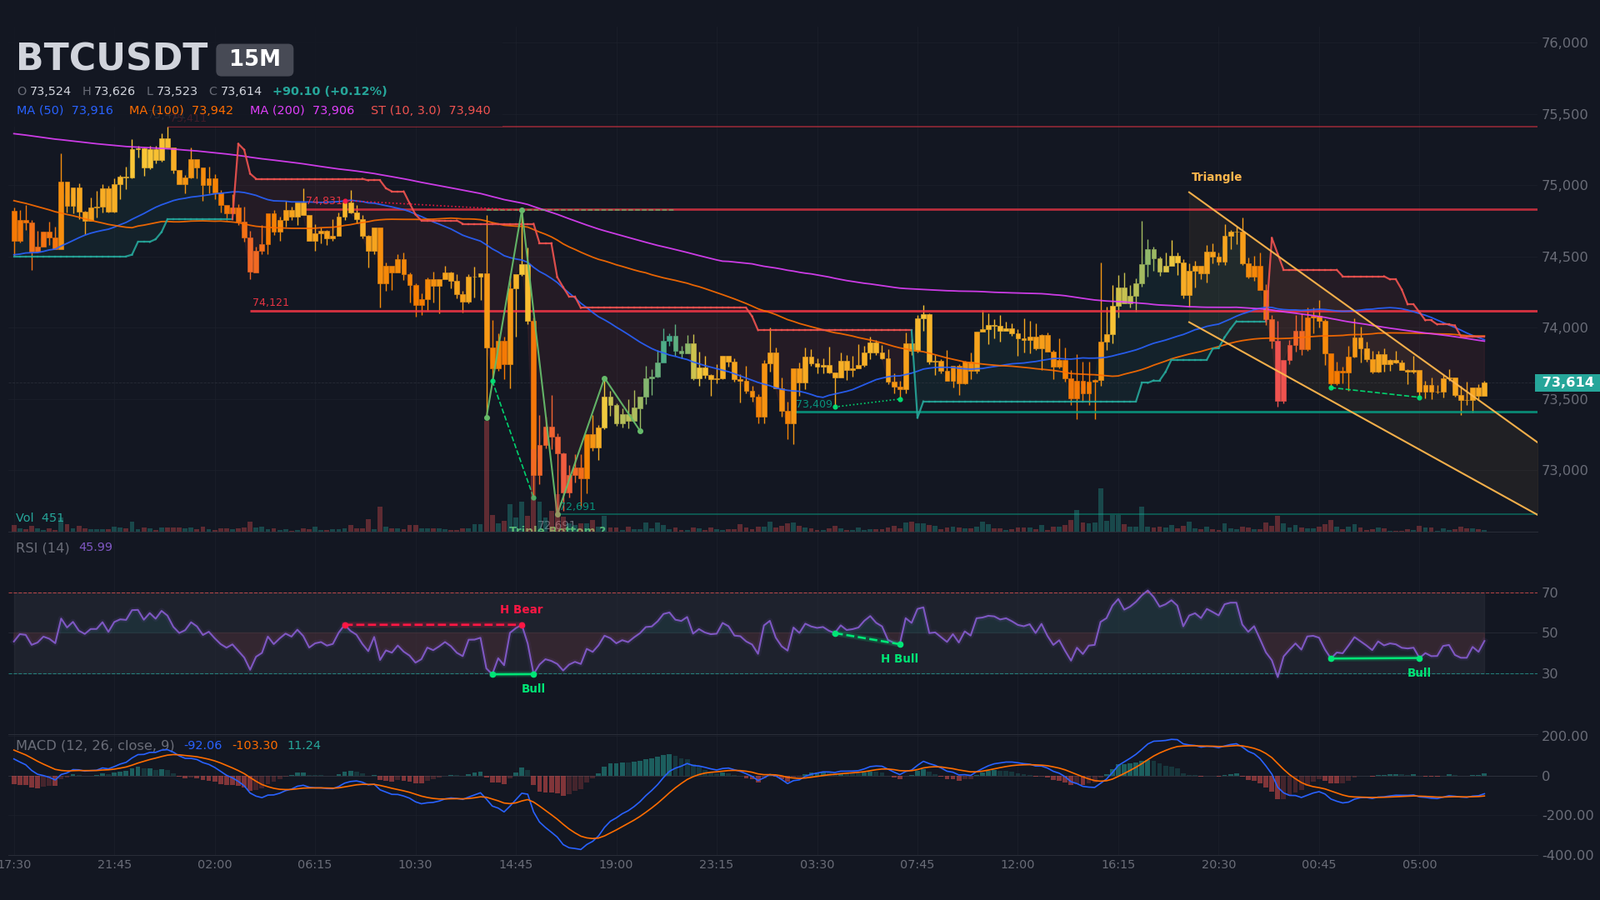
The 15-minute chart is ranging: ADX at 18 and Bollinger Bands among the tightest of the last 120 candles, with a width near 0.5%. Price oscillates between support at $73,410 and resistance at $74,120, each touched five times, with the point of control at $73,680. The 15m wedge apex sits near November 13 at 04:35 UTC, and lower highs and lower lows (last high $73,709, last low $73,386) confirm the short-term bearish structure. Price remains below its 15m SMA20, 50 and 200, clustered between $73,600 and $73,900.
MACD crossed up on November 12 at 07:15, a short-term trigger, and RSI at 46 is rising. The bullish divergence of November 12 is too weak to be retained, and the 15m triple bottom (neckline $74,825) remains unconfirmed. The triggers are clear: a 15m close above $74,120, then $74,830, would open a bullish extension; a close below $73,410 would target a test of $72,700. These signals do not change the daily bias, and the 15m ATR (~$155) calls for wide stops on intraday entries.
Multi-Timeframe Synthesis
| Timeframe | Dominant trend | RSI (14) | MACD | Chart pattern |
|---|---|---|---|---|
| Daily (1D) | Bearish (distribution) | ~34 | Below signal and zero, bearish crossover on 09/29 | Confirmed double top |
| 4 hours (4H) | Bearish (established trend) | ~39 | Bullish crossover on 11/11, below zero | Compression wedge |
| 15 minutes (15m) | Range with bearish structure | ~46 | Bullish crossover on 11/12, below zero | Compression wedge |
Level Map: Pivots and Technical Levels
The map overlays daily pivots (P, R1 to R3, S1 to S3), Fibonacci levels from the major impulse and the recent decline, moving averages, volume nodes and estimated liquidation pockets. The short-term central pivot sits near $73,980: as long as price stays below it, sellers hold the edge. The $72,380 – $72,700 pivot zone has the most overlaps, combining the 50% Fibonacci, the November 10 low, the S2 pivot and an estimated long-liquidation pocket.
| Level | Price (USD) | Category | Technical basis |
|---|---|---|---|
| Major resistance 3 (R3) | $77,200 – $77,800 | Daily resistance | Volume node $77,201, daily SMA20 ~$77,413, SMA100 ~$77,738 |
| Major resistance 2 (R2) | $76,050 – $76,400 | Daily/4H resistance | Double-top neckline $76,270, major 38.2% Fibonacci $76,068 and recent 23.6% $76,159, R3 pivot $76,360, estimated short pocket $76,170 – $76,787 |
| Immediate resistance (R1) | $74,700 – $74,920 | 4H/15m resistance | R1 pivot $74,773, 4H resistance $74,811, 15m resistance $74,831, 4H 23.6% Fibonacci $74,696, daily resistance $74,909 |
| Central pivot (P) | $73,900 – $74,130 | Pivot | Daily pivot $73,979, 15m resistance $74,121 (5 contacts), 15m SuperTrend $73,940 |
| Immediate support (S1) | $73,100 – $73,450 | Support | S1 pivot $73,186, daily SMA200 ~$73,114, 15m support $73,409 (5 contacts) |
| Major support 2 (S2) | $72,380 – $72,700 | Daily support | Major 50% Fibonacci $72,572, November 10 low $72,691, S2 pivot $72,392, estimated long pocket $72,380 – $72,556 |
| Major support 3 (S3) | $68,680 – $69,100 | Daily support | Major 61.8% Fibonacci $69,076, daily 1.272 extension $68,694 and 4H $68,731, estimated long pocket $68,677 – $68,766 |
Order Book and Liquidity Heatmap
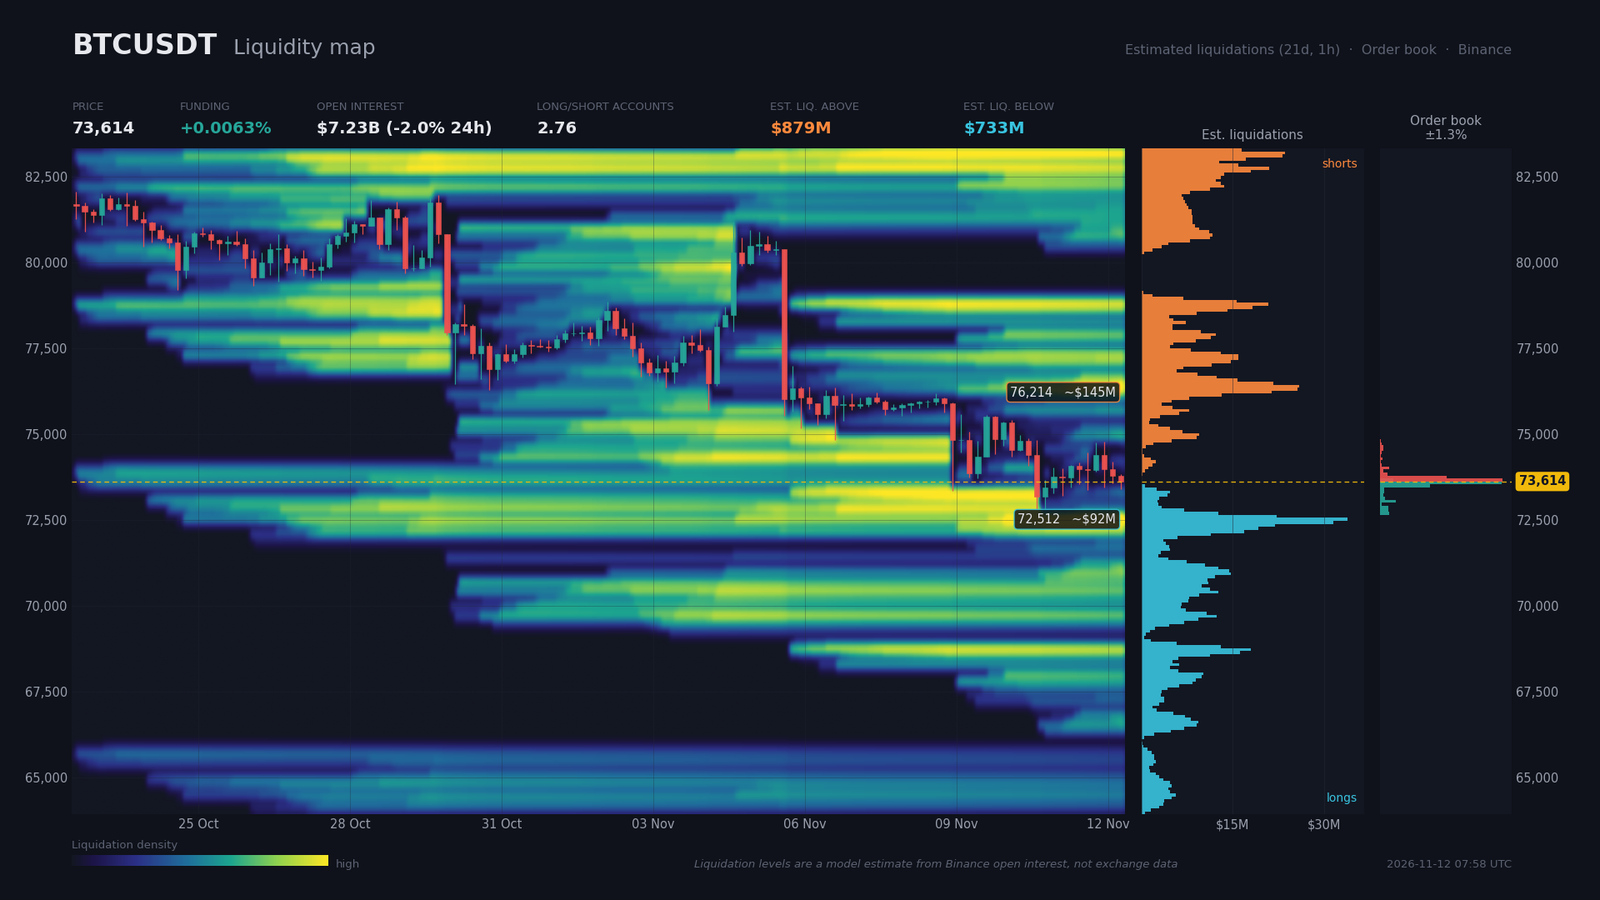
The Binance order book is only visible up to 1.32% from the price, so the walls described reflect nearby liquidity alone. Sell walls sit at $73,658 ($38.0M) and $73,746 ($20.8M), while buy walls sit at $73,570 ($37.7M) and $73,481 ($15.5M). The 4.5% imbalance in favor of buyers is small and coincides with the 15m compression: price is trapped between two walls of comparable size.
Estimated liquidation zones, built on an open-interest model rather than a direct measurement, are far more asymmetric. Above, shorts cluster between $76,170 and $76,790 (~$145M), then $78,550 – $78,900 (~$78M) and $82,960 – $83,310 (~$92M). Below, longs cluster between $72,380 and $72,560 (~$92M), then $72,115 – $72,290 (~$43M) and $68,680 – $68,770 (~$27M). The estimated total is $879M above against $733M below. The $72,380 – $72,560 pocket coincides with the 50% Fibonacci, making it a natural target for a liquidity sweep.
Low funding (+0.0063%, or ~6.9% annualized) and open interest of $7.23B, down 6.3% over seven days, point to a market leaning long: the long/short ratio is 2.76 across accounts and 2.35 among large traders, while the taker buy/sell ratio is neutral (~1.0). This positioning exposes price to a purge below $72,700, but low funding limits the scale of any bullish squeeze. A rally toward $76,170 – $76,790 would only act as a magnet if R1 breaks on volume.
Calendar: Catalysts to Watch
The calendar concentrates the key events of the week. Releases already out have set the scene: the November 6 NFP, at 165K against 65K expected, produced a limited reaction before price fell from $81,200 toward $75,800. The November 10 CPI weighed more heavily: the 12:00 UTC 4H candle lost 1.6% on volume at 471% of average, and the $72,691 low was tested in that session.
- Friday November 13, 14:30 (Zurich) — core PPI m/m (consensus 0.4%, previous 1.3%): an upside surprise would strengthen the rate-hike scenario, and the release coincides with the apex of the 4H and 15m wedges.
- Tuesday November 17, 14:30 (Zurich) — retail sales ex-autos (consensus 0.4%, previous 0.9%): a second macro test next week that could extend or unwind the PPI volatility.
- Monday November 30 — effective removal of Strategy from MSCI indices, forcing index funds to sell: outside the ten-day window, but anticipation can weigh on the market now.
Three Scenarios for the Coming Weeks
The horizon is one to two weeks. The probabilities below, set by the analyst, add up to 100%.
Scenario A — Sold rally, then test of the 200-day SMA and 50% Fibonacci (probability 45%)
The central scenario starts with a sold rally, with the November 13 PPI at 14:30 as the catalyst. A 4H rejection between $74,100 and $74,700, on the P pivot and R1 resistance, would open the way to $72,380 – $72,700 (S2), then the confirmed double-top target of $70,970, and finally the $68,680 – $69,100 S3 zone. The risk/reward ratio (R:R) toward $70,970 comes to 1.86: ($74,500 − $70,970) ÷ ($76,400 − $74,500) = 3,530 ÷ 1,900. The stop sits above the 4H ATR (~$875), which calls for smaller position sizes. Execution zone: $74,100 – $74,700, reference entry $74,500. Invalidation: 4H close above $76,400.
Scenario B — Long liquidation sweep, then technical bounce (probability 35%)
Scenario B bets on a liquidity sweep, with the volatility of the PPI or the November 17 retail sales as catalyst. Trigger: a wick below $72,556, inside the estimated long pocket, followed by a 4H close back above $72,700. The path leads to $73,100 – $73,450, then R1 ($74,700 – $74,920), with a possible extension toward $76,050 – $76,400. The R:R toward $74,800 reaches 2.44: ($74,800 − $72,600) ÷ ($72,600 − $71,700) = 2,200 ÷ 900. Execution zone: $72,400 – $72,700, reference entry $72,600. Invalidation: 4H close below $71,700, below the $72,115 – $72,290 pocket and near the S3 pivot ($71,599).
Scenario C — Bullish squeeze (probability 20%)
Scenario C represents the invalidation of the bearish thesis: a bullish squeeze triggered by a PPI below consensus. It requires a daily close above $76,270, then a 4H close above $76,400. The path would target $77,200 – $77,800, then $78,300 – $78,900, where the 38.2% Fibonacci and the estimated short pocket converge. Execution zone: $76,400 – $76,600. Invalidation: 4H close back below $75,400.
The signal to watch: Scenario A stays dominant as long as the confluence score holds at 3/5, the 4H ADX remains at 44 and ETF flows stay negative. A 4H close above $74,920 on above-average volume would shift the balance toward B, while a daily close above $76,270, followed by a 4H close above $76,400, would shift it toward C.
Synthesis and Conclusion
The market is in a distribution phase at the 200-day SMA: the double top is confirmed, highs and lows are declining, and flows (ETFs, stablecoins, short-term holders selling at a loss, MSCI pressure on Strategy) all point the same way. The purge of longs and accumulation by large holders explain the current compression, but as long as price does not reclaim $76,270, the rally remains a selling rally.
The dominant technical strategy is to sell rallies toward $74,100 – $74,700, with protection above $76,400. Buying is only justified after a sweep of $72,400 – $72,700 followed by a recovery of that zone. A weekly close below the daily 200-day SMA (~$73,100) and below the 50% Fibonacci (~$72,570) would confirm the reversal.
Sources
- Bitcoin traders raise odds of sub-$70,000 Christmas, Bitmine reports $6.3 billion annual net loss, and more — The Block, 12/11/2026
- MSCI Removes Strategy (MSTR) From Its USA Index, Forcing Index Funds to Sell by Nov. 30 — Bitcoin Magazine, 11-12/11/2026
- Stablecoin Drain, ETF Outflows Leave Bitcoin « Running on Empty » — Decrypt, 11/11/2026
- Bitcoin Short-Term Holders Send $3.6 Billion in BTC to Exchanges at a Loss — Decrypt, 11/11/2026
- Treasury yields edge higher as investors await fresh inflation and housing data — CNBC, 12/11/2026
- CPI Report Today: Inflation Eased in October, But Remains Elevated — Live Updates — WSJ, content dated 11/10/2026
- Bitcoin ETFs saw $643M outflows Friday; 2026 barely green — CoinDesk, 11/02/2026
- SEC proposes crypto asset custody framework for investment advisers and regulated funds — A&O Shearman, 10/15/2026
Disclaimer: This article is for educational and informational purposes only. It does not constitute investment advice, a recommendation to buy or sell, or an invitation to trade any financial asset. Cryptocurrency markets are extremely volatile; any investment decision should be based on your own research (DYOR) and, where appropriate, the advice of a licensed financial adviser.

