


Bitcoin trades at $83,320 (BTC/USDT, October 14, 2026), locked in a post-impulse compression phase that has tethered price since the September 21 high at $87,385 and the October 8 swing low at $80,345. The five-day change stands at +0.9%, the twenty-day change at -1.25%, and the spot remains 4.65% below the recent peak. Price has chopped around the $83,000 mark since the start of the month, in a narrow $80,345–$87,385 window that signals momentum rebalancing after the summer up-leg. The overall bias stays NEUTRAL, conviction MODERATE, with a confluence score of 3 out of 5.
Two engines drive the tape on October 14. On the derivatives side, perpetual funding sits at -0.0007% (-0.7% annualized), and open interest has pulled back 1.72% over 24 hours and 5.64% over seven days to $7.67 billion; this gradual disengagement reflects compression of directional positioning, a classic wait-and-see tell before a catalyst. The global long/short ratio of 1.277 (top traders 1.525) remains structurally long, but order-book pressure tilts bearish. US spot ETF flows, per Farside Investors, are mixed: +$118.8 million on October 6 after a -$89.8 million day on October 5, with Decrypt reporting on October 13 a cumulative net outflow of $386.3 million for October.
On the macro side, John Williams (New York Fed) confirmed on October 14 in an interview relayed by Cointelegraph that an additional rate hike remains « appropriate » this year, sustaining pressure on risk assets. The University of Michigan preliminary sentiment printed 46.3 on October 9, below the 47.6 consensus (previous 48.1), flagging consumer fragility. The regulatory backdrop stays supportive: the SEC published its draft crypto custody rules on October 1 (Investing.com), and the CFTC must finalize its leveraged/margined framework by the 2028 cycle (The Block, October 12). On-chain is constructive: Strive acquired 3,311 BTC for $280 million between October 5 and 9 at ~$84,500 (Decrypt, October 13), a whale dormant since 2020 moved 4,582 BTC for $377 million (Decrypt, October 13), and exchange reserves have dropped from 2.8 million to 2.67 million BTC since February (Bitcoin Magazine, October 13).
This configuration sets up a mild contradiction between the bearish daily technical signal and a more constructive flow and regulatory backdrop. The H4 triangle compression and the prospect of the US CPI (Consumer Price Index, headline and core inflation gauge) on October 14 at 2:30 PM neutralize any marked directional positioning in the meantime. The technical read that follows, deployed across three timeframes, attempts to give shape to this diagnosis.
Multi-Timeframe Technical Analysis
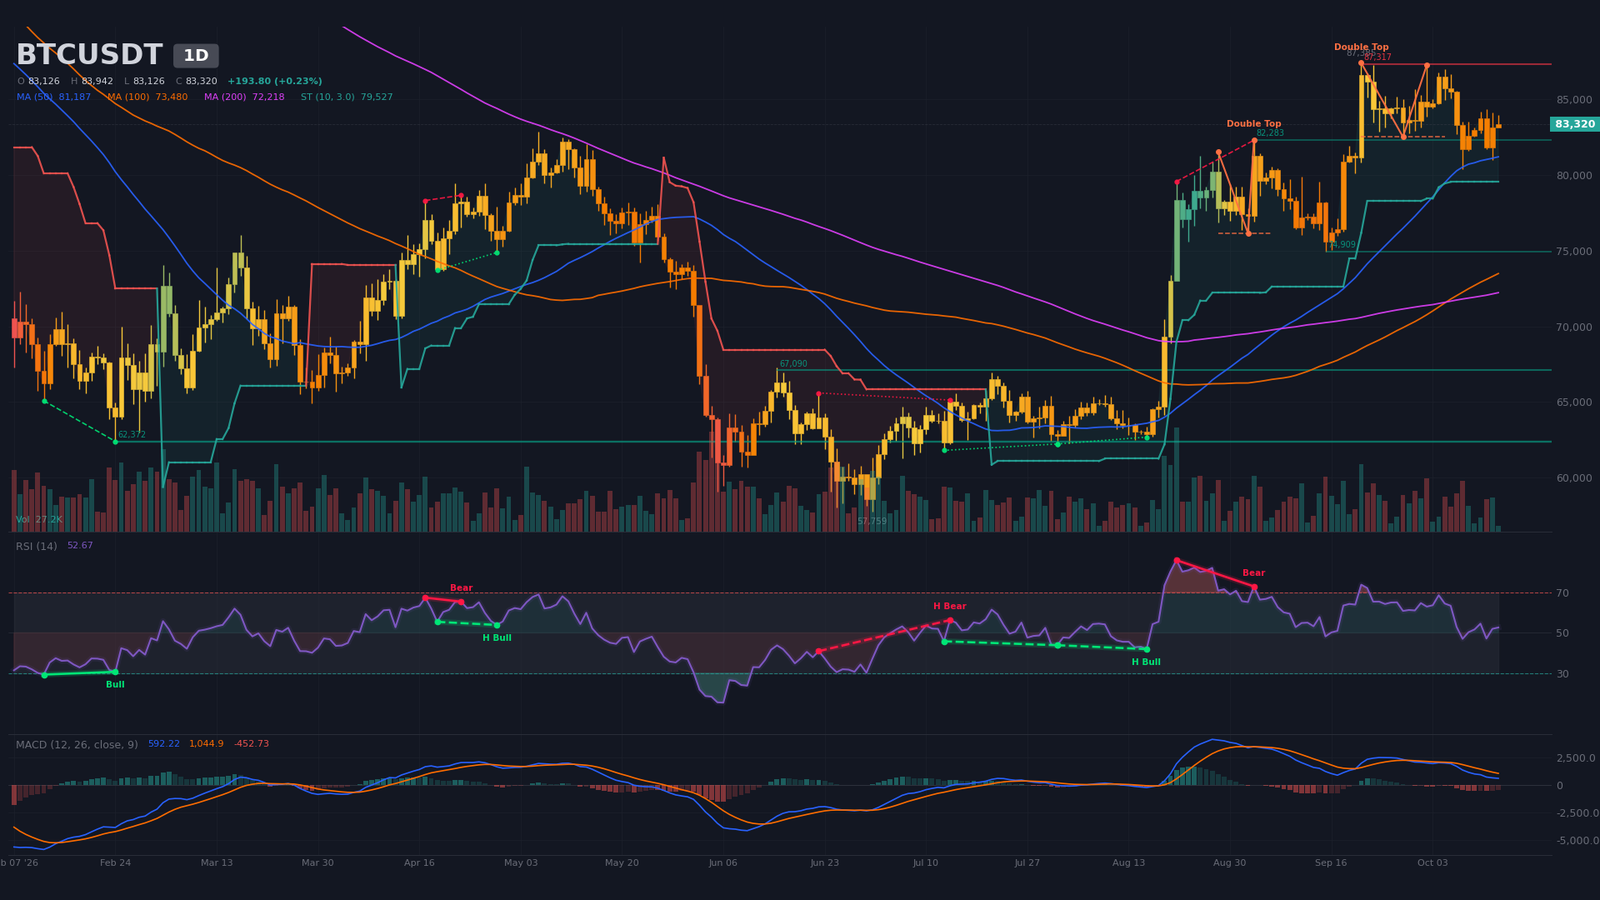
Daily Timeframe (1D): Confirmed Double Top Under Resistance
The daily chart for Bitcoin prints a confirmed bearish double top: two nearly identical peaks at $87,385 on September 21 and $87,250 on October 2, separated by a neckline at $82,500. The theoretical measured-move target, derived from the pattern’s height, sits at $77,683 — not yet reached. Price currently tests the 20-day simple moving average (SMA20) at $83,889, which it has marginally lost, while staying comfortably above the SMA50 at $81,187 and the SMA200 at $72,218. That structure argues for an intact long-term trend: the bullish crossover of the 50- and 200-day moving averages, known as the golden cross, dates from September 8, 2026 — 36 candles ago — and remains a structural long-term bullish anchor.
Momentum, however, is fragile. The 14-period RSI (Relative Strength Index, a bounded momentum oscillator reading 0 to 100) is neutral around 53, after a sequence that peaked at 63.4 then bottomed at 47.0. A regular bearish divergence — a mismatch between rising price and falling RSI, treated as an exhaustion tell — was flagged between August 21 and September 3 (price 79,555 → 82,282, RSI 86 → 73). The MACD (Moving Average Convergence Divergence, a momentum indicator built on the gap between two exponential moving averages) crossed below its signal line on September 29, 2026 — 15 candles ago — and its histogram now sits in negative territory below zero, meaning the medium-term seller dynamic dominates. Today’s volume of 27,206 represents only 22% of the 20-period average of 124,174, signaling absence of conviction on both sides. The daily SuperTrend (a trend-following overlay based on the Average True Range) stays bullish at $79,527: this is the primary long-term directional filter, and it has not flipped.
Intermediate Dynamics (4H): Symmetrical Triangle Compression
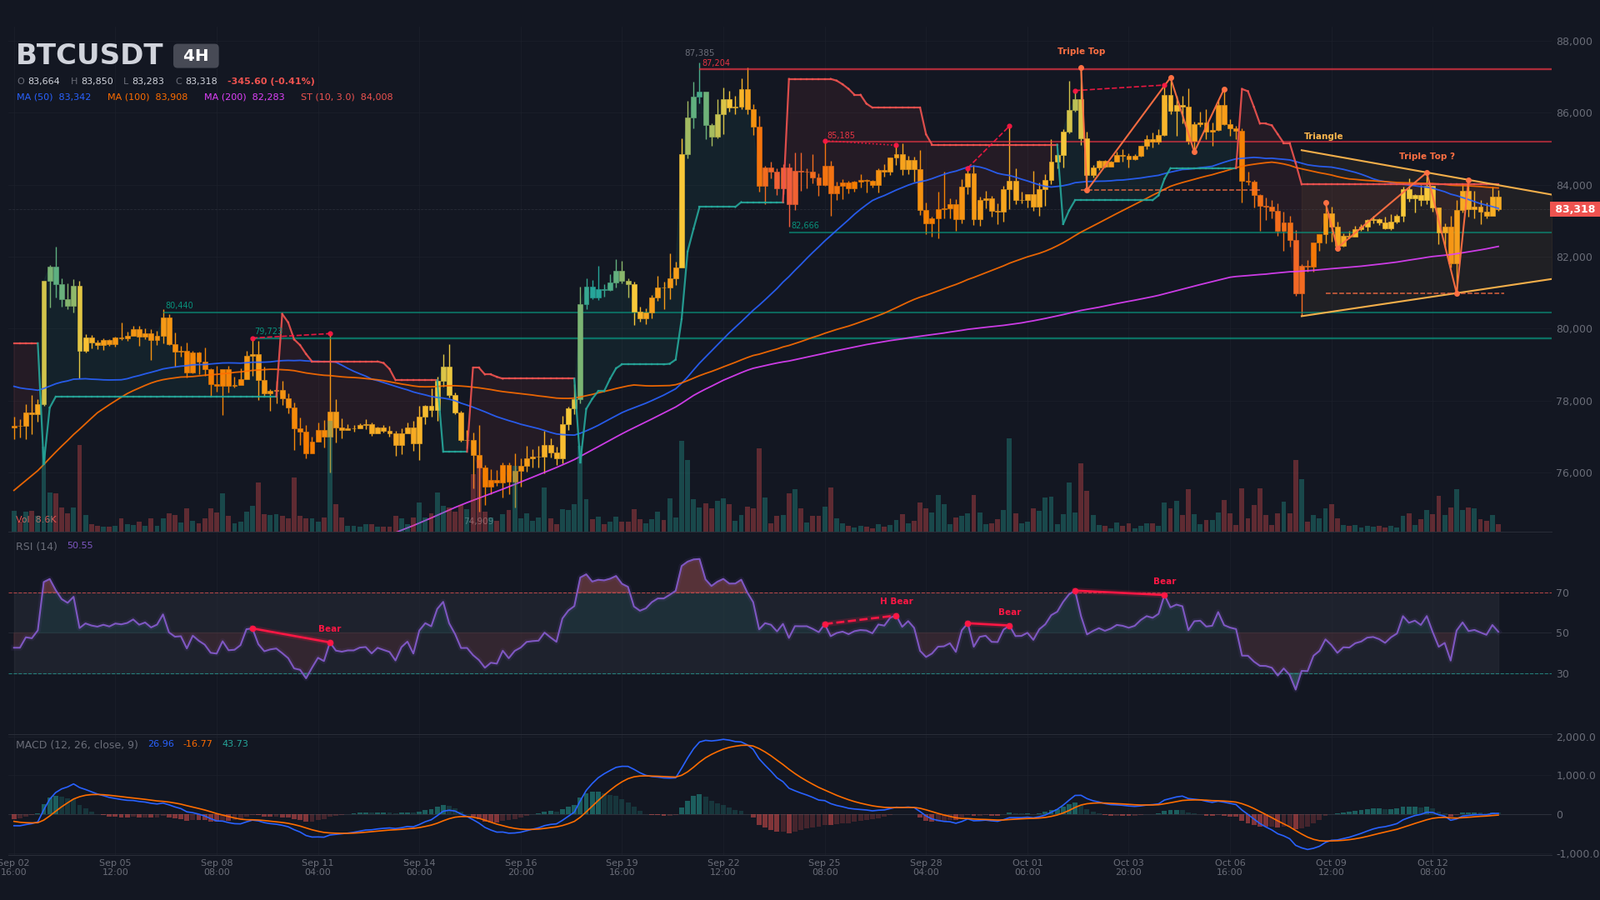
On the 4-hour chart, price trades inside an algorithmically detected symmetrical triangle (a consolidation pattern built from two converging trend lines) that began on October 8 at 4:00 PM, with the apex projected to October 22 at 9:24 PM; the upper boundary sits at $84,134, the lower at $81,034. This compression sits inside an unconfirmed bearish triple top with a $80,985 neckline, whose theoretical target at $77,978 would activate if the lower boundary gives way. Price oscillates around the 4H SMA20 ($83,276) and SMA50 ($83,342), trapped between the two — the classic signature of a wait-and-see phase. The only bearish filter comes from the 4H SuperTrend at $84,008, the first selling obstacle overhead.
The 14-period RSI around 51 is neutral, and the MACD flipped positive six candles ago (bullish crossover dated October 13 at 4:00 AM), indicating the kind of momentum rebalancing typical of a compression. Two regular bearish divergences on the October 2 and 4 tops (price $86,616 → $86,770, RSI 70.9 → 68.8) reinforce the hypothesis of a failed breakout under $84,134. Until the apex resolves, the dominant playbook stays range-bound: sell the upper boundary, buy the lower, invalidated by a directional break.
Intraday Structure (15m): Ascending Triangle Under Resistance
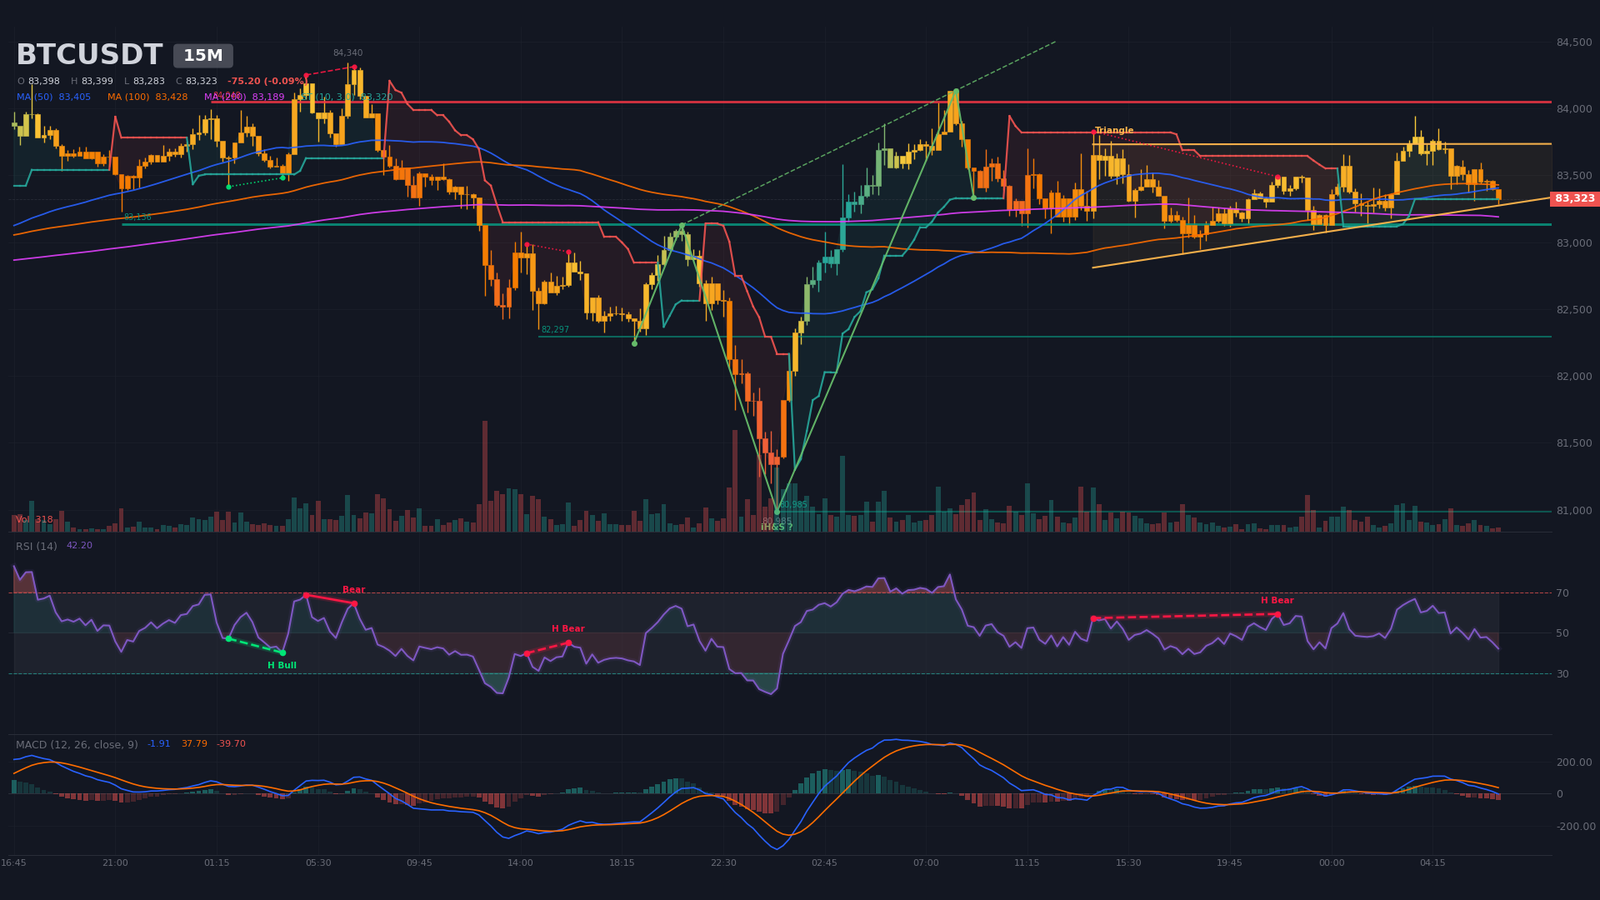
On the 15-minute chart, price is boxed by an ascending triangle (a bullish continuation pattern defined by a horizontal resistance line and a rising trend line) initiated on October 13 at 2:00 PM, with the apex projected to October 15 at midnight; the upper boundary sits at $83,734, the lower at $83,178. The pattern remains a bullish continuation setup as long as the lower boundary holds. The $83,136 intraday support has been tested six times and acts as the immediate bearish magnet. An unconfirmed inverse head-and-shoulders (a bullish reversal pattern with three troughs, the central one deepest) is taking shape, with the left shoulder on October 13 at 9:00 AM, head at $84,134, and neckline at $84,134; its theoretical target would sit at $86,693.
The RSI around 42 shows intraday exhaustion, and the MACD crossed bearish seven candles ago (October 14 at 5:15 AM) — confirmed intraday seller momentum. The 15-minute SuperTrend stays bullish at $83,320: price sits right on this level, which functions as the intraday invalidation line. The convergence of an imminent apex and a major macro catalyst on October 14 at 2:30 PM makes the next sessions the most likely point of resolution.
Multi-Timeframe Synthesis
| Timeframe | Dominant Trend | RSI (14) | MACD | Chart Pattern |
|---|---|---|---|---|
| Daily (1D) | Bullish (consolidation under resistance) | ~53 | Bearish crossover below zero (15 days) | Confirmed bearish double top |
| 4 hours (4H) | Neutral (compression) | ~51 | Bullish crossover stabilizing (6 days) | Symmetrical triangle |
| 15 minutes | Neutral (bullish compression) | ~42 | Recent bearish crossover (7 days) | Ascending triangle |
Mapping Technical Levels and Pivots
To map levels, we combine classic daily pivots, the 200-day SMA, reference swings, the highs and lows of the H4 triangle, and estimated liquidation pools. The short-term central pivot sits inside the $82,500–$83,500 zone: a confluence of the daily double-top neckline, the daily SMA20, the H4 SMA20 and SMA50, and the 15-minute support tested six times. As long as price oscillates inside this zone, no directional bias can be confirmed.
| Level | Price (USD) | Category | Technical Basis |
|---|---|---|---|
| R3 | 87,100 – 87,400 | Major resistance | Daily double-top peak (Sep 21 – Oct 2); $87,204 resistance (3 H4 touches); short liquidation pool $87,491–$87,719 |
| R2 | 85,100 – 85,300 | Major resistance | $85,185 H4 resistance (2 touches); R2 daily pivot $85,898 |
| R1 | 84,000 – 84,150 | Immediate resistance | Upper boundary of H4 symmetrical triangle ($84,134); bearish 4H SuperTrend ($84,008); inverse-H&S neckline on 15m |
| P | 83,200 – 83,600 | Central pivot | Daily SMA20 ($83,889), H4 SMA20/50, 15m support $83,136 (6 touches) |
| S1 | 81,800 – 82,300 | Immediate support | Daily SMA50 ($81,187); $82,666 H4 support (2 touches); $82,283 daily support |
| S2 | 80,900 – 81,100 | Major support | Lower boundary of H4 triangle ($81,034); $80,985 swing low; H4 triple-top neckline |
| S3 | 80,200 – 80,500 | Major support | Oct 8 low $80,345; long liquidation pool $80,585–$80,675 ($28.7M) |
Order Book and Liquidity Heatmap
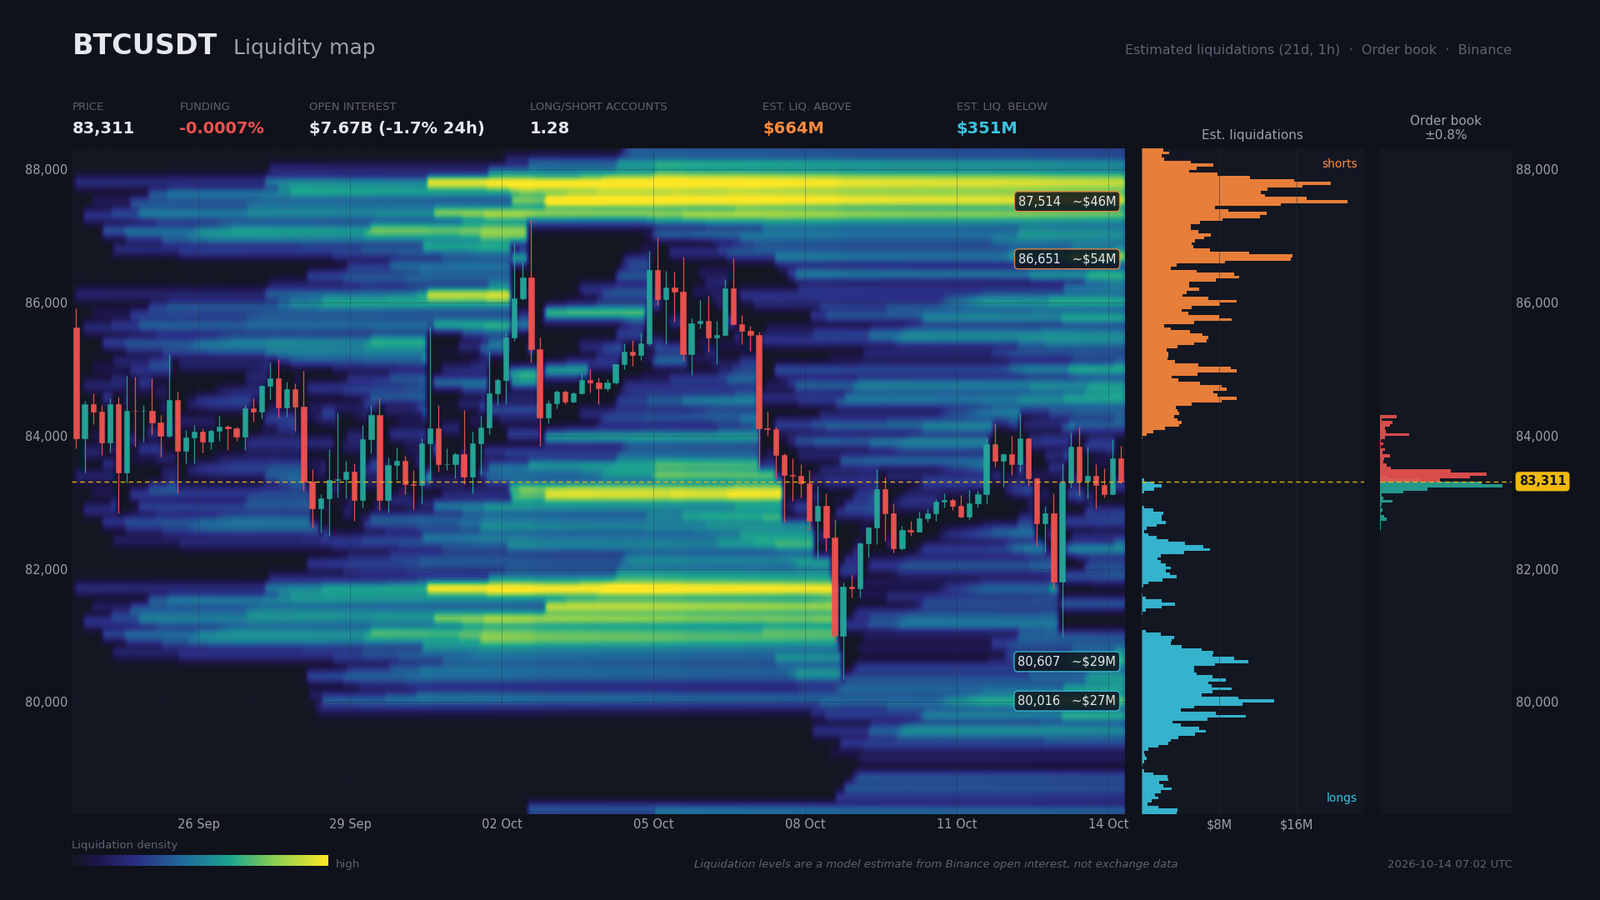
The Binance order book (84% coverage, the share of the book actually observable) shows a clear seller imbalance of -9.7% across the ±2% band: $62.9 million of bids against $76.5 million of asks. The main buyer wall sits at $83,243 for $20.5 million (-0.08%), followed by $83,288 at $17.1 million: this cluster forms the immediate bearish magnet. On the seller side, the largest wall is at $83,425 for $18.0 million (+0.14%), followed by $83,379 at $15.1 million — price is bumping against this density just above spot, and any attempted rebound fails until this threshold is absorbed.
The estimated liquidation zones above — the clusters of sell stops that would force short sellers to cover (forced buybacks, or short squeezes) — total $663.5 million. The first thick cluster sits between $86,628 and $86,765 for $54.3 million (+4.0%), followed by two other pools at $87,491–$87,537 ($45.7M) and $87,583–$87,719 ($38.2M). These levels act as a true overhead price magnet. Below, the long-side liquidation pools are more modest, totaling only $350.8 million: $80,585–$80,675 ($28.7M, -3.25%), $79,994–$80,039 ($26.7M), $79,767–$79,812 ($24.3M). These estimates remain contingent on the mapping model and can shift with price. The balance of forces tilts toward a short squeeze toward $86,600–$87,700 if CPI reassures, more than toward a bearish sweep — the buy-side liquidity is deeper but sits lower than the sell-side liquidity.
The 5.64% seven-day drop in open interest however dampens the amplification potential of any squeeze: fewer contracts in circulation means less fuel to drive a directional move. The dominant risk remains a liquidity sweep — a rapid capture of stops before reversal — that empties one side of the book before the other.
Calendar: Catalysts to Watch
The ten-day calendar concentrates every high-impact catalyst capable of resolving the compression. Five dates dominate, led by the US CPI on October 14 at 2:30 PM, the central event that can push Bitcoin out of the $84,134 / $81,034 H4 window.
- October 14, 2:30 PM (Zurich) — USD Inflation Rate MoM (consensus 0.6% vs previous 0.4%): a core CPI above 0.3% reignites the Fed-hike probability and weighs on BTC; a CPI ≤ 0.2% reopens the rally scenario.
- October 14, 2:30 PM (Zurich) — USD Core CPI m/m (consensus 336.65 vs previous 334.131): confirmation or invalidation of underlying price pressure.
- October 15, 2:30 PM (Zurich) — USD Core Retail Sales m/m (consensus 0.5% vs previous 1.4%): a sharp drop in consumption, a risk-off pivot.
- October 15, 2:30 PM (Zurich) — USD Core PPI (consensus 0.5% vs 0.4%): upstream inflation signal in the chain.
- October 16, 5:30 AM (Zurich) — Fed Chair Warsh speaks: explicit monetary policy guidance, capable of shifting the rates curve.
Three Scenarios for the Coming Weeks
Three configurations emerge over the next two to four weeks, extending through the apex of the H4 symmetrical triangle on October 22 and beyond. Their probability sums are calibrated on the current technical balance (daily double top, H4 compression) and on the expected distribution of macro surprises.
Scenario A — Rejection Under R1 and Lower Triangle Break (probability 45%)
A bearish catalyst — October 14 core CPI at 2:30 PM at or above 0.3% m/m, or a weak Chinese surprise — pushes price below the $83,136 15-minute support, triggers the loss of $82,283 on the daily, and catalyzes a cascade toward $81,187 (daily SMA50) and then $80,345 (October 8 low). Preferred path: $82,300 → $81,200 → $80,350 → $79,800 (long liquidation pool). Execution zone: $82,250–$82,350 on a 4H close below $82,283. Invalidation: daily close above $84,200 (upper triangle boundary), stop at $84,200. The reward-to-risk ratio (R:R) sits near 2.1 for a targeted gain of $1,900 against a risk of $1,950.
Scenario B — Range / Liquidity Sweep (probability 35%)
On a CPI in line with expectations (0.3% m/m) and contained volatility, the market extends the compression inside the $81,000–$84,150 range, with opportunistic probes toward the $86,628–$86,765 pool before rejection. Preferred path: oscillation between boundaries with rapid sweeps on one side then the other. Execution zone: $83,200–$83,400 buying on dips inside the compression, sell at $84,100. Invalidation: daily close outside the $80,300–$84,200 window.
Scenario C — Bullish Triangle Break and Squeeze Toward $86,600–$87,400 (probability 20%)
A core CPI at or below 0.2% m/m, or a dovish (accommodative) intervention from Fed Chair Warsh on October 16, triggers the break of $84,200 and drives price toward $85,200, then $86,600 ($54M short liquidation pool) and ultimately $87,200–$87,400 (major resistance, base of the daily double top). Execution zone: $84,200–$84,300 on confirmed 4H break, rebuy on retest. Invalidation: return below $83,100 on a 4H close, stop at $82,900 (1.3×ATR H4 = $1,025).
Synthesis and Conclusion
The overall read reveals a market in post-impulse compression where three timeframes partially contradict each other: the daily preserves a long-term bullish bias (intact golden cross, bullish SuperTrend) yet has printed a confirmed bearish double top under resistance, the 4H has folded inside a symmetrical triangle with an October 22 apex, and the 15-minute shows recent seller momentum. The compression is so tight that a single major macro catalyst — October 14 CPI at 2:30 PM — is enough to pick a direction. The order-book balance and the distribution of liquidation pools, thicker above ($663.5M shorts) than below ($350.8M longs), give a statistical edge to the bullish sweep scenario that the daily read does not yet reflect.
This bitcoin technical analysis at multiple timeframes therefore confirms the diagnosis of a market in waiting, where each boundary of the H4 triangle defines the operational framework of the day. The dominant desk playbook stays a range game inside the $81,000–$84,200 zone, with directional preference dictated by the CPI: confirmed rejection below $83,100 on a 4H close → targeting the $80,300–$80,600 protection zone; confirmed break above $84,200 → continuation toward $86,600–$87,400, invalidated under $83,100. Until the $84,134 upper boundary is taken, the compression remains the operating framework and position sizing should stay moderate. The key off-session protection level sits at $80,345 (October 8 low), whose breakdown would definitively invalidate the long-term bullish bias.
Sources
- Williams (NY Fed) on AI and rates — Cointelegraph, October 14, 2026
- Strive buys $280M of BTC — Decrypt, October 13, 2026
- Whale moves 4,582 BTC — Decrypt, October 13, 2026
- Shrinking exchange reserves — Bitcoin Magazine, October 13, 2026
- $386.3M ETF outflows in October — Decrypt, October 13, 2026
- Daily Bitcoin ETF flows — Farside Investors, data as of October 7, 2026
- Coinbase — Bitcoin post-quantum migration — The Block, October 14, 2026
- Bitwise Q3 « crypto spring » — Cointelegraph, October 14, 2026
- SEC draft crypto custody rules — Investing.com, October 1, 2026
- SEC Crypto Task Force — SEC.gov
- CFTC crypto framework and 2028 deadline — The Block, October 12, 2026
- FOMC Minutes and UoM preliminary — integrated economic calendar, week of October 7–9, 2026
- US existing home sales 1.5% — economic calendar, October 13, 2026
- China exports YoY 36.3% — economic calendar, October 14, 2026
- US CPI MoM consensus 0.6% — economic calendar, October 14, 2026
Disclaimer: This article is for educational and informational purposes only. It does not constitute investment advice, a recommendation to buy or sell, or an invitation to trade any financial asset. Cryptocurrency markets are extremely volatile; any investment decision should be based on your own research (DYOR) and, where appropriate, the advice of a licensed financial adviser.

