


Bitcoin trades at $84,230 on Binance spot, down 1.5% on the current daily candle. Price is retesting the $84,200-$84,800 daily support zone after setting a period high of $87,385 on September 21, from which it remains 3.6% distant. The nine-session streak of inflows into US spot ETFs was broken on September 30 by a $149M outflow (BIT, October 5), while profit-taking translated into $487M of long position liquidations over 24 hours, totaling $556M across all positions per CoinGlass (The Block, October 6). The market is digesting a 40% Q3 rally and arbitrating between consolidation and trend continuation.
The dominant driver of the session remains derivatives. Open interest stands at $8.13B, up 5.02% over seven days, a sign that post-liquidation deleveraging has been largely absorbed. Funding has flipped to -0.0038%, which mechanically eases selling pressure by exempting long positions from carry. The global long/short ratio of 1.40 and 1.62 among top traders, however, maintains a structurally bullish positioning skew, exposing the market to a short squeeze should the $83,200 support break. Coinbase’s acquisition of Deribit announced on October 7 (Crypto Briefing) reinforces derivatives infrastructure and represents a constructive medium-term signal for market depth.
On the macro side, the October 2 NFP (Non-Farm Payrolls) report printed only 29,000 jobs versus 90,000 expected, with the unemployment rate at 4.2% and average hourly earnings at +0.1% m/m (economic calendar) — a dovish shock that paradoxically supported risk assets, with the S&P 500 hitting a fresh record on October 6 (MarketWatch). The September 30 core PCE at 3.4% versus 3.7% consensus had paved the way for this disinflationary scenario. The RBI’s decision to hike rates 25 bps to 5.50% (CNBC, October 7), however, signals monetary divergence globally, and the FOMC minutes due tonight at 8:00 p.m. Zurich time constitute the next major catalyst.
This configuration justifies a cautious technical read. The underlying trend remains bullish — the September 8 SMA50/200 golden cross is still active, whales have accumulated 113,950 BTC over ten weeks (Bitcoin Foundation, September 28), and Strategy (1,665 BTC at $85,681 average) and Strive (1,007 BTC) continue buying — but momentum is fading, and price is sitting in an H4 compression with an apex projected for October 10. The trade now hinges between defending the $84,400-$84,800 pivot and a possible liquidity sweep below $82,800.
Multi-Timeframe Technical Analysis
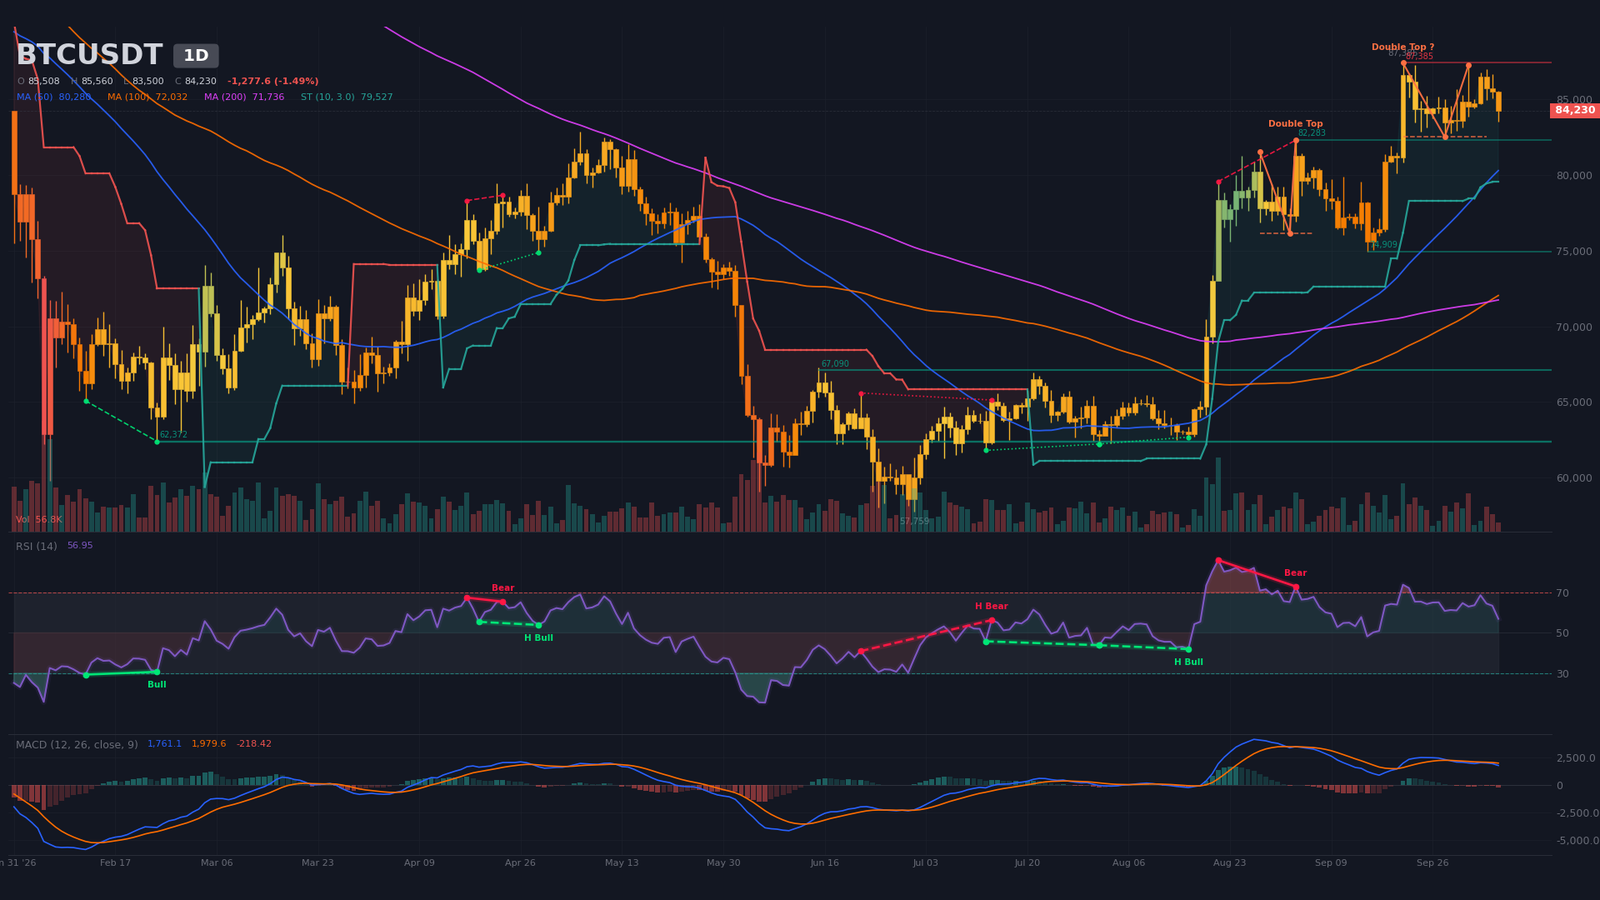
Daily Timeframe (1D): Double Top Under Major Resistance
Price trades above the three key moving averages — SMA20 at $84,210, SMA50 at $80,279, and SMA200 at $71,736 — confirming the underlying bullish trend initiated by the September 8 SMA50/200 golden cross, now 29 candles old. Price has, however, failed twice at the $87,250-$87,400 zone, at the September 21 swing high of $87,385 and the October 2 swing high of $87,249, sketching an algorithmically detected double top (unconfirmed), with a neckline at $82,500 and a bearish projection of $77,683 in case of a break. An earlier double top, this one confirmed (neckline $76,152, target $70,412), has already been filled, which lends credibility to the current setup. The daily SuperTrend remains bullish at $79,526.
RSI14 sits at 57 (neutral) and is rolling over from the October 5 peak at 69, without having reached overbought territory. A regular bearish divergence had been detected between August 21 (price $79,555, RSI 86) and September 3 (price $82,282, RSI 73) — a signal that partially played out with the drop to $74,909 on September 15. The MACD prints a negative histogram at -218 with a bearish line/signal crossover dated September 29 (8 candles ago), confirming near-term bearish momentum. The current candle’s volume is running at 41% of the 20-period average, signaling a pullback without meaningful selling conviction.
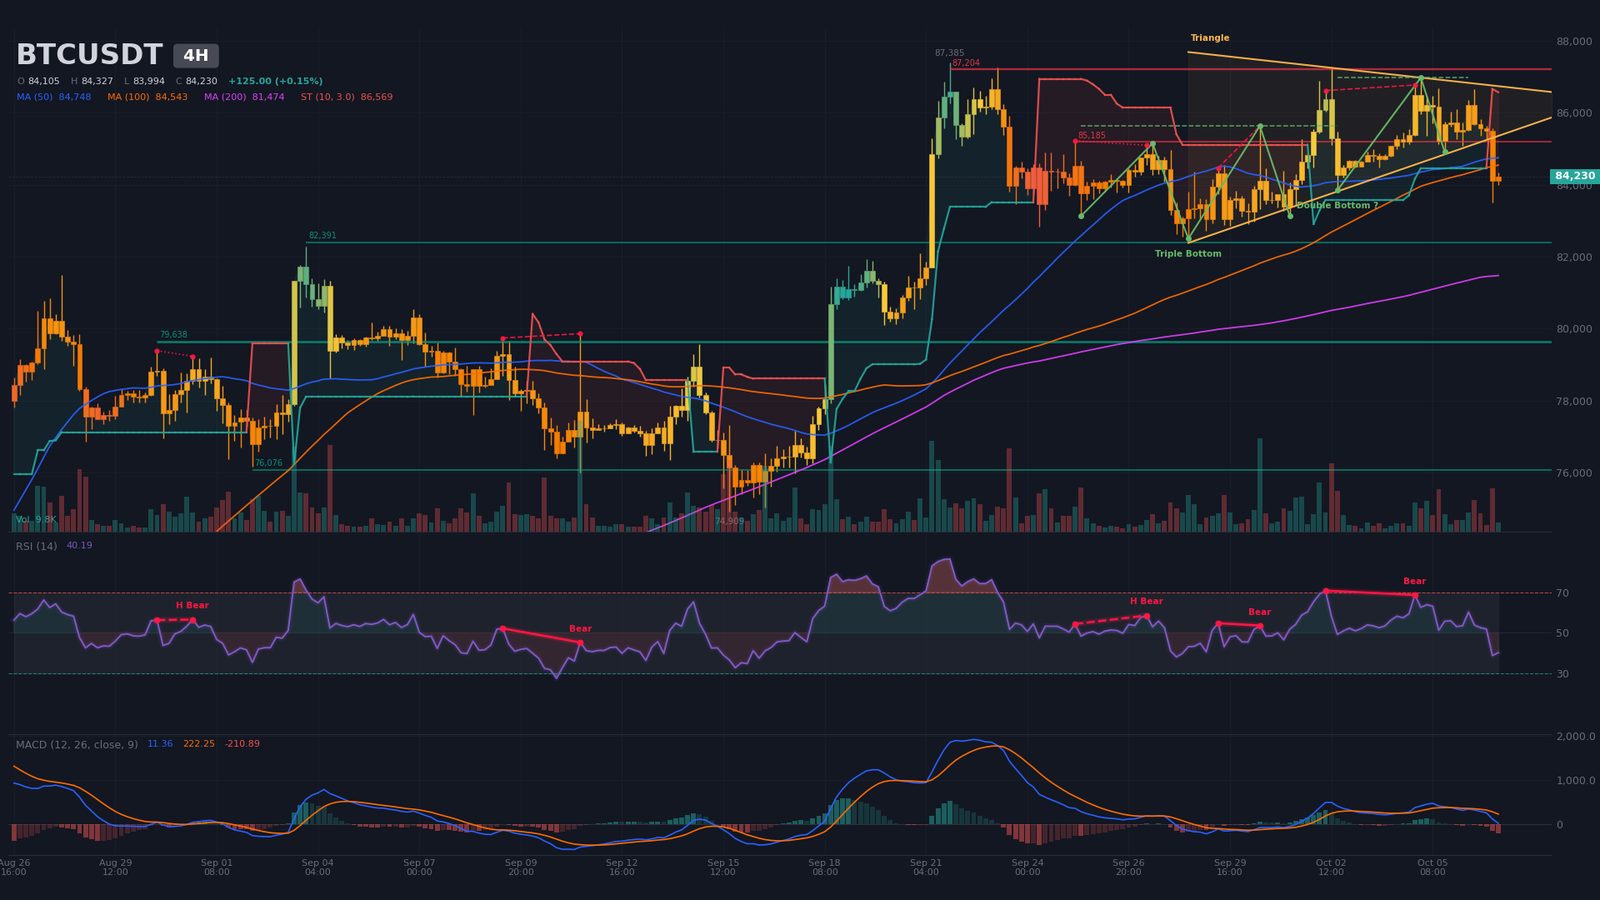
Intermediate Dynamics (4H): Symmetrical Triangle Compression
The H4 structure is dominated by an algorithmically detected symmetrical triangle, started September 28 with the latest pivot on October 5, and an apex projected for October 10 at 5:17 a.m. Zurich time. The upper boundary sits at $86,903 and the lower boundary at $84,841. Price has oscillated inside this compression for eight sessions, sitting 5% below the period high. The H4 SuperTrend has flipped bearish at $86,569 and price trades below the SMA20 ($85,478) and SMA50 ($84,748), but holds above the SMA200 ($81,474), preserving the underlying structure.
The H4 MACD crossed its signal line to the downside on October 6 (7 candles) with a negative histogram at -210. RSI14 at 40 sits in neutral-weak territory. The detector flagged two regular bearish divergences: October 2 to 4 (price $86,617 to $86,770, RSI 71 to 69) and September 29 to 30, both consistent with buyer exhaustion below resistance. Two bullish reversal patterns have also been identified: a confirmed triple bottom (neckline $85,632, target $88,343) and an unconfirmed double bottom (neckline $86,976, target $89,576). H4 volume is running at 51% of average, a sign of compression without meaningful directionality.
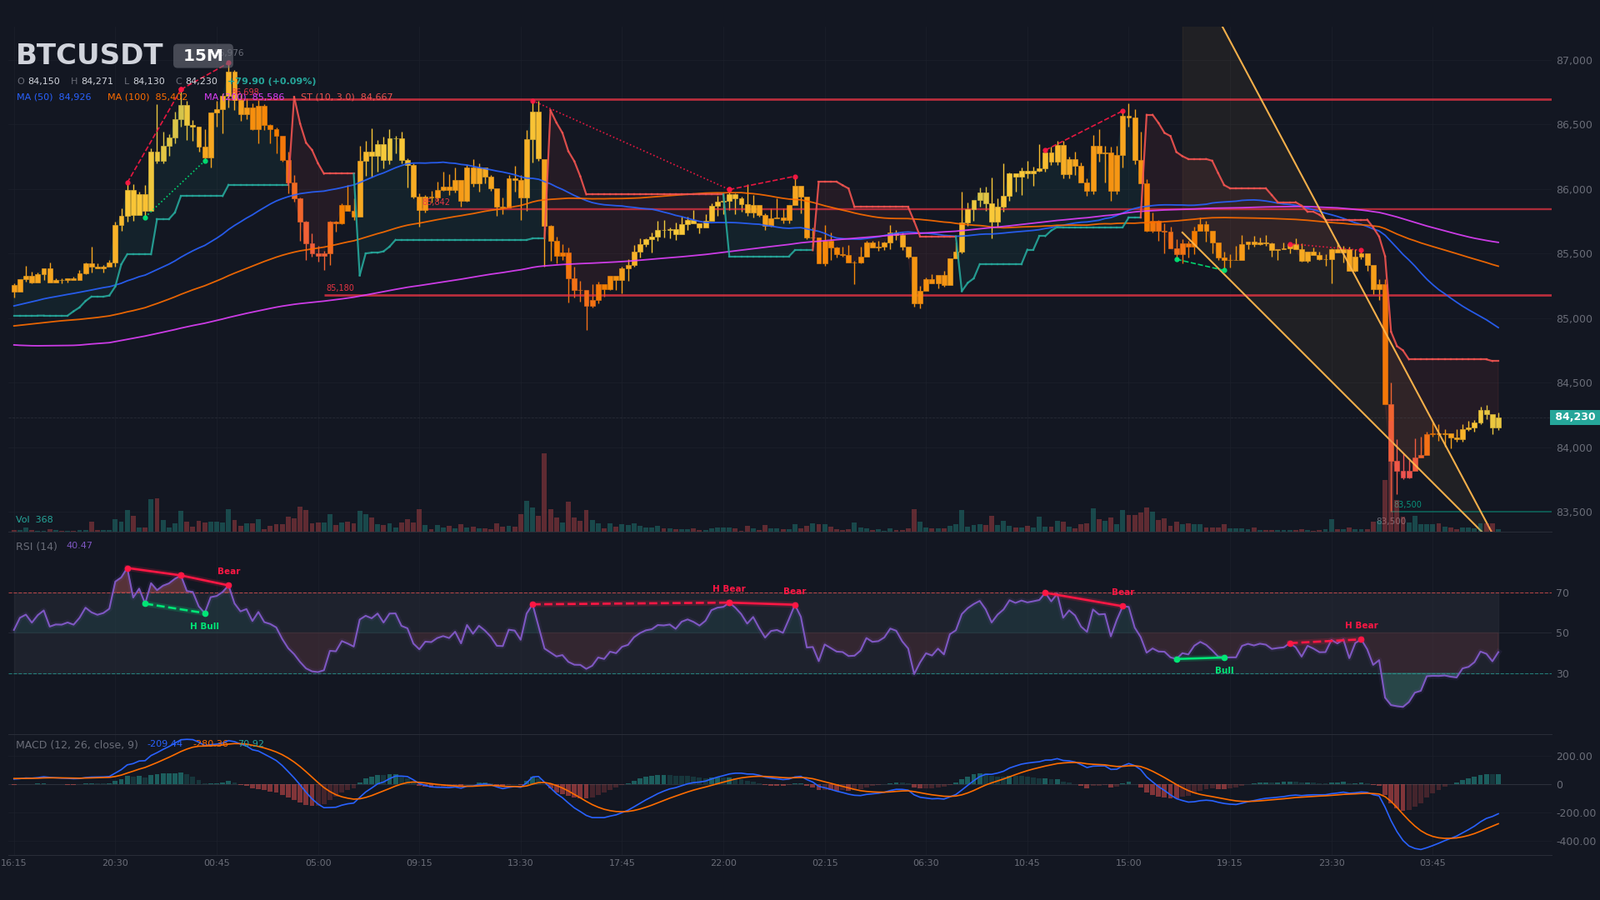
Intraday Structure (15m): Wedge Break and Emerging Bullish Divergence
On the M15 timeframe, the short-term structure is a wedge detected between October 6 at 5:15 p.m. and October 7 at 3:45 a.m., with the apex already exceeded at 6:40 a.m. Zurich time — the break is therefore underway. The upper boundary sits at $84,198 and the lower boundary at $83,724. Price briefly tagged a low at $83,500 around 2:00 a.m. before bouncing. The M15 SuperTrend is bearish at $84,666 and price remains below the SMA50 ($84,925) and SMA200 ($85,586), but trades above the SMA20 ($84,071).
The M15 MACD has just crossed bullishly (8 candles, at 4:30 a.m.) with a positive histogram at +71, and RSI14 at 40 is climbing from lows of 14-28 touched between 2:00 a.m. and 3:00 a.m. A regular bullish divergence is detected between 5:00 p.m. and 7:00 p.m. on October 6 (price lower, RSI higher), and a hidden bearish divergence between 9:45 p.m. and 12:45 a.m. — short-term buying dynamics are rebuilding, even though volume remains anemic at 14% of the 20-period average, signaling a bounce that still lacks conviction.
Multi-Timeframe Synthesis
| Timeframe | Dominant Trend | RSI (14) | MACD | Chart Pattern |
|---|---|---|---|---|
| Daily (1D) | Bullish (consolidation) | ~57 | Bearish crossover stabilizing | Double top (hypothesis) |
| 4 hours (4H) | Neutral (compression) | ~40 | Recent bearish crossover | Symmetrical triangle |
| 15 minutes | Neutral (technical bounce) | ~40 | Recent bullish crossover | Wedge break |
Mapping Technical Levels and Pivots
The levels are built from classic daily and H4 pivots, daily SMAs, swing highs/lows, and algorithmic support/resistance detections. The short-term central pivot sits in the $84,400-$84,800 zone — a confluence between the daily SMA20 at $84,210, the H4 central pivot at $84,388, and the H4 triangle lower boundary at $84,841. This zone conditions the read for the days ahead: as long as it holds, the tactical bias stays bullish; a break reactivates the risk of a sweep toward $82,800.
| Level | Price (USD) | Category | Technical Foundation |
|---|---|---|---|
| Major Resistance 3 (R3) | $87,200 – $87,400 | Resistance | Period high of $87,385 (Sept 21 swing high) and detected daily resistance at $87,385 |
| Major Resistance 2 (R2) | $86,700 – $87,000 | Resistance | H4 cluster: Oct 2 swing high at $86,616, triple/double bottom necklines at $86,976/$85,632, triangle upper boundary at $86,903 |
| Immediate Resistance (R1) | $85,700 – $86,000 | Resistance | Daily pivot $85,748, H4 SMA20 $85,478, sell wall at $84,470 (order book) |
| Central Pivot (P) | $84,400 – $84,800 | Pivot | Daily SMA20 $84,210, H4 pivot $84,388, H4 triangle lower boundary $84,841 |
| Immediate Support (S1) | $83,200 – $83,500 | Support | H4 S1 pivot $83,217, M15 low at $83,500, estimated long liquidation pocket $82,882-$83,267 ($127M) |
| Major Support 2 (S2) | $82,300 – $82,800 | Support | Detected daily support at $82,282 (Sept 3 swing high reconverted), double top neckline at $82,500 |
| Major Support 3 (S3) | $79,500 – $80,300 | Support | Daily SuperTrend bullish at $79,526, daily SMA50 $80,279, Sept 2 swing low $76,152 |
Order Book and Liquidity Heatmap
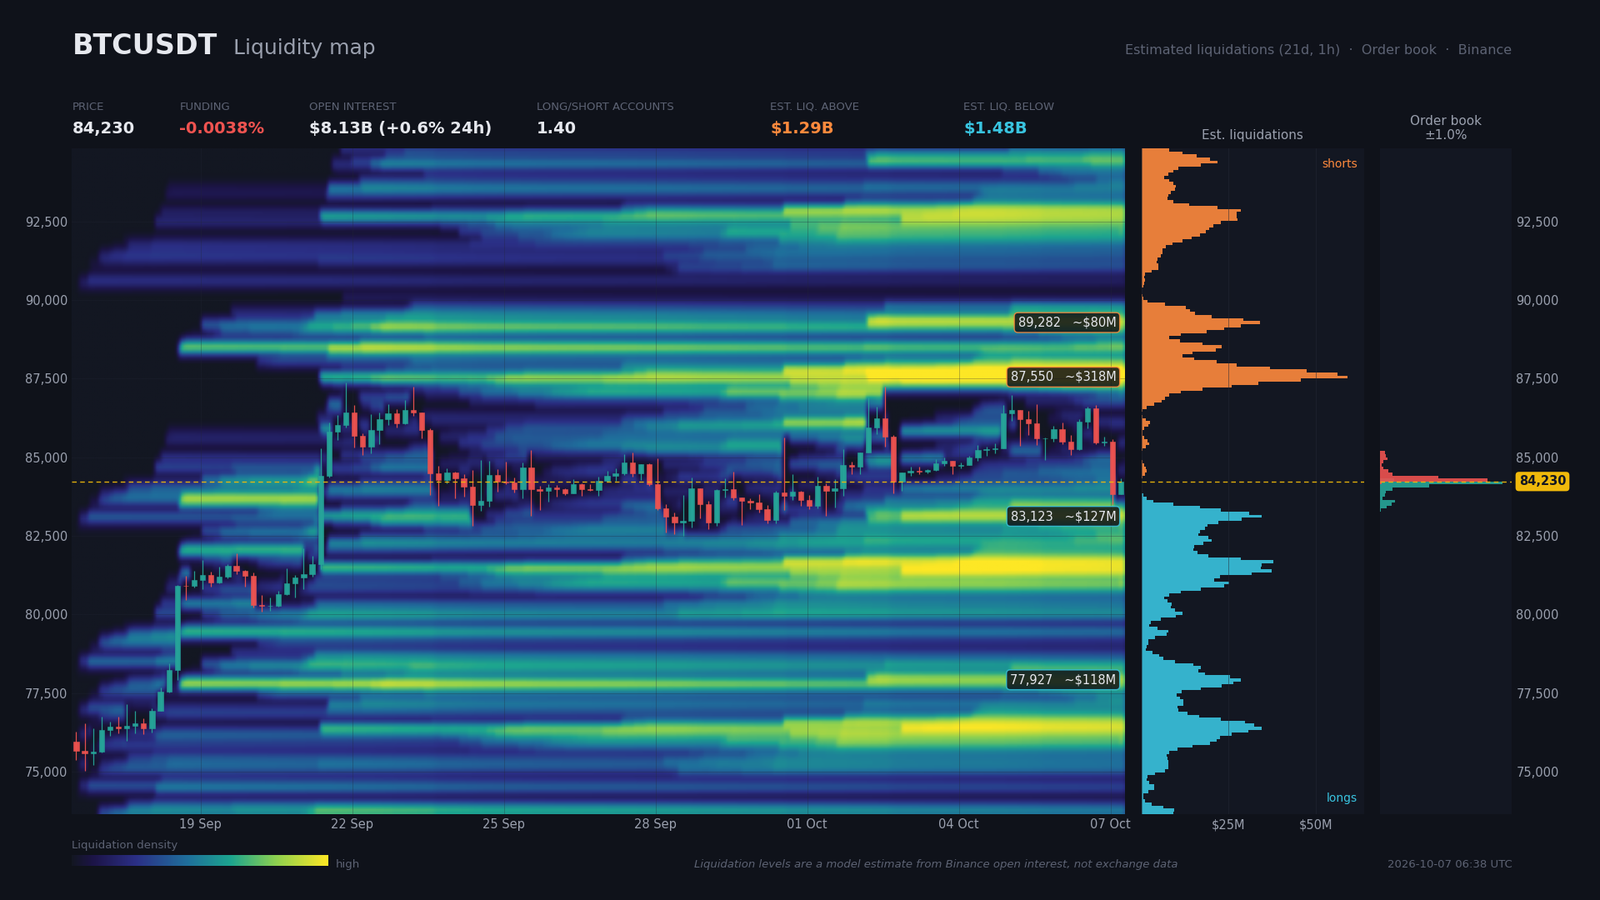
The Binance order book is slightly buy-imbalanced with $79.2M in bids against $68.8M in asks over a 2% distance, a positive imbalance of 7%. The main buy wall sits at $84,182 ($39.7M, -0.06% from spot), followed by $84,086 ($16.0M) and $83,990 ($4.1M) — a dense concentration in the $83,900-$84,200 zone that constitutes the first bearish magnet in case of a break. On the sell side, the main wall is at $84,278 ($34.9M, +0.06%), followed by $84,374 ($19.0M): the immediate resistance is therefore very close to spot, which limits the near-term bullish directional premium. Book coverage is only 1.04%, meaning beyond ±1% of spot, only estimated liquidations inform liquidity.
Open interest stands at $8.13B with a 24-hour change of +0.58% and a 7-day change of +5.02% — a moderate advance indicating that post-liquidation deleveraging has been largely absorbed. Funding at -0.0038% (annualized -4.1%) is slightly negative: shorts pay longs, which discourages follow-through and mechanically limits downside without guaranteeing a bounce. Long/short ratios remain structurally bullish: 1.40 across all accounts and 1.62 among top traders — a positioning skew that exposes the market to a short squeeze if the $83,200 support fails. The 24h taker buy/sell ratio at 0.94 confirms current selling pressure.
Estimated liquidation pockets (model estimate, not on-chain measured) are as follows: above, $318M between $87,213 and $87,887 (peak at $87,550, +3.9%), then $80M between $89,234 and $89,426, and $67M between $92,506 and $92,698 — a total above of $1.29B that constitutes a bullish magnet for the weeks ahead. Below, $127M between $82,882 and $83,267 (-1.3%), $114M between $81,246 and $81,535 (-3.4%), and $118M between $77,686 and $78,071 (-7.5%) — a total below of $1.48B. The bearish skew (more liquidations below than above) reinforces the risk of a liquidity sweep below $82,800 before a buyer return, a classic post-impulsion purge scenario.
Calendar: Catalysts to Watch
Three events dominate the ten-day agenda and condition the range exit. The immediate inflection point is the FOMC minutes tonight at 8:00 p.m. Zurich time: their tone, hawkish or dovish, will determine the direction of the sweep. The October 14 US CPI print is the major test of the disinflation narrative and conditions monetary policy expectations.
- Wednesday, October 7, 8:00 p.m. (Zurich) — FOMC minutes (no numerical consensus): stakes = hawkish/dovish dispersion after the weak October 2 NFP. Immediate catalyst.
- Thursday, October 8, 2:30 p.m. — Jobless claims: consensus 200k, prior 197k (economic calendar): confirmation of labor market cooling.
- Friday, October 9, 4:00 p.m. — UoM preliminary sentiment: consensus 47.6, prior 48.1 (economic calendar): gauge of household morale.
- Wednesday, October 14, 2:30 p.m. — US CPI m/m: prior core 0.3% (economic calendar): major test of the disinflation narrative and Fed expectations. Medium-term catalyst.
- Wednesday, October 14, 3:30 a.m. — China inflation y/y: prior 0.8% (economic calendar): signal of Chinese inertia and impact on risk-correlated assets.
- Thursday, October 15, 8:00 a.m. — UK GDP 3-month (economic calendar): UK surprise = USD/GBP reaction and spillover to Bitcoin.
Three Scenarios for the Coming Weeks
The current compression makes probabilistic framing necessary. The cumulative probability of the three scenarios is 100%, and the median scenario (A) corresponds to the neutral near-term read of the H4 structure. Probabilities are derived from the technical configuration (H4 apex on October 10, daily MACD below its signal line, unconfirmed double top) weighted by the flow context (whales accumulating, ETF outflows temporary) and the macro agenda.
Scenario A — Consolidation $83,200-$86,000 (probability 50%)
Price remains trapped in the H4 triangle until the October 10 apex, with an operational range bounded by daily S1 ($83,200) and R1 ($85,750). The neutral catalyst is the FOMC minutes tonight at 8:00 p.m. Zurich time, which should support the monetary status quo after the weak NFP. The expected trajectory combines range oscillation with excursions to the edges before a return to the pivot. Execution zone: buy on pullback to $83,200-$83,500 with invalidation below $82,800 (H4 close). Targets: $85,750 then $86,700. Stop at $82,500 (1× H4 ATR ≈ $800). R:R ≈ 2.2.
Scenario B — Liquidity Sweep Below $82,800 (probability 30%)
Price pierces the $82,800 support to trigger the estimated long liquidation pocket between $82,882 and $83,267 ($127M) before a technical return. The catalyst is an unexpectedly hawkish tone from the FOMC minutes or a test of the daily SMA50 at $80,280. The expected trajectory is a quick sweep below $82,800, followed by a buyer return into the $80,300-$80,800 zone ($81,246-$81,535 pocket + daily SMA50). Execution zone: buy on bounce in the $80,300-$80,800 zone. Invalidation: H4 close below $79,500 (daily SuperTrend). Targets: $84,200 then $86,900. R:R ≈ 2.5.
Scenario C — Bullish Break Above $87,000 (probability 20%)
The catalyst is a dovish surprise from the FOMC minutes combined with a daily close above $87,200. The expected trajectory targets $88,340 (confirmed H4 triple bottom target) then $89,580 (double bottom target), with a magnet at $89,300 ($80M short liquidation pocket). Execution zone: long activation on confirmed break of $87,200 on daily close. Invalidation: return below $85,750 on H4 close. R:R ≈ 1.8.
Synthesis and Conclusion
Bitcoin consolidates after a 40% Q3 rally and a test of $87,400. The underlying trend remains bullish — the September 8 SMA50/200 golden cross, the daily SuperTrend bullish, and price above all daily SMAs attest to it — but medium-term momentum is fading (daily and H4 MACD below their signal lines, unconfirmed double top). The flow context (whales accumulating 113,950 BTC over ten weeks per the Bitcoin Foundation, ETF inflows through September 30, corporate buybacks by Strategy and Strive) structurally supports the bullish thesis, while the weak NFP print (29,000 jobs, October 2) neutralizes restrictive monetary pressure.
The dominant technical strategy remains patience. The preferred read is to wait for an H4 close above $85,750 to activate a bullish bias toward $86,700-$87,400, or conversely to monitor for a clean sweep below $82,800 to chase the liquidation purge into $80,300-$80,800. The main protection level sits at $79,500 (daily SuperTrend) — its loss on a daily close would invalidate the entire bullish framework and force a tactical review.
Sources
- Bitcoin briefly slides below $84,000 as crypto long liquidations reach $487 million — The Block, October 6, 2026
- India’s central bank hikes rates for the first time since 2023 as inflation risks build — CNBC, October 7, 2026
- The S&P 500 is back in record territory as the ‘Magnificent Seven’ ride to the rescue — MarketWatch, October 6, 2026
- SEC maps out crypto custody in new proposal that furthers its digital assets agenda — CoinDesk, October 1, 2026
- SEC Targets Crypto Custody Rules in Major Regulatory Shift — Investing.com, October 2, 2026
- Bullish bitcoin (BTC) bets build as open interest jumps by $2.3 billion — CoinDesk, October 2, 2026
- Leverage Went to Futures, Not Options — BIT Weekly, October 5, 2026
- Bitcoin Whales Are Buying Again: 113,950 BTC Added in 10 Weeks — Bitcoin Foundation, September 28, 2026
- Coinbase acquires Deribit, expands US derivatives offerings — Crypto Briefing, October 7, 2026
- $350M St Cloud CEO: The First Credit Union to Put Bitcoin on Core Ledger — Bitcoin Magazine, October 6, 2026
- Kalshi’s 15-min gold markets overtake Ether just weeks after launch — Cointelegraph, October 7, 2026
- Economic calendar (Binance / FOMC calendar) — accessed October 7, 2026, 8:39 a.m. Zurich time
Disclaimer: This article is for educational and informational purposes only. It does not constitute investment advice, a recommendation to buy or sell, or an invitation to trade any financial asset. Cryptocurrency markets are extremely volatile; any investment decision should be based on your own research (DYOR) and, where appropriate, the advice of a licensed financial adviser.

