


Bitcoin trades at $84,500 on September 27, 2026, up a modest 0.11% on the daily candle, after a five-session consolidation that pulled the price back from the $87,385 intra-month cycle high reached on September 21 toward the $84,000 zone. The compression amplitude remains tight — $3,900 between the two boundaries, or 4.5% of spot — signaling a market in waiting mode, suspended on a known macroeconomic catalyst: the U.S. core PCE release on Wednesday, September 30. The current phase is one of imminent decision, with a bullish daily structure but deteriorating H4 momentum.
The dominant market driver remains institutional rotation into U.S. spot Bitcoin ETFs. According to The Block (September 26), ETFs pulled in $2.4 billion over the week, their largest weekly haul since October 2025, flipping year-to-date flows into positive territory — roughly +$887M per Farside, +$934M per SoSoValue — after a $5.69 billion hole opened on July 13. Decrypt (September 26) confirms a seven-day winning streak totaling nearly $3 billion since September 17. BlackRock’s IBIT captured $1.2 billion for the week, while Morgan Stanley’s MSBT logged its best week since its April launch at $203.3M. This inflow contrasts with a -9.45% drop in open interest over seven days to $7.94 billion on Binance, a sign of leverage deflation that cleans the market before the catalyst.
On the macro and regulatory side, the U.S. 10-year yield hit 5.23% on Friday, its highest since 2007 per CNBC (September 26), fueled by the massive bond issuance tied to the AI capex cycle. CME FedWatch was pricing a 64% probability of an October rate hike on Friday — a restrictive scenario that, paradoxically, does not break crypto’s underlying bid, supported by the September 24 Trump-Xi summit — a deal on $30 billion in tariff cuts and an AI dialogue, per CNBC (September 26) and Reuters (September 25). Among recent releases, U.S. jobless claims on September 24 came in at 197k (consensus 201k, prior 198k) and durable goods orders on September 25 printed 0% m/m (consensus -0.4%), both supportive of the soft landing narrative.
This combination — structural ETF flows, cleaned leverage, the PCE in the crosshairs — frames a Bitcoin technical analysis in which the current compression is highly likely to resolve through a directional breakout within 48 to 72 hours.
Multi-Timeframe Technical Analysis
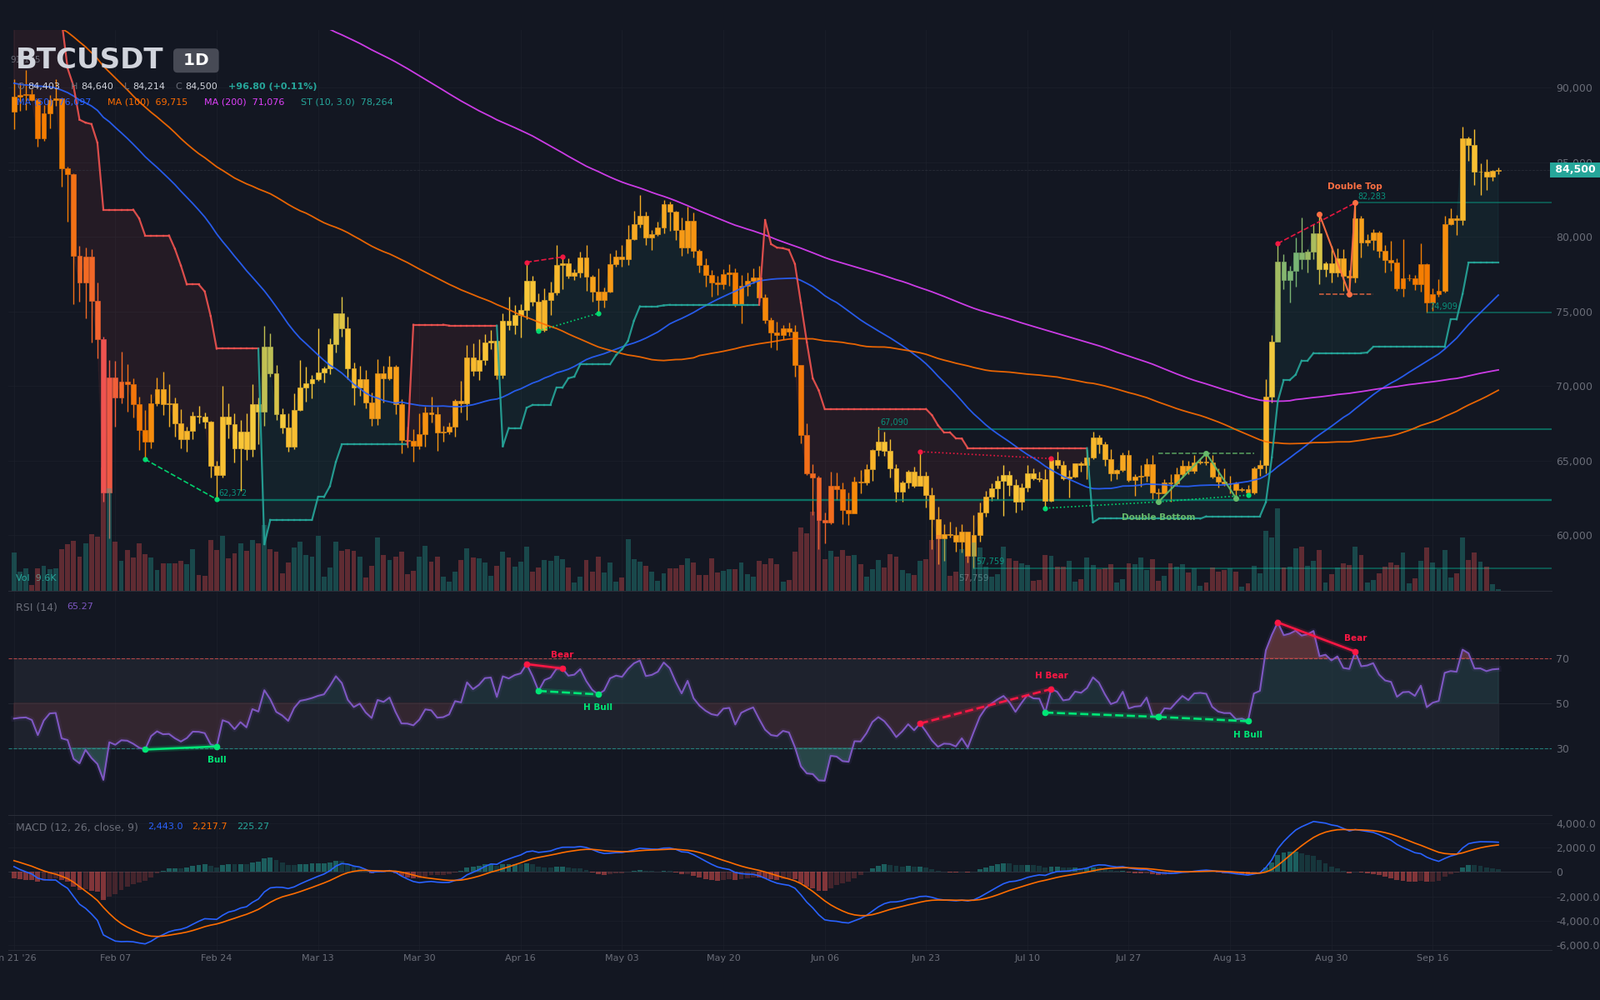
Daily Timeframe (1D): Post-Impulse Bull Flag
The dominant daily structure is a bullish flag (bull flag) consolidation formed after the September 14-21 impulse (74,909 → $87,385, i.e. +16.7%). Price has traded in a tight horizontal channel between $82,800 and $84,600 since the September 21 high. All moving averages remain stacked bullishly below the price: SMA20 at $80,422, SMA50 at $76,097, SMA200 at $71,076 — with spot trading +18.9% above the latter. The SMA50/SMA200 golden cross, dated September 8 (19 candles), remains the structural anchor of the cycle.
The daily MACD keeps its bullish configuration: line at 2,443, signal at 2,218, histogram positive at 225. The last bullish cross dates to September 21 (six candles) — precisely the impulse peak. RSI14 at ~65 stays in elevated-neutral territory, retreating from the 73.86 high hit on September 21. The bearish double top detected on the August 21 and September 3 swings (neckline $76,152, target $70,412) appears invalidated by the break above $82,282 and the rally to $87,385: it requalifies as a continuation structure provided price holds $82,000. The regular bearish divergence from August 21 to September 3 (price 79,555 → 82,283; RSI 86 → 73), however, remains the most relevant warning signal — it preceded the seven-week correction. Daily volume stays anemic at 6.6% of the 20-period average, typical of a healthy consolidation ahead of a directional break.
Intermediate Dynamics (4H): Symmetrical Triangle at Apex
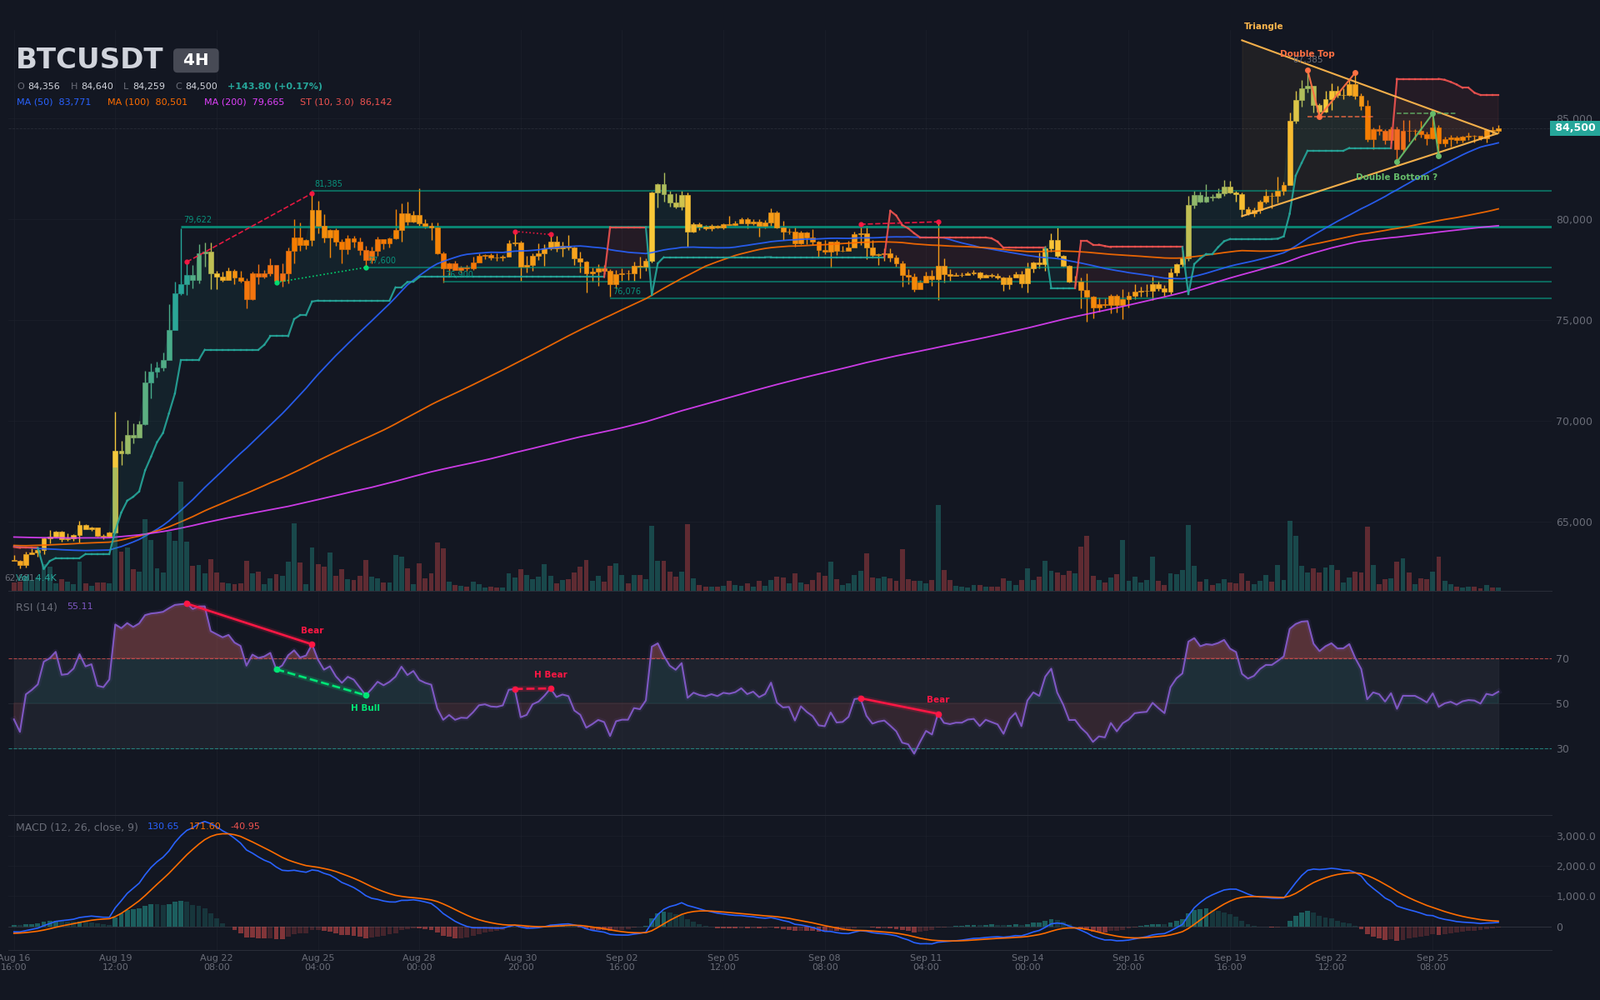
The dominant H4 structure is a symmetrical compression triangle that began on September 20, with the apex estimated for September 27 — that is, today. Boundaries sit at $85,287 (upper) and $83,294 (lower). Price has oscillated within this pattern for six sessions, paired with a degraded H4 MACD: line at 130.7, signal at 171.6, negative histogram at -41, last bearish cross on September 23 (23 candles). H4 RSI14 at ~55 sits anchored in neutral territory, with no directional momentum.
Recent swing highs (87,385 on 09/21, 86,700 on 09/22, 87,247 on 09/23) trace a descending sequence of tops, while swing lows (85,080 on 09/22, 83,450 on 09/23, 83,130 on 09/25) edge slightly higher: a classic algorithmic bearish head-and-shoulders setup (neckline $85,080, target $82,844), albeit unconfirmed. An unconfirmed bullish double bottom (neckline $85,224, target $87,467) competes directly with the bearish pattern: a break of $85,000 will separate the two setups over the next few sessions.
Intraday Structure (15m): Compression Wedge
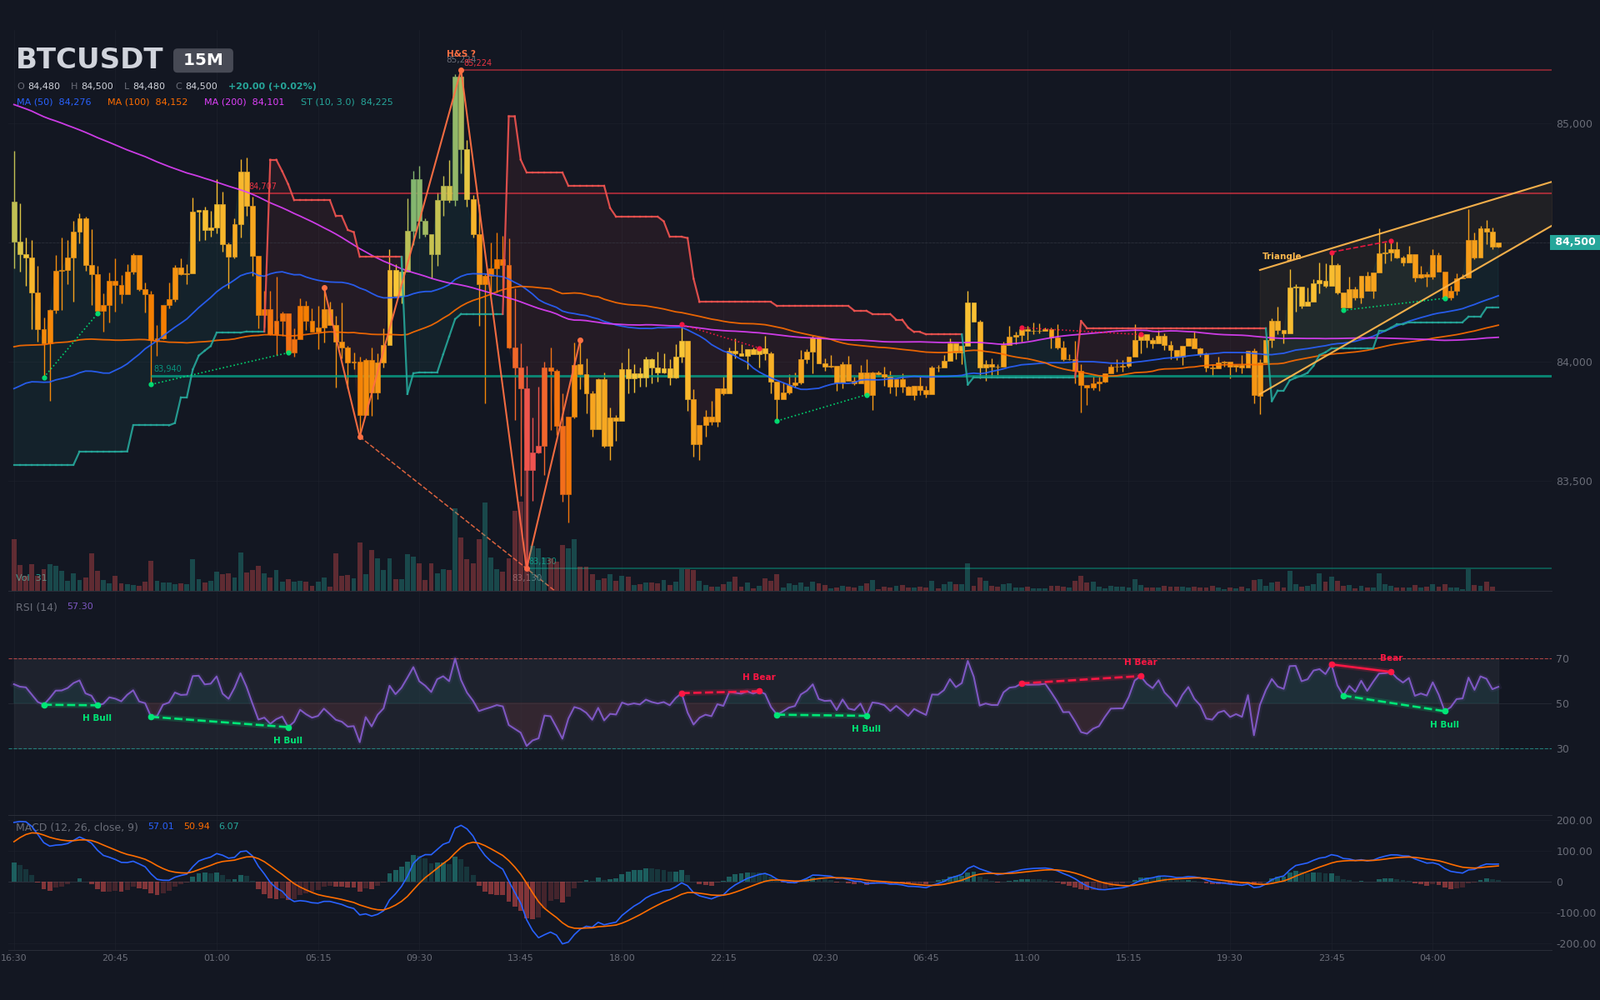
On the M15, the dominant structure is a compression wedge formed since September 26 at 20:45, with the apex forecast for 15:41 today. Boundaries sit at $84,648 (upper) and $84,368 (lower). Price at $84,500 trades in the middle of the wedge, with the M15 MACD turning bullish since 06:00 (histogram +6.07) and RSI14 at ~57. The major intraday support is the $83,940 zone (11 touches), reinforced by $83,778 (recent swing low). Intraday resistances lie at $84,707 (two touches), then $85,224 (September 25 high, double-bottom H4 neckline). The Binance order book confirms a sell imbalance of -24%: a massive bid wall at $84,449.9 ($29.1M) protects spot at -0.06%, while an equivalent ask wall at $84,550.1 ($27.2M) blocks the immediate upside at +0.06%.
Multi-Timeframe Synthesis
| Timeframe | Dominant Trend | RSI (14) | MACD | Chart Pattern |
|---|---|---|---|---|
| Daily (1D) | Bullish (consolidation) | ~65 | Bullish (cross 09/21) | Post-impulse bull flag |
| 4 hours (4H) | Neutral (compression) | ~55 | Bearish (cross 09/23) | Symmetrical triangle (apex 09/27) |
| 15 minutes | Neutral (compression) | ~57 | Bullish (cross 06:00) | Wedge (apex 15:41) |
Technical Levels and Pivots Map
The method combines classic daily pivots, daily and H4 swing highs and lows, estimated liquidation concentrations and chart pattern targets. The short-term central pivot sits at $84,200 (daily pivot), an immediate congestion zone where institutional bid flows concentrate.
| Level | Price (USD) | Category | Technical Basis |
|---|---|---|---|
| R3 | 87,400 – 87,700 | Major resistance | H4 swing high 09/21 (87,385) + extrapolated H4 triangle resistance + estimated liquidation pool (87,307-87,608, $92.3M) |
| R2 | 85,200 – 85,500 | Immediate resistance | H4 double bottom neckline (85,224) + Binance ask wall $85,151.7 ($27.6M) + M15 wedge upper boundary |
| R1 | 84,650 – 84,700 | Nearby resistance | Binance ask wall $84,650.4 ($15.2M) + daily R1 $84,657.9 + M15 resistance at $84,707.3 |
| P | 84,200 – 84,380 | Central pivot | Daily pivot $84,204 + M15 wedge base + intraday congestion |
| S1 | 83,940 – 84,200 | Immediate support | Daily S1 pivot $83,949 + M15 support $83,939.8 (11 touches) + bid wall $84,449.9 |
| S2 | 83,100 – 83,300 | Major support | H4 swing low 09/25 (83,130) + M15 support $83,130.1 + H4 triangle lower boundary (83,294) |
| S3 | 80,800 – 81,300 | Deep major support | Estimated liquidation pool (80,890-81,291, $71.6M) + daily swing low $82,832 (09/24) |
Order Book and Liquidity Heatmap
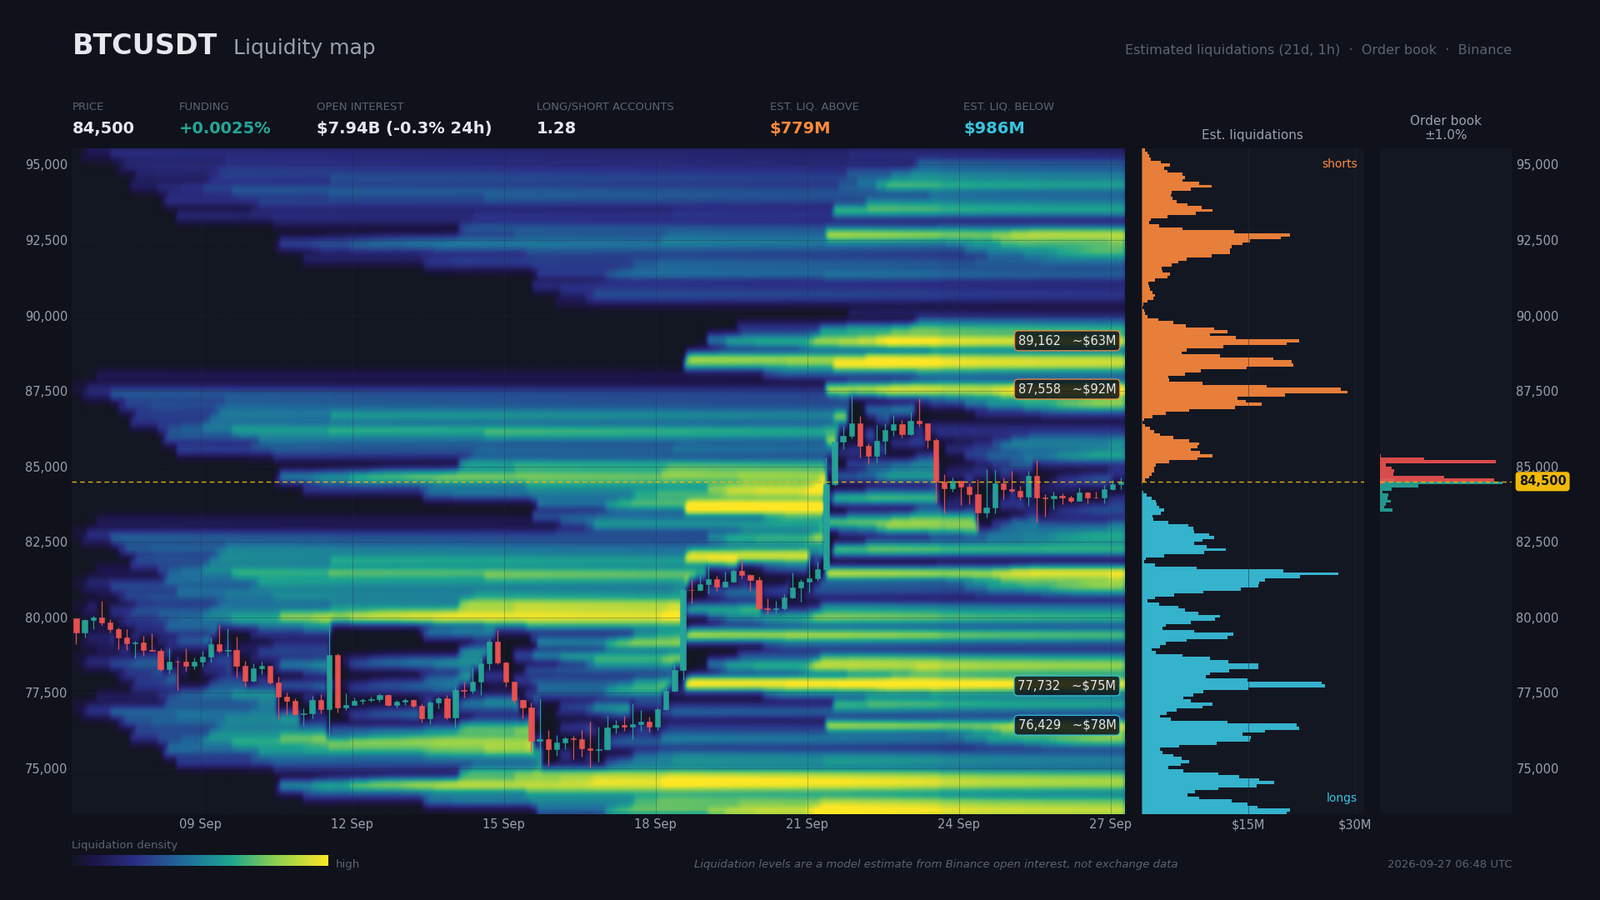
The aggregated Binance order book, covering 0.98% of price, reveals a net sell imbalance of -24%: $91.6M in asks versus $56.1M in bids within the ±2% band. The nearest bid wall sits at $84,449.9 ($29.1M, -0.06%), forming an intraday reference floor; further out, walls at $84,349.6 ($9.0M) and $83,547.5 ($2.9M). On the ask side, walls cluster at $84,550.1 ($27.2M, +0.06%), $84,650.4 ($15.2M, +0.18%), then a second tier at $85,151.7 ($27.6M, +0.77%) defining the intermediate resistance. Consequence: the market is boxed in a $100 band in the very short term, with a breakout trigger on a break of $84,700 (buy side) or $84,350 (sell side).
Estimated liquidation pools (open interest 1h model) are skewed to the downside: $986M below price versus $779M above. Below spot: $76,178-76,478 ($77.8M), $77,682-77,882 ($74.7M), $80,890-81,291 ($71.6M). Above: $87,307-87,608 ($92.3M), $89,011-89,212 ($62.8M), $92,521-92,721 ($54.7M). OI at $7.94 billion has dropped -9.45% over seven days, a sign that leverage has been cleared — which reduces the odds of a brutal squeeze. Annualized funding at 2.7% stays neutral, with a global long/short ratio of 1.28 (top traders 1.92) and a taker buy/sell at 1.07: a mildly long bias, but not crowded. Read: a moderate downside magnet near-term, a liquidity sweep toward $83,130-83,940 plausible before any upside resumption.
Calendar: Catalysts to Watch
The late-September and early-October macro sequence will concentrate most of the volatility expected on Bitcoin. Two high-impact U.S. releases — Wednesday’s core PCE and Friday’s NFP — sit alongside a symbolic regulatory departure (Hester Peirce) and a leading indicator (JOLTS).
- Tuesday September 29, 16:00 (Zurich) — JOLTS job openings (consensus 7.23M, prior 7.271M): a leading indicator of labor market tightness; a marked drop would strengthen the dovish camp ahead of the PCE.
- Wednesday September 30, 14:30 (Zurich) — Core PCE m/m (consensus 0.3%, prior 3.7%): main catalyst. A hawkish surprise (≥ 0.4%) would revive the Fed hike scenario and weigh on risk; a dovish surprise (< 0.2%) would amplify the post-pivot rally.
- Wednesday September 30, 14:30 (Zurich) — Final GDP t/t (consensus 1.6%, prior 2.1%): confirmation of the slowdown; a print below consensus would be read as dollar-negative and risk-positive.
- Friday October 2, 14:30 (Zurich) — NFP (consensus 100k, prior 162k; unemployment 4.2% vs 4.1%): second major event. A soft print would reignite the rally; a solid print would keep long-end yields under pressure.
- Friday October 2 — Official departure of SEC Commissioner Hester Peirce (Cointelegraph, September 26): a regulatory inflection point to monitor, with no immediate price impact but symbolic for the ecosystem.
Three Scenarios for the Coming Weeks
The projection horizon runs through the September 30 PCE and, beyond it, the October 2 NFP. Three paths are mapped, with a moderately bullish probabilistic bias as long as spot holds $82,800.
Scenario A — Bullish Break Toward $87,500 (probability 45%)
Trigger: core PCE ≤ 0.2% on 09/30 OR a confirmed break above $84,707 on the M15 today. Path: $84,700 → $85,224 (R2, H4 double-bottom neckline) → $85,800 → $87,000-87,400 (R3, $92.3M estimated liquidation pool). This trajectory would reactivate the daily bull flag and open an extension target toward $90,000 ($62.8M pool). Execution zone: $84,600-84,750 on the break. Invalidation: H4 close below $83,940 (daily S1). Stop: $83,450 (daily S2, i.e. ~1×H4 ATR of $718). R:R ≈ 2.0.
Scenario B — Range and Liquidity Sweep Toward $83,130 (probability 35%)
Trigger: core PCE in line with consensus (0.3%) with no directional surprise OR failure below $84,700 on the M15 today. Path: $84,500 → $84,200 (daily P) → $83,940 (S1) → $83,450 → $83,130 (S2, H4 swing low). Such a sweep would reload bid books and set up a structural rebound. Execution zone: accumulation $83,940-84,200. Invalidation: daily close above $85,224. Stop: $84,750 (0.8×daily ATR). R:R ≈ 2.5.
Scenario C — Bearish Break Toward $80,900 (probability 20%)
Trigger: core PCE ≥ 0.4% on 09/30 OR NFP > 150k on 10/02. Path: $84,000 → $82,800 (09/24 low) → $81,800 → $80,900 ($71.6M pool, S3). This trajectory would invalidate the daily bull flag and reopen the bearish double-top scenario with a $70,412 target. Execution zone: $82,800-83,130 on a confirmed break. Invalidation: daily return above $83,940 with bullish daily MACD preserved. Stop: $83,940 (1.2×daily ATR). R:R ≈ 3.0.
Synthesis and Conclusion
Bitcoin is digesting a +50% impulse from the August 14 low and consolidating in a daily bull flag whose H4 apex hits today. The daily structure remains bullish as long as $82,800 holds; the -9.45% drop in OI over seven days has cleansed the market, and ETF flows (seven consecutive days, +$3 billion) provide a structural bid floor. The liquidity magnet remains skewed lower, but the convergence of apexes (H4 today, M15 at 15:41) precedes the macro volatility window by only a few hours.
The dominant strategy is to buy dips in the $83,130-83,940 zone with a stop below $82,800, and to sell extensions toward $87,400 ahead of Wednesday’s PCE, where the expected volatility makes carry risky. The priority protection level is the $82,800 zone: a break there invalidates the entire bullish scenario and flips the read toward Scenario C.
Sources
- Bitcoin ETFs turn positive for 2026 with $2.4 billion weekly inflow — The Block, 26/09/2026
- Bitcoin ETFs Notch Seven-Day Winning Streak as 2026 Flows Turn Green — Decrypt, 26/09/2026
- The 10-year Treasury yield is at its highest in nearly two decades — CNBC, 26/09/2026
- China, U.S. agree to $30 billion tariff cut, AI dialogue during Xi visit — CNBC, 26/09/2026
- Four takeaways from Trump’s summit with Xi in Washington — Reuters, 25/09/2026
- Ethereum Bulls Are Closing In on a Major Breakout — CryptoPotato, 27/09/2026
- SEC Commissioner Hester Peirce to leave post on Oct. 2 — Cointelegraph, 26/09/2026
- Fed requests comment on two proposals for stablecoin issuers under GENIUS Act — Cointelegraph, 26/09/2026
- How Crypto Stopped Waiting for Congress and Learned to Love the Regulators — Decrypt, 26/09/2026
Disclaimer: This article is for educational and informational purposes only. It does not constitute investment advice, a recommendation to buy or sell, or an invitation to trade any financial asset. Cryptocurrency markets are extremely volatile; any investment decision should be based on your own research (DYOR) and, where appropriate, the advice of a licensed financial adviser.

