


On September 20, 2026, Bitcoin is trading around $80,304, just below the pivotal resistance zone at $82,000–$82,300, following a spectacular vertical recovery from its weekly low of $75,000. The market has just absorbed, without any structural breakdown, a combination of major macroeconomic and regulatory shocks. This technical resilience has produced a rare setup: a clear buyer-favoured asymmetry at a threshold that could well mark the pivot of the current cycle toward an impulsive expansion phase.
Macroeconomic Backdrop: A Market Absorbing Bad News
Bitcoin’s resilience over recent sessions reflects a qualitative shift in how the market is digesting macroeconomic news flow. On September 15, 2026, the US Senate rejected, by a vote of 49 to 51 — short of the required 60 votes — the procedural motion to advance the CLARITY Act, temporarily stalling the establishment of a clear federal regulatory framework for digital assets. This setback triggered a sharp deleveraging across altcoins. Less than 24 hours later, the Federal Reserve raised its benchmark rate by 25 basis points, bringing the target range to 3.75%–4.00%, in a context where a return of inflation to target is now not expected before 2029.
Despite this double shock, the dip below $75,000 was only fleeting, immediately met by passive institutional buying. As early as September 17, US spot Bitcoin ETFs recorded a reversal in flows, with $159.5 million in net inflows. This dynamic caught an especially crowded short positioning on derivatives markets off guard, triggering a major short squeeze on September 18: over $204 million in short positions liquidated and open interest expanding to $56.45 billion.
| Macro factor | Empirical observation | Operational impact |
|---|---|---|
| FOMC decision (Sept. 16, 2026) | 25 bps hike (3.75%–4.00%) | Lower wick absorbed at $75,000, no selling capitulation |
| CLARITY Act | Senate procedural vote fails (49 votes) | Liquidity reallocation from altcoins into Bitcoin |
| US spot ETF net flows (Sept. 17) | +$159.5M net inflows | Breaks the outflow streak, absorbs spot float |
| Derivatives liquidations (Sept. 18) | $219.15M liquidated, 93.4% short-side | Mechanical fuel for the breakout above $80,000 |
| Fear & Greed Index | From 48 to 57 points | Healthy normalization, no excess euphoria |
Daily Structure (1D): Testing the 200-Day Moving Average
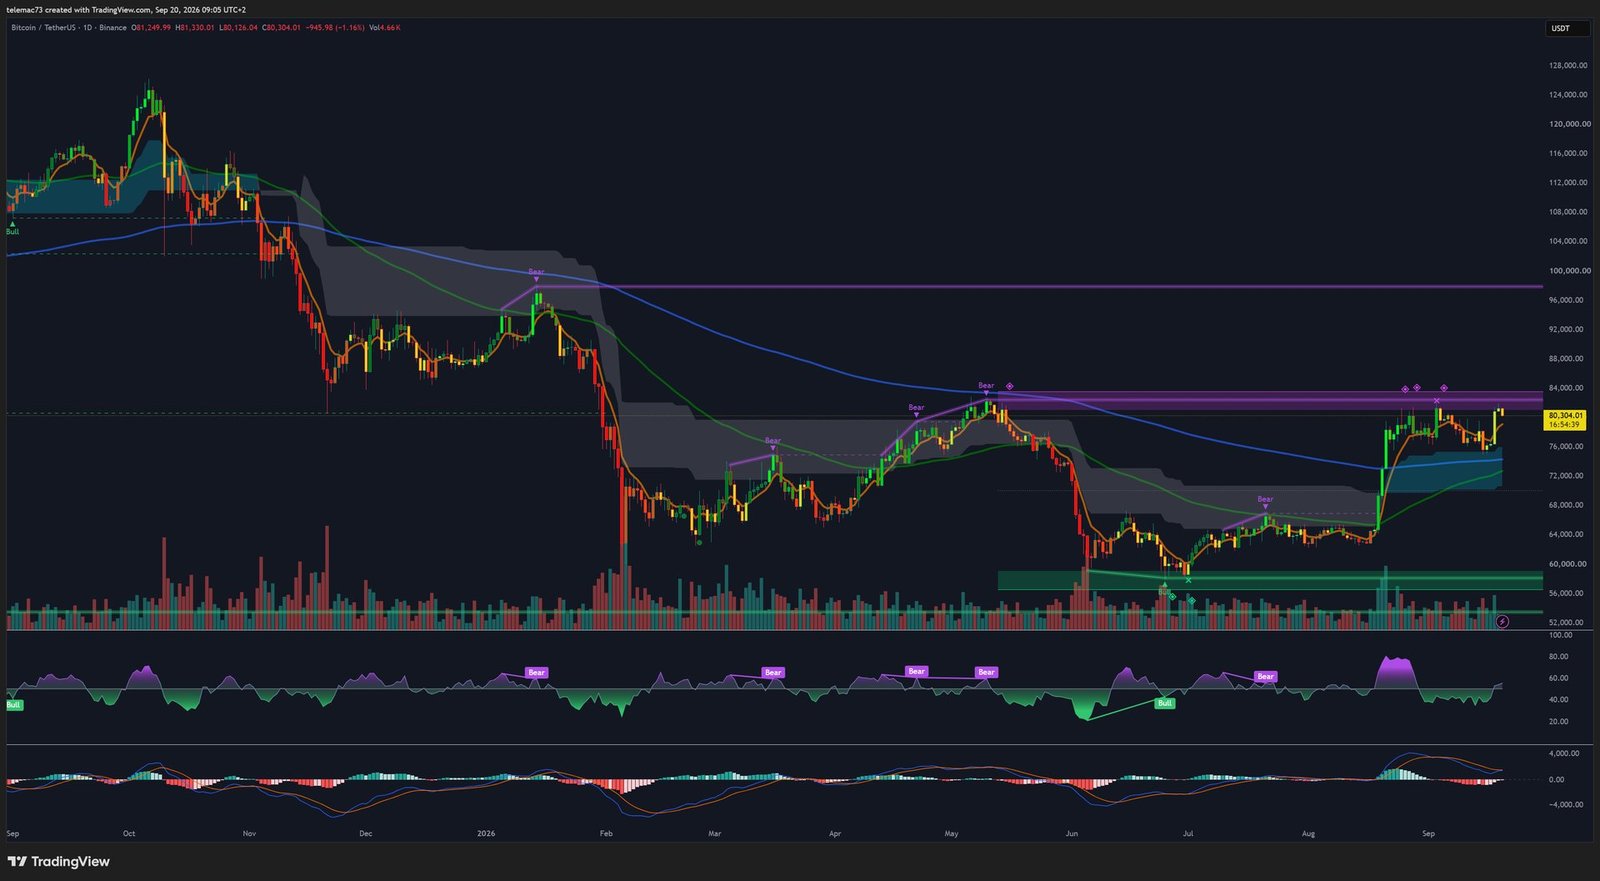
The daily chart illustrates the closing stage of a broad reversal structure that began forming over the summer of 2026. After a multi-month correction from the October 2025 all-time high of $126,198, the market built a solid accumulation floor between $58,000 and $64,000, following the June low of $57,832. The late-August impulse pulled price out of that summer range, followed by an orderly consolidation above the 50-day EMA.
Price is now running into a major structural congestion zone between $82,000 and $84,000, which corresponds to the distribution order block formed in May 2026 and coincides with the descending slope of the 200-day EMA. This zone marks the technical dividing line between the cyclical recovery phase and an official shift into a second-wind bull market.
The daily RSI stands at 63.5, having risen steadily since retesting the median 50 level during the September 16 flush — well below the overheating peak of 78 seen in August, leaving substantial room for expansion before reaching an extreme saturation zone. The daily MACD retains the bullish signature of its Golden Cross validated at the end of August, even though the histogram shows a temporary deceleration typical of compression phases beneath resistance. Primary support remains firmly defined between $75,000 and $76,000 — a level that fully absorbed the FOMC-related wick — with intermediate support at $72,000 and an absolute structural floor on the $64,800 volume cluster.
4-Hour Dynamics: A Tightening Bull Flag
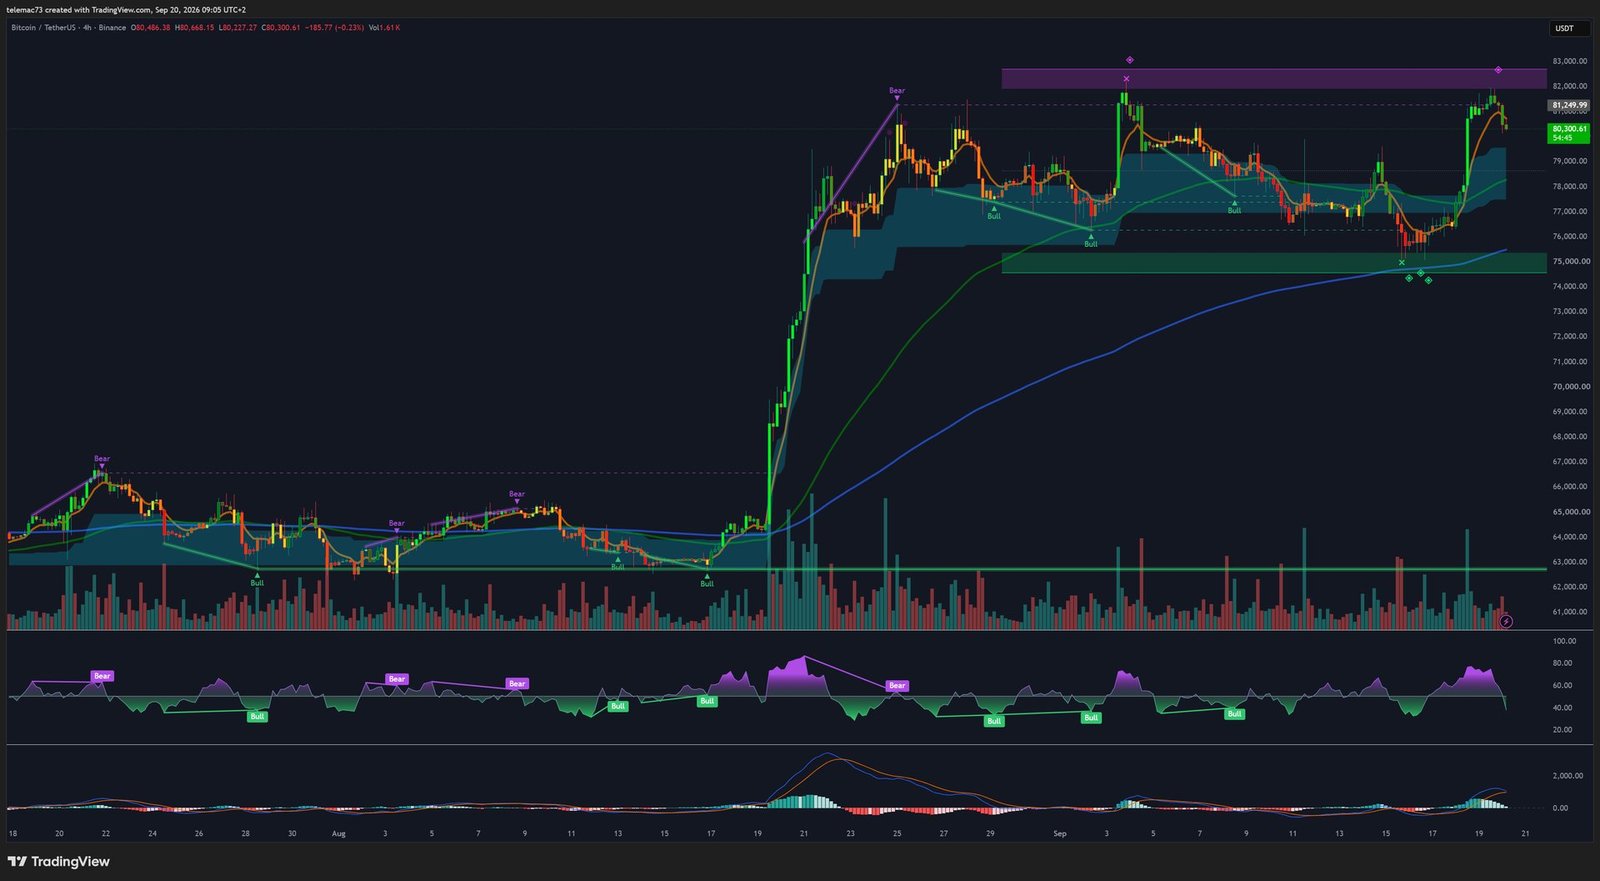
On the 4-hour timeframe, price action is organized within a regular ascending channel resembling a medium-term bull flag, extending the violent August impulse. Buyers have maintained continuous control, printing successive higher lows ($73,800, $75,000, then $75,800) against highs repeatedly testing the $82,000–$82,309 zone.
The mid-September pullback tested, with surgical precision, the 4-hour 200-period EMA (around $75,500), which coincided with the lower boundary of the channel and a green institutional buy zone. That vigorous rejection came alongside a hidden bullish divergence on the RSI, with price printing a higher low while the indicator approached its local oversold zone near 34. The 4H RSI now sits around 67, in contact with its overbought boundary, without developing bearish divergence on recent highs. The fast 20 EMA has clearly separated above the 50 EMA, and the MACD confirmed a clean Golden Cross upon reclaiming $77,500. The current $81,800–$82,309 level marks the third consecutive assault on this distribution ceiling — a repetition that is progressively exhausting passive sell-side liquidity.
Intraday Micro-Structure (15-Minute): Compression Before Resolution
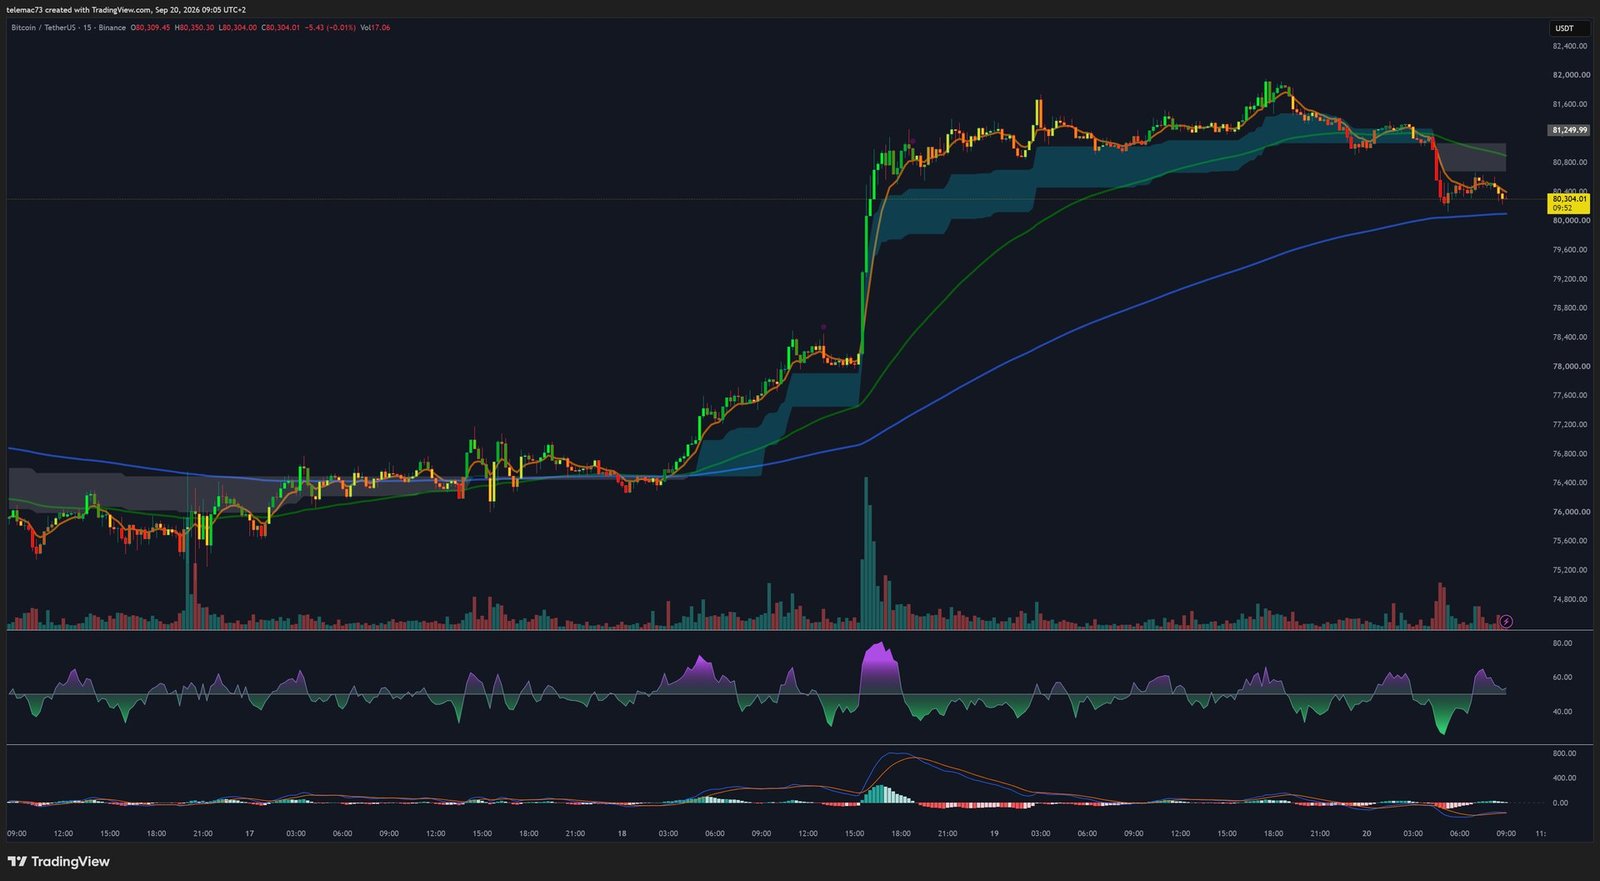
The 15-minute chart breaks down the anatomy of the recent impulse. The vertical leg that began on September 17 at $76,000 pushed price up to $81,800 on continuous volume flow, characteristic of a sweep of unabsorbed sell-side liquidity. Price action then entered a tight consolidation regime, shaping a descending pennant (a symmetrical compression triangle), with lower highs of decreasing amplitude ($81,800, $81,400, $80,800) sitting above a firm defensive shelf between $80,000 and $80,200.
| Intraday indicator (15m) | Observed reading | Technical diagnosis |
|---|---|---|
| RSI (14-period) | 48.0–51.5 (neutral zone) | Full absorption of extreme overbought (>84) without price collapse |
| MACD (12, 26, 9) | Lines at equilibrium | Volatility contraction, priming the next directional move |
| Intraday 50 EMA | $80,304 | Intraday auction equilibrium pivot |
| Upper compression boundary | $80,800–$81,200 | Must break to validate the next leg up |
| Lower compression boundary | $80,000–$80,150 | Floor to defend to avoid a rotation to $78,800 |
The 15-minute RSI trajectory is particularly instructive: the oscillator has unwound a very elevated overbought reading (84) back down toward the neutral 50 level, while price has given back only 1.8% from its local high. This time-based absorption without meaningful ground conceded points to the absence of aggressive sellers — traders appear to be holding open positions while awaiting a directional resolution through the upper boundary of the pattern.
Order Book Depth: Mapping the Liquidity
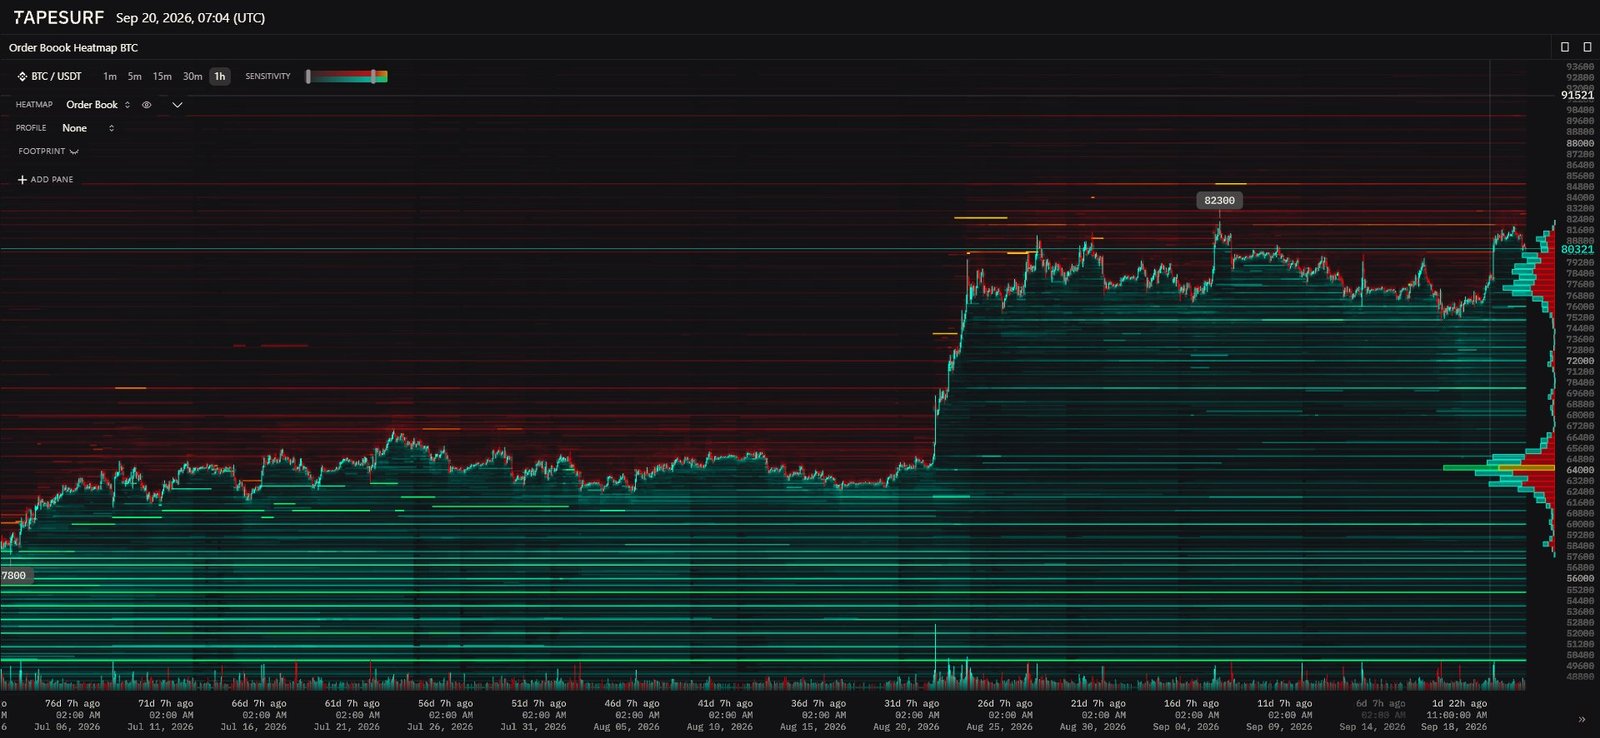
The BTC/USDT order book heatmap puts the chart patterns to the test against the physical reality of resting limit orders. Above the market, a dense band of sell-side limit liquidity runs uninterrupted between $82,000 and $83,500, with a marked density peak at $82,309 — the same distribution zone visible on the daily and 4H charts. Beyond this initial wall, a succession of dense horizontal lines extends up to $91,521, implying that a break above $82,500 will require sustained spot buying volume to clear this historical friction zone.
On the buy side, passive support structure is organized into three layers: a primary bid platform between $77,800 and $78,500; a secondary institutional wall between $75,000 and $76,000, where the September 16 wick precisely exhausted its downward pressure; and a major volume node at $64,800, the structural valuation base for the quarterly move. On derivatives, the September 18 squeeze swept away nearly all short stop orders between $76,000 and $81,500; the residual pool of short liquidations now sits above $82,400 and thickens toward $83,200 — mechanical fuel ready to accelerate a breakout should $82,300 give way.
Operational Matrix of Key Price Levels
| Timeframe | Primary support | Pivot level | Primary resistance | Dominant bias |
|---|---|---|---|---|
| Short term (15m) | $79,850–$80,000 | $80,304 | $80,800–$81,200 | Neutral-bullish (compression, neutral RSI) |
| Medium term (4H) | $76,000–$78,500 | $82,000 | $82,309 | Bullish (ascending flag, MACD Golden Cross) |
| Long term (1D) | $64,800–$75,000 | $82,500 | $84,000 | Transitional (accumulation, 200 EMA test) |
Two Possible Trajectories
Primary bullish scenario. An upside break of the 15-minute compression triangle, through $80,800, would push price toward a test of $82,000–$82,309. Triggering short liquidations above $82,400 could then absorb the order wall identified on the heatmap, validating a daily close above $82,300. Technical targets sit at $84,560 (filling the upper CME gap), then between $88,000 and $93,000 via impulsive wave extension. This scenario would be invalidated by a confirmed break of the intraday floor at $79,200.
Alternative bearish scenario. A repeated failure to absorb the supply resting between $82,000 and $82,300 would trigger a rejection in the form of a false bullish breakout, accompanied by a bearish divergence on the 4H RSI and a pullback below the local pivot at $79,500. Price would then begin a corrective rotation toward intermediate support at $77,800–$78,100, or even a retest of the institutional base between $75,800 and $76,200. This scenario would be invalidated by a clean hourly close above $82,500.
Bottom Line
Bitcoin’s positioning as of September 20, 2026 marks the completion of a post-macro-shock decompression cycle and the start of a structural resolution phase. The convergence between the 4-hour EMA 200 dynamic support, the intraday RSI’s normalization without a pullback, and the institutional liquidity cushion at $76,000 gives a marked probabilistic edge to continued buying flow. The $82,000–$82,300 zone remains the critical inflection threshold: its confirmed absorption would formalize the exit from the current range regime and unlock an expansion phase toward the untapped liquidity of the bull cycle.
Disclaimer: this article is provided for informational and educational purposes only. It does not constitute financial advice, an investment recommendation, or an inducement to buy or sell Bitcoin or any other digital asset. Cryptocurrency markets are highly volatile and carry a risk of capital loss. Always do your own research (DYOR) and consult a qualified financial advisor before making any investment decision.

