


The digital asset ecosystem is going through an unusual period of convergence in early September 2026. Bitcoin (BTC), consolidating between $77,000 and $81,000 after testing a local high of $81,280 in late August, sits at a crossroads. Understanding this phase requires cross-referencing three lenses: global macroeconomic forces and institutional liquidity flows, the thermodynamics of the mining industry, and market microstructure through the order book and multi-timeframe charts (daily, 4-hour, 15-minute).
This analysis offers an institutional-grade read of the market, weaving together international macro data, Switzerland’s regulatory and wealth-management framework — with a focus on the dynamism of the Lake Geneva region — and a detailed study of supports, resistances, pivots, and technical signals.
Macroeconomic Dynamics and Global Liquidity
The macroeconomic environment of autumn 2026 is defined by persistent tension between restrictive monetary policy and targeted interventions aimed at preserving liquidity in global bond markets. Bitcoin, a high-beta, liquidity-absorbing asset, reacts in a highly asymmetric way to these signals.
US Treasury Policy and the Impact on Yields
The most decisive fundamental catalyst remains the US Treasury’s decision to double the cap on its long-term bond buyback operations (10 to 30 years), raising it from $2 billion to at least $4 billion per session starting September 9, 2026. While not a direct quantitative easing move by the Federal Reserve, the measure represents a targeted liquidity injection designed to stabilize the bond market’s functioning.
This intervention carries real weight for risk assets. 10-year Treasury yields had recently brushed 4.80%, exerting severe downward pressure across markets. The announcement of the expanded buyback program triggered an immediate ~10 basis point relief in long-term yields and a corresponding weakening of the US dollar. Bitcoin mechanically absorbed this improvement in liquidity conditions, largely explaining its push above $70,000 in August. The 10-year real yield remains the most critical variable in this paradigm: as long as it stays below the 2.5% threshold, the macro backdrop stays broadly favorable for BTC.
Monetary Geopolitics and Legislative Debates
On the strict monetary policy front, uncertainty remains elevated: the probability of a Fed rate hike in September jumped to 60%, fueled by hawkish remarks from several officials, including Kevin Warsh, at the Jackson Hole symposium. Markets are continuously pricing the risk of prolonged tightening, which explains the sporadic bouts of volatility in the crypto market.
At the same time, a major legislative debate is stirring the US market around the establishment of a strategic Bitcoin reserve. Initiated by executive order, this reserve — valued at close to $20 billion, or roughly 328,372 BTC held by Washington — aims to leverage the asset’s mathematical scarcity to psychologically stabilize the dollar against inflationary pressure. The controversial inclusion of volatile altcoins such as XRP, however, is drawing strong pushback from Bitcoin purists who fear it dilutes the project’s credibility. Elsewhere, new regulations taking effect in Russia on September 1, 2026 open a regulated retail market, adding potential buy-side pressure to the global spot market, while geopolitical tensions in the Middle East continue to drive flows toward traditional and digital safe havens.
Institutional Flows and Spot ETF Asymmetry
Spot Bitcoin ETF flow data reveal an institutional architecture in the midst of transformation, one that increasingly drives price discovery. August 2026 was the best month of the year, with net inflows totaling $3.52 billion, alone erasing nearly 66% of the net outflows accumulated since January. Total assets under management (AUM) across these vehicles jumped 31%, approaching the symbolic $100 billion mark and propelling Bitcoin into a 25% monthly rally.
The microstructure of these flows, however, reveals a fragility inherent to derivatives-driven momentum strategies. On September 1, a sharp reversal triggered $236.46 million in net outflows in a single session — the largest daily bleed since late July — coinciding with BTC’s pullback below $77,000, with BlackRock’s IBIT accounting for the bulk of the outflows. This volatility suggests that the current marginal institutional capital is largely dominated by leveraged macro funds and reactive CTAs rather than steadfast long-term strategic allocators. Resilience reappeared quickly, however, on September 2 and 3, with net inflows returning to $101.15 million, of which $115.45 million was captured by BlackRock, offsetting continued outflows from Grayscale’s GBTC — a sign that underlying demand remains active.
| Spot Bitcoin ETF Metric (US) | Data (Aug – Early Sept 2026) | Strategic Implication |
|---|---|---|
| Net inflows (Aug 2026) | +$3.52B | Recovers 66% of the year’s flow deficit; validates institutional demand. |
| Assets under management (AUM) | $99.61B | Approaching the symbolic $100B mark, reinforcing the asset’s legitimacy. |
| Trading volume (Aug) | $58.63B | +49% vs. July: active market participation. |
| Net outflows (Sept 1) | -$236.46M | Aggressive profit-taking amid macro concerns (Fed, US-Iran tensions). |
| Net inflows (Sept 2–3) | +$101.15M | Fast return of institutional buy-the-dip demand at the $77,000 support. |
The Swiss Ecosystem: FINMA Regulation and Wealth Management
Switzerland retains its dominant global position in digital asset management, often nicknamed « Crypto Valley. » This appeal rests on a legal and monetary framework of rare clarity, drawing in institutional capital fleeing US regulatory uncertainty. The Lake Geneva region, from Geneva to Montreux, plays an increasingly prominent role in integrating Bitcoin into the portfolios of ultra-high-net-worth individuals (UHNWIs) and family offices.
FINMA Guidance 01/2026 and Asset Segregation
Trust in the Swiss framework was significantly reinforced by the publication, on January 12, 2026, of Guidance 01/2026 by FINMA, the Swiss Financial Market Supervisory Authority. This foundational text redefines prudential expectations around the custody of crypto-assets, placing investor protection at the center of the framework. The major regulatory innovation lies in the strict requirement for individual asset segregation: Swiss banks and virtual asset service providers (VASPs) must ensure that crypto-assets, particularly within individual management mandates, are held separately for each client — making these digital assets bankruptcy-remote from the custodian institution. FINMA also requires that any delegation of custody to foreign third parties be permitted only if the delegate is subject to equivalent prudential supervision, effectively barring the use of opaque offshore platforms for Swiss capital.
For wealth managers operating out of Montreux, this regulatory clarity is a formidable commercial tool: it allows them to structure discretionary management mandates including Bitcoin, offering international clients a level of institutional security comparable to traditional private banking.
SNB Monetary Policy and Yield Arbitrage
Switzerland’s monetary backdrop mechanically boosts the appeal of digital assets. The Swiss National Bank (SNB) has held its policy rate at 0% throughout 2026, a stance expected to persist through 2027 per banking consensus. In this persistent zero-interest-rate regime, the opportunity cost of holding non-yielding assets — such as Bitcoin or gold — is structurally much lower in Switzerland than in jurisdictions where risk-free rates remain elevated. Family offices along the Vaud Riviera and in Geneva are increasingly incorporating Bitcoin, both as an asymmetric hedge against global currency debasement and as a growth driver for portfolios weighed down by the absence of domestic bond yield.
Network Thermodynamics and Mining Economics
Mining industry analysis offers key insight into the systemic selling pressure inherent to the market. Miners, near-obligatory sellers covering their energy and hardware operating costs, define the macroeconomic price floors.
Difficulty Adjustment and Hashrate
The Bitcoin network recently went through a period of extreme turbulence marked by sharp mining difficulty swings. After intense margin pressure following the halving, difficulty dropped by more than 10% mid-year, settling in early September 2026 around 125.81 trillion — barely 0.7% above its yearly low. Total network hashrate, while showing remarkable long-term resilience, currently ranges between 738 and 886 exahashes per second (EH/s), affected by voluntary curtailment tied to energy prices and the retirement of older-generation machines.
| Mining Indicator | Value (Sept 2026) | Impact on Selling Pressure |
|---|---|---|
| Network difficulty | 125.81 T | Significant drop, near the yearly low; eases profitability for existing operators. |
| Total hashrate | 738 – 886 EH/s | Contraction from curtailment and the capitulation of inefficient ASICs. |
| Hashprice | ~$33 – $40 / PH/s/day | Up 20% from lows; efficient fleets are reaching breakeven. |
| Circulating supply | ~19.86M BTC | Growing scarcity: fewer than 1.14 million BTC left to mine by 2140. |
Hashprice and the Capitulation That Wasn’t
The direct consequence of the difficulty decline is an immediate improvement in profitability for surviving miners. Hashprice, which measures expected revenue per unit of computing power, rebounded nearly 20% by late summer, moving from critical levels to a range of $33 to $40 per PH/s/day. This return to the « breakeven zone » sharply reduces the need for large mining farms to immediately liquidate their BTC treasury reserves to cover electricity bills. The easing of this inelastic selling pressure creates a cushion that actively protects support zones around $76,000, with the difficulty decline acting as an automatic thermostat that rebalances the network’s economy.
Quantitative Order Book Analysis (Heatmap)
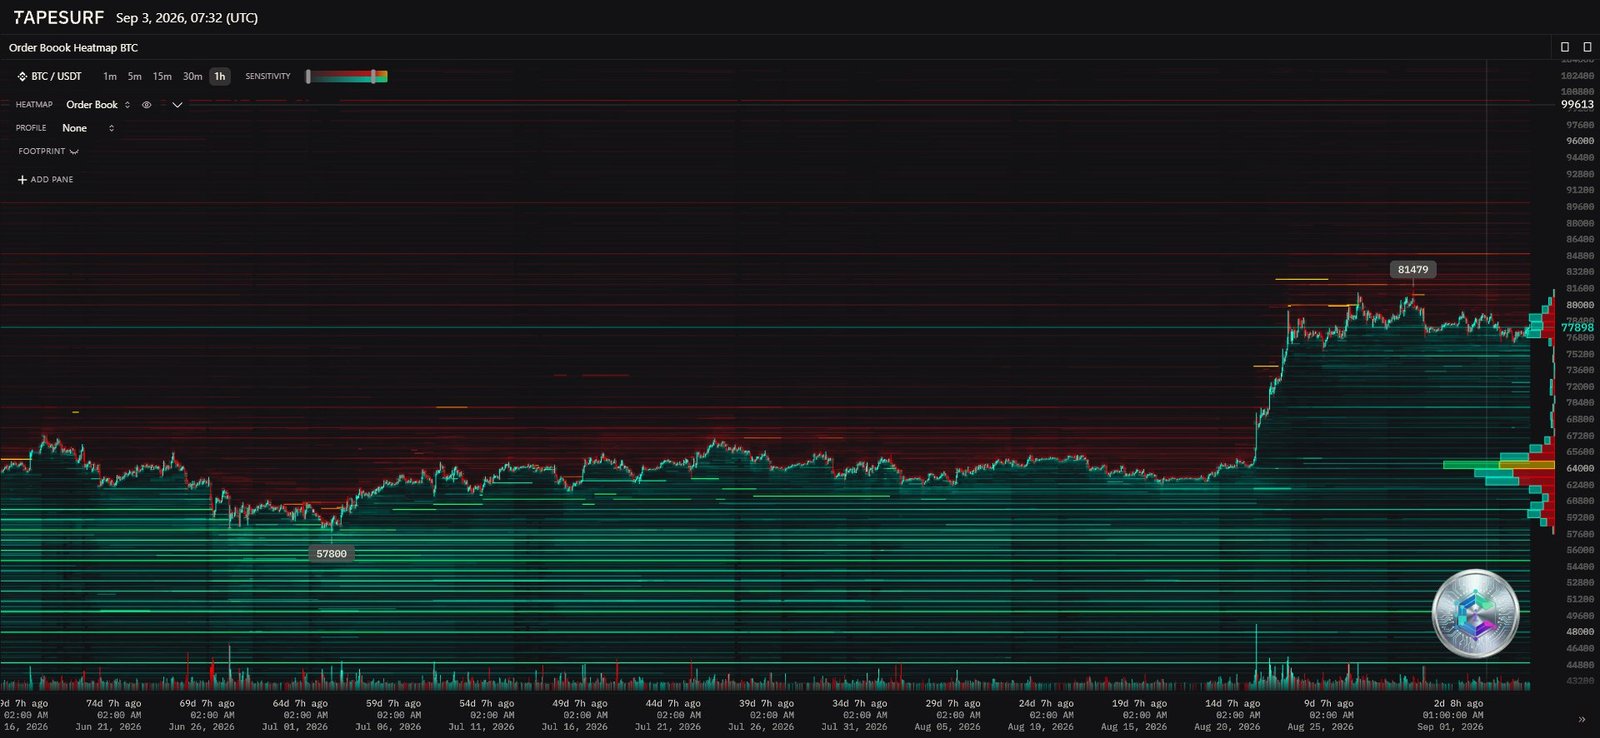
The order book heatmap provides a real-time map of passive liquidity and market makers’ intentions, revealing the depth of bid and ask limits — invaluable for anticipating directional friction, where candlestick charts only tell the story after the fact.
The current price, hovering around $77,898, sits within a tightly structured liquidity corridor. Above price, the heatmap shows very dense bands positioned with surgical precision at $81,479 and just below the $80,000 psychological threshold: massive sell walls. On-chain data suggests roughly 8% of total BTC supply was historically acquired within the $80,000–$82,000 zone, mechanically triggering break-even selling from investors trapped in previous cycles. This liquidity acts as a short-term magnet for market makers seeking counterparties but requires exceptional buying pressure to be fully absorbed.
Below current price, the structure is symptomatic of institutional accumulation: a dense intermediate support zone appears between $76,000 and $77,000, with buy-side lines that don’t withdraw during dips — a sign of genuine accumulation rather than spoofing. The market is currently functioning through absorption: every attempted break below $77,000 runs into this wall of passive orders. The true structural floor, however, sits much lower, with an extreme liquidity concentration at $57,900 — the ultimate safety net in the event of a black-swan shock.
Multi-Timeframe Chart Analysis
Cross-referencing price action and oscillators across different timeframes helps extract the directional signal from daily noise.
The Underlying Structure: The Daily Chart
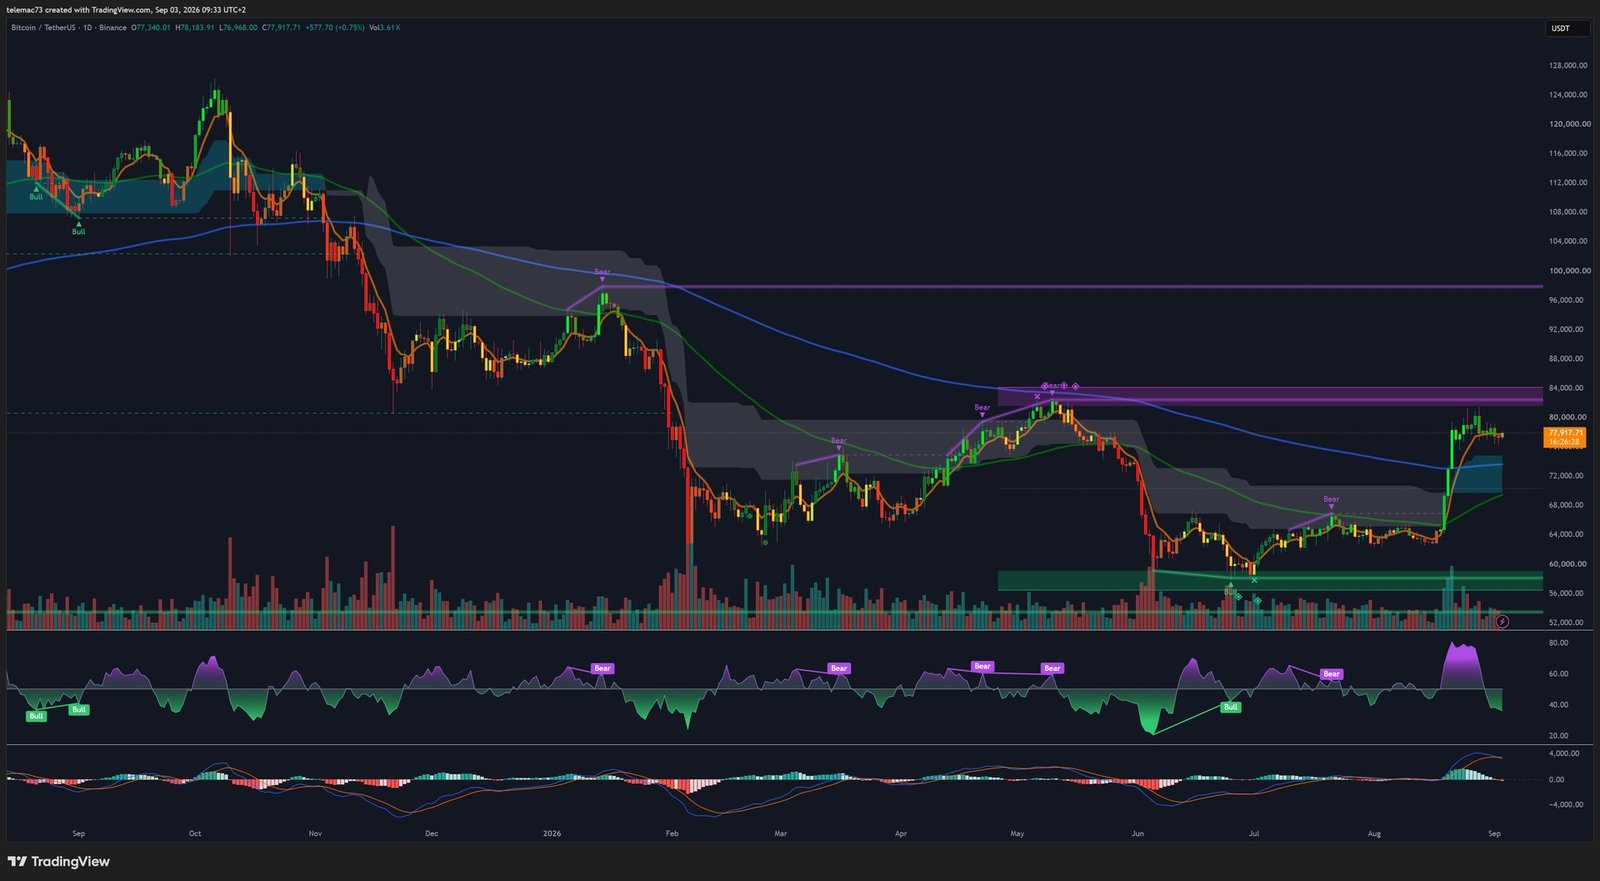
The daily chart lays out the long-term structural paradigm: Bitcoin traded within a broad consolidation channel (Wyckoff-style accumulation) for several months before initiating an aggressive breakout that propelled price above $81,000. Current price action indicates Bitcoin is retesting the upper boundary of this former consolidation zone — validating the polarity principle, whereby a former major resistance becomes a new support. Exponential moving averages remain perfectly aligned to the upside, confirming that the underlying trend remains unquestionably bullish.
The daily RSI is not in extreme overbought territory: it hovers around 71 following recent moves, maintaining a positive bias while retaining room to run. The MACD confirmed a massive Golden Cross during August’s impulse; the histogram currently shows mild signs of contraction, indicating the market is orderly digesting the 25% rally. This sideways action is fundamentally healthy — an uninterrupted parabolic rise would instead have precipitated a violent leverage-liquidation correction.
The Intermediate Dynamic: The 4-Hour Chart
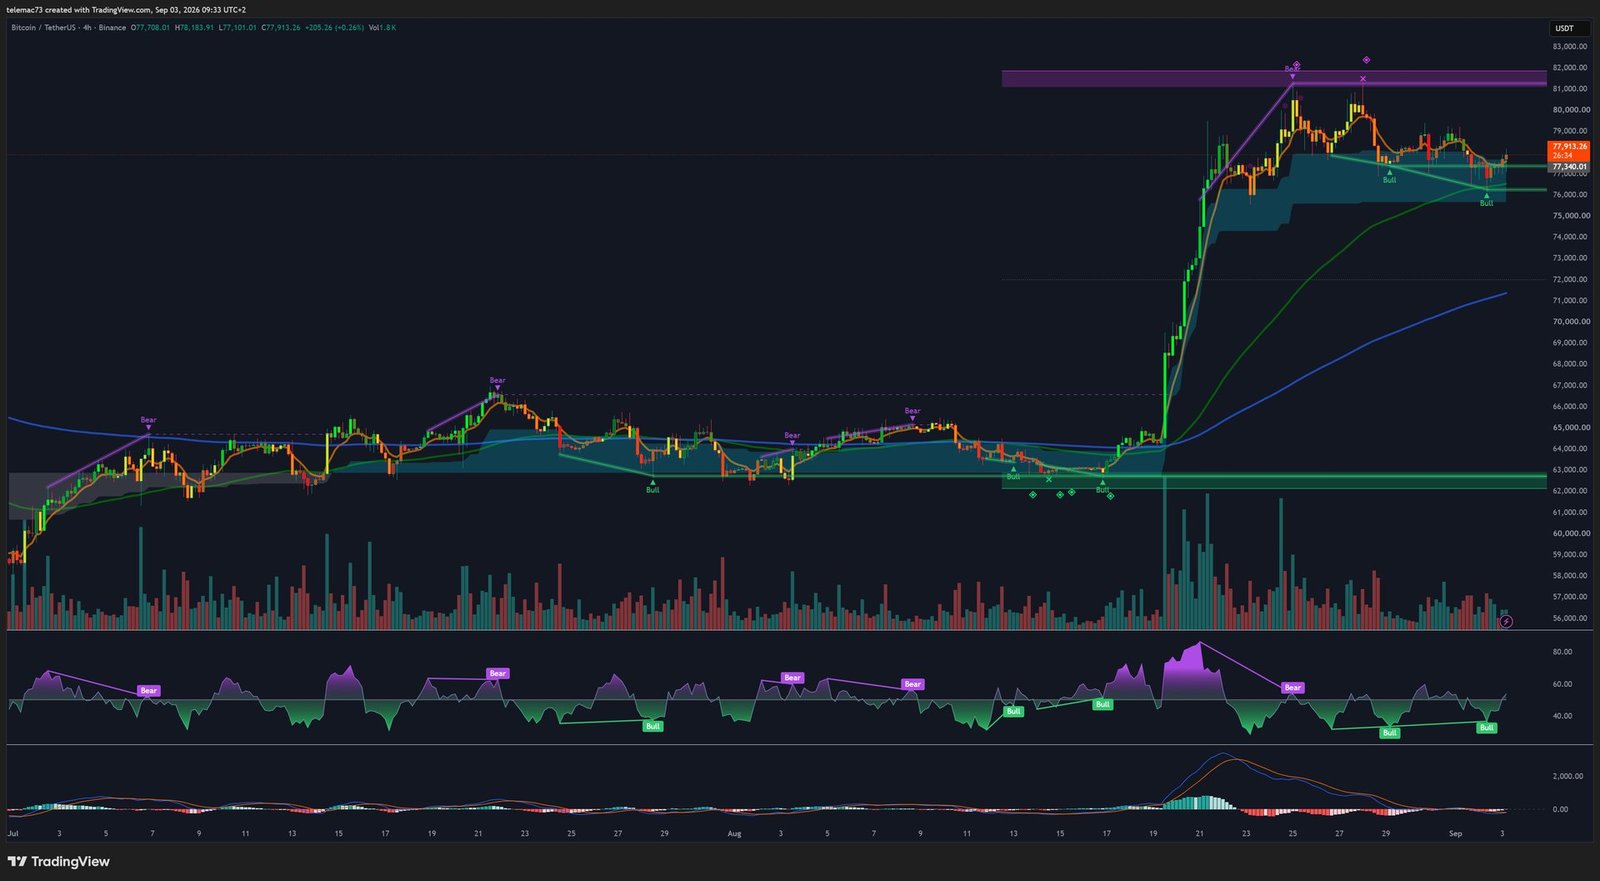
On the 4-hour timeframe, the granularity of the impulse becomes clearer, revealing a specific fractal geometry. The chart shows an extremely powerful vertical pole corresponding to August’s rally, followed by a sideways, slightly bearish drift forming a classic Bull Flag continuation pattern. Just before the vertical impulse, a clean Golden Cross confirms, in hindsight, the explosion in directional volatility. Price is currently oscillating near its short-term dynamic moving average, which acts as a pivot point.
The H4 RSI has cooled considerably after touching its extreme overbought boundary, purging speculative pressure and leaving room for a fresh leg higher. The MACD formed a Death Cross at the top of the impulse, mathematically explaining the ongoing correction within the flag; the histogram remains negative, reflecting medium-term bearish momentum. The key thing to watch is the convergence of the MACD lines toward the zero line: a bounce or a fresh Golden Cross at that level would technically validate the end of the consolidation and the Bull Flag’s bullish breakout. The overall structure stays constructive as long as the flag’s base and the liquidity zone around $76,000 continue to be defended by incoming flows.
Short-Term Price Action: The 15-Minute Chart
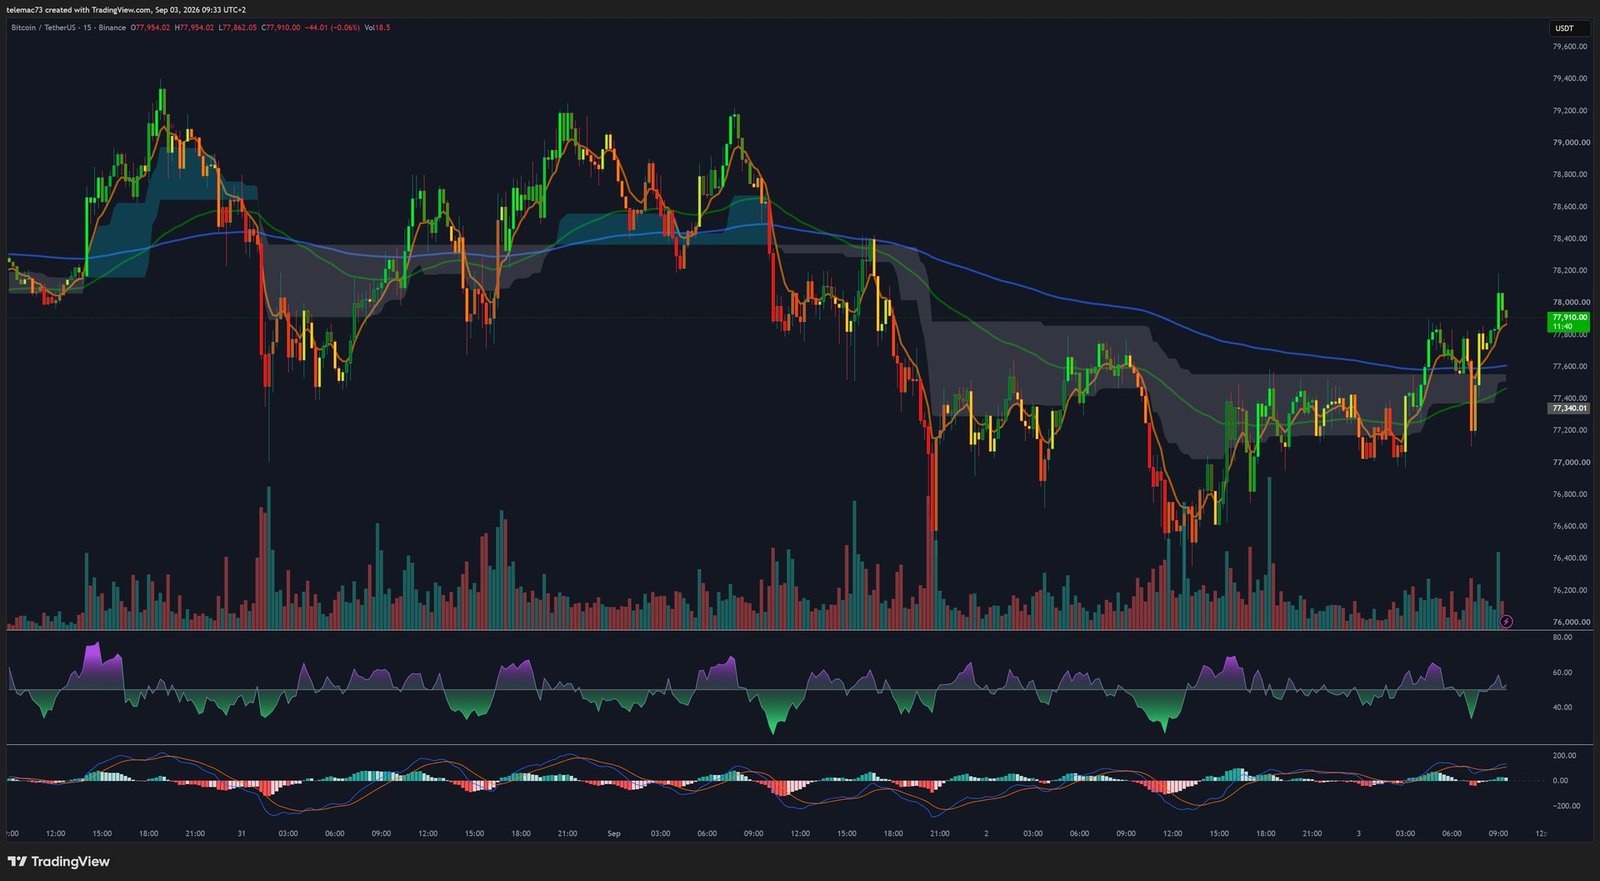
The 15-minute timeframe offers an X-ray of the market’s microstructure, dominated by intraday algorithmic behavior and liquidity hunts — a choppy, volatile environment highly reactive to short-term macro headlines. A violent breakdown, marked by large red candles, points to a chain of forced liquidations in derivatives markets following the rejection at $81,000. Price methodically swept stop-losses below local lows before forming an aggressive « V »-shaped reversal resembling a micro double bottom.
On this timeframe, the RSI plunged into extreme oversold territory during the drop, triggering a hidden bullish divergence and sparking a mechanical bounce driven by mean-reversion algorithms. The M15 MACD has just completed a bullish crossover below the zero line, confirming a resumption of short-term buying momentum. Price is currently wrestling with its declining moving average, acting as immediate dynamic resistance; candle clustering shows the formation of a symmetrical compression triangle. A close above this moving average would likely propel the asset toward the top of its consolidation range, between $79,000 and $80,000.
Support, Resistance, and Pivot Matrix
Combining macroeconomic data, mining thermodynamics, and multi-scale chart analysis produces a map of key strategic thresholds:
| Level (USD) | Classification | Rationale |
|---|---|---|
| $81,479 | Major macro resistance | Massive order wall (heatmap); recent all-time high; profit-taking zone for trapped investors. |
| $80,000 | Intermediate resistance | Psychological barrier requiring sustained ETF inflows to break. |
| $79,000 | Central pivot | Current equilibrium zone; dividing line between consolidation and bullish continuation. |
| $77,000 | Intermediate support | Liquidity zone visible on the heatmap; floor of the H4 bull flag; ETF buy-the-dip point. |
| $76,000 | Key structural support | Absolute limit for the Bull Flag’s validity; a daily close below would trigger heavy selling. |
| $57,900 | Ultimate macro support | Extreme liquidity floor; corresponds to the network’s average production cost and yearly low. |
Strategic Modeling and Probabilistic Outlook
Current data points to a healthy consolidation phase, digesting the excesses of August’s rally. The risk-reward asymmetry still favors buyers, provided the US macro framework avoids an unexpected inflation shock.
Bullish continuation scenario — the base case given the current alignment of indicators: the market absorbs the transitory selling pressure, ETF-driven defense of the $76,000 zone allows the H4 bull flag to mature, and easing bond yields, supported by US Treasury buybacks, supply the momentum needed to attack the $80,000 resistance. A clean, high-volume break above $81,479 would invalidate the heatmap’s sell walls and open the way toward $84,000–$86,000. Renewed miner profitability further guarantees the absence of unexpected supply shocks.
Bearish invalidation scenario — tied to a macro reversal: should inflation or employment data force the Fed to harden its rhetoric, pushing the 10-year yield above 4.85% or the real yield durably above 2.5%, the appeal of non-yielding assets would collapse. A daily close below $76,000 would invalidate the bull flag, trigger a cascade of algorithmic stop-losses, and drive a broad rotation into cash, pushing price toward $72,000 — or even $69,500 in the event of institutional panic.
In conclusion, the convergence of global macroeconomic dynamics, Switzerland’s regulatory excellence in attracting private capital, network thermodynamic indicators, and the price architecture all point to an asset that has reached institutional maturity. Professional market participants should avoid chasing immediate resistance breaks, favoring instead disciplined accumulation strategies near major support levels.
⚠️ Disclaimer: This article is provided for informational and educational purposes only. It does not constitute investment advice, a recommendation to buy or sell, nor a solicitation to trade digital assets. Cryptocurrency markets are highly volatile and carry a risk of capital loss. Always do your own research (DYOR) and consult a licensed financial advisor before making any investment decision.

