


As July 2026 draws to a close, Bitcoin (BTC) sits at a genuine inflection point. After capitulating to a 21-month low of $58,188 in late June, the asset has reclaimed the psychological $65,000 threshold and now trades around $65,770. Caught between macroeconomic indecision and technical signs of re-accumulation, this analysis offers a three-dimensional read on the market: the macro backdrop, multi-timeframe technical structure, and liquidity mapping.
The macro backdrop: everything hinges on the Fed
The dominant catalyst this month is the FOMC meeting scheduled for July 28-29, with a statement expected from Fed Chair Kevin Warsh. The benchmark rate remains locked in a restrictive 3.5%-3.75% range. Derivatives markets (CME FedWatch, Polymarket, Kalshi) price in an 82%-93% probability of a monetary status quo, a view reinforced by June’s CPI print of 3.5% year-over-year, below consensus expectations.
This backdrop feeds a major structural debate between two schools of thought. The first, grounded in the four-year Halving cycle theory, suggests the market has not yet purged all of its speculative excess, with potential lower lows expected between September and October. The second, increasingly backed by empirical data, frames Bitcoin as a genuine macro asset whose trajectory now depends on the global credit cycle rather than its internal schedule. Under this lens, the market bottom may already have been set during the capitulation to $58,188.
Mining economics: selling pressure running out of steam
Stress across the mining industry has reached multi-year critical levels. Hash Price has compressed to roughly $30.6/PH/s/day, cutting the network’s aggregate daily revenue to just $28.5 million. Undercapitalized miners, forced to sell reserves to cover operating costs, continue to feed supply onto exchange order books. Historically, these industrial capitulation phases flush out the least efficient players; once that liquidation is complete, inelastic selling pressure evaporates, paving the way for explosive upside moves if institutional demand reawakens.
Multi-timeframe technical analysis
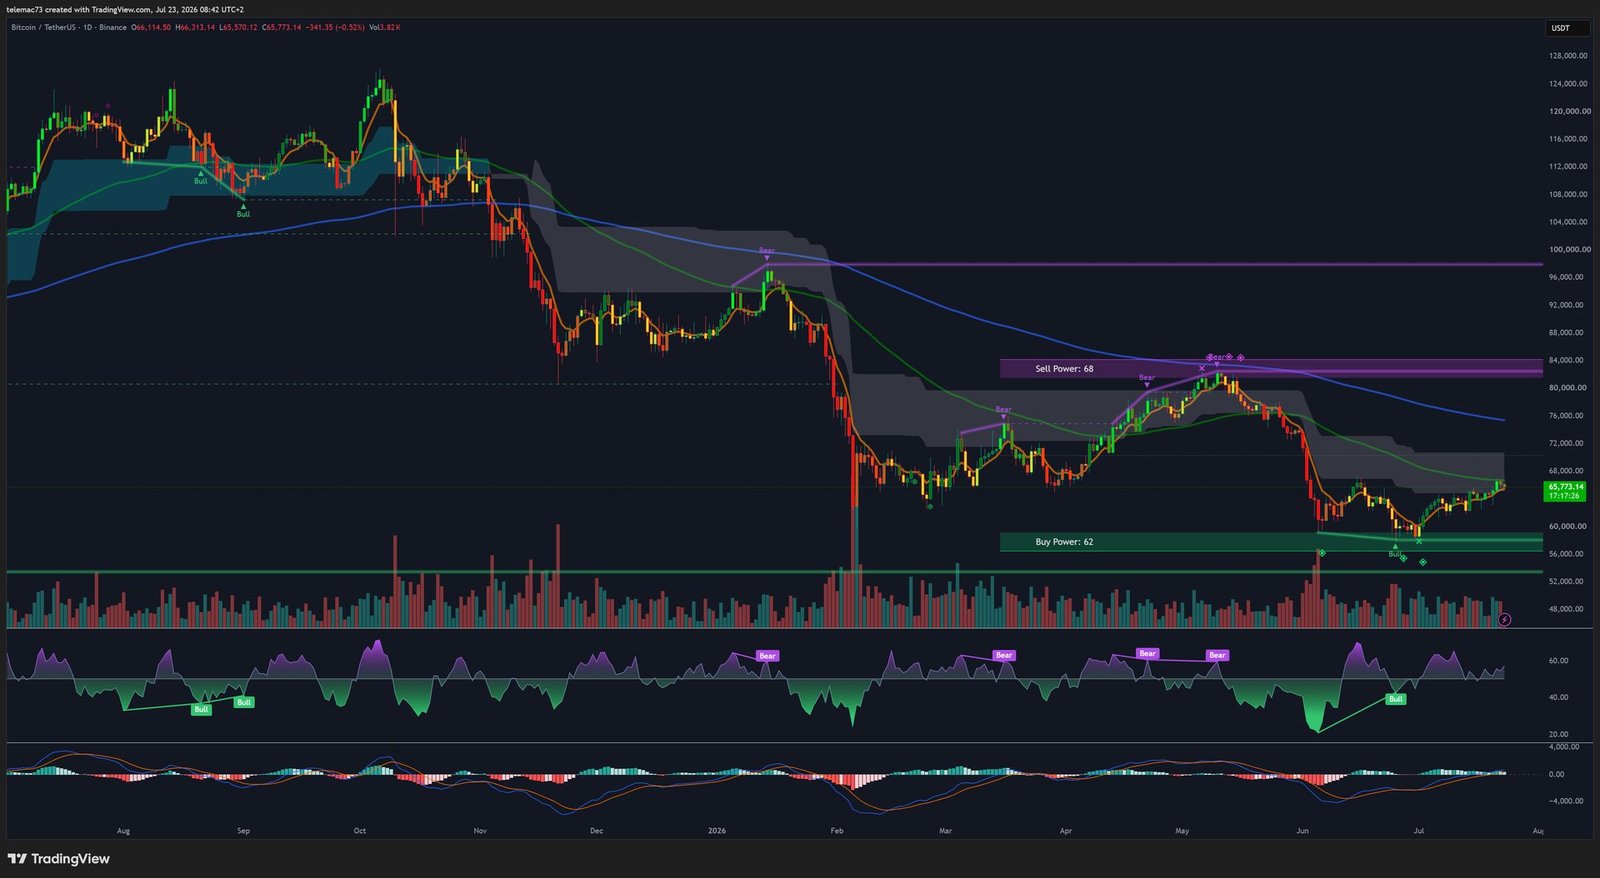
Daily chart: a historic consolidation
30-day realized volatility has fallen to 30.4% annualized, well below the 81% long-term historical average. This extreme compression is carving out a large triangle, comparable to a long-term bull flag. Price remains, however, below the 200-day Simple Moving Average, currently around $74,000, confirming the underlying trend is technically paused. The daily RSI, after plunging below 30 during the May-June correction, is recovering toward the neutral 50 zone, while the MACD histogram shows fading bearish momentum, hinting at a possible Golden Cross forming below the zero line.
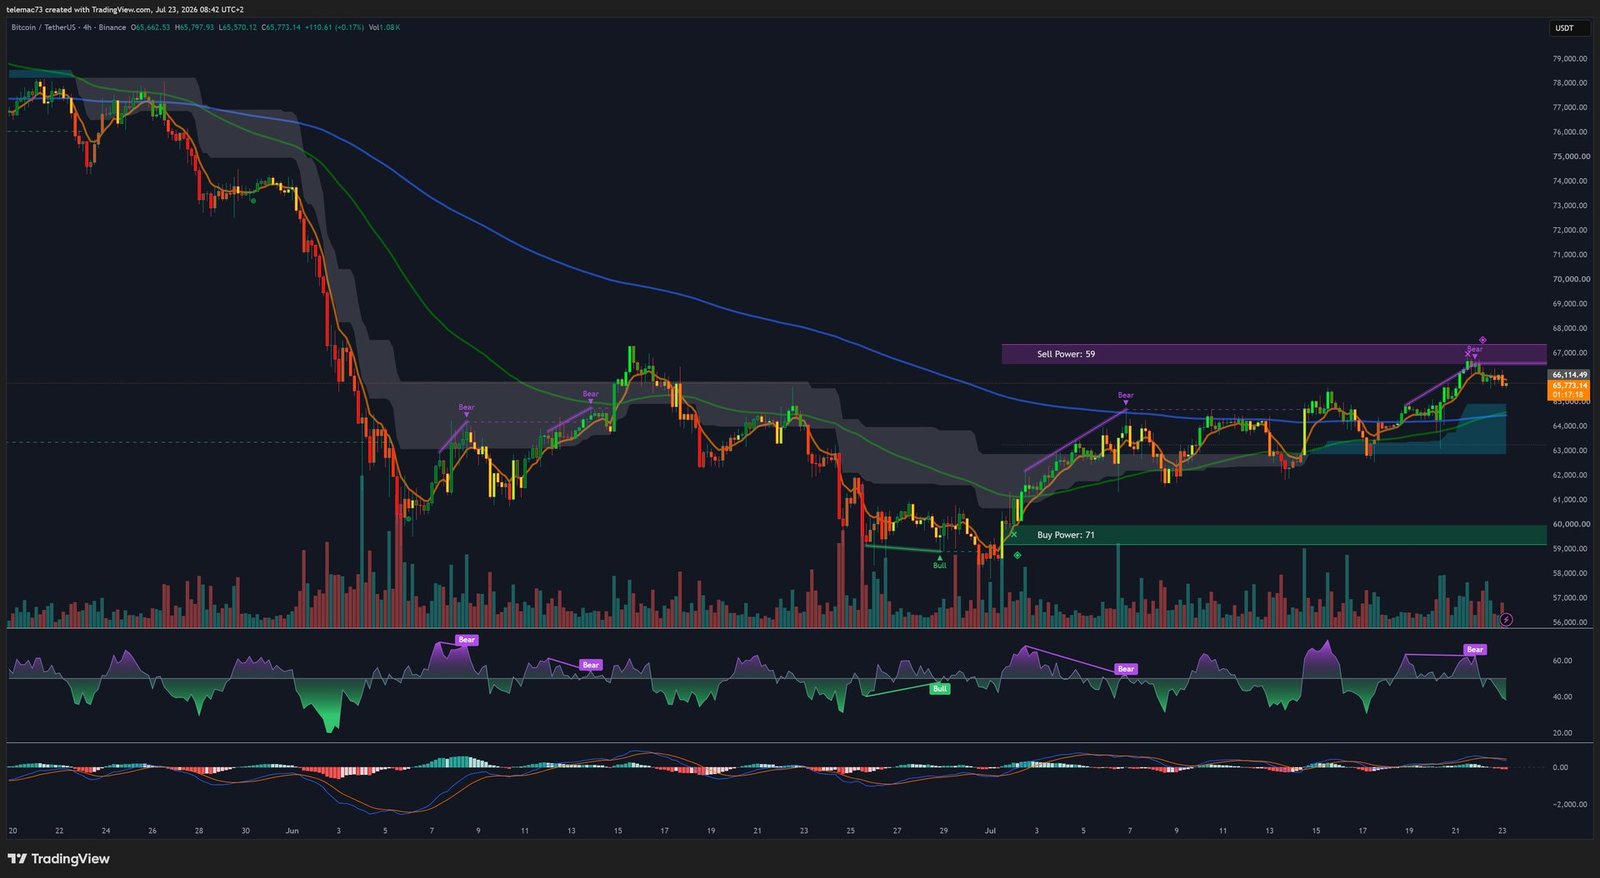
4-hour chart: demand goes on the offensive
On the intermediate timeframe, the recovery from $58,188 has built through a series of higher lows and higher highs, tracing a clear micro uptrend. Price is currently consolidating below a ceiling near $67,000, forming a textbook Bull Flag. A Golden Cross has already formed between the exponential moving averages — a signal frequently used by trend-following algorithms to allocate capital — which explains the resilience of support around $64,500. The H4 MACD sits in positive territory and the RSI trades in a high but non-extreme zone (60-65).
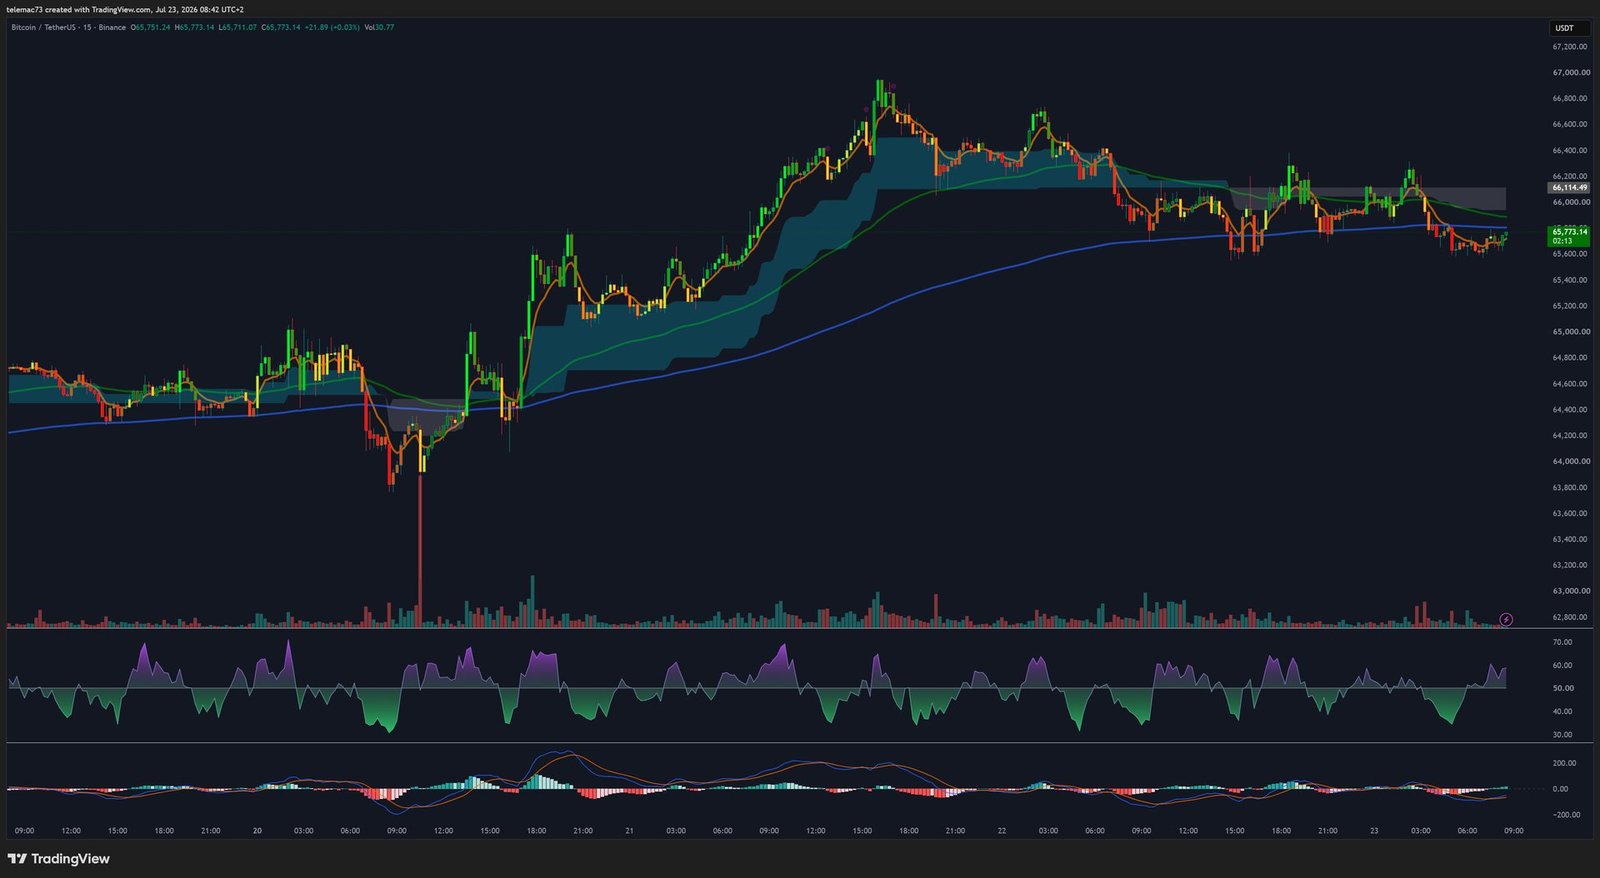
15-minute chart: high-frequency noise
On this timeframe, the market looks extremely choppy, dominated by statistical arbitrage and market-making algorithms exploiting the absence of macro directionality. Short-term breakouts frequently resolve into whipsaws. For active traders, this chart favors mean-reversion strategies — fading extensions toward $66,300 and buying dips toward $64,100 — over breakout trading.
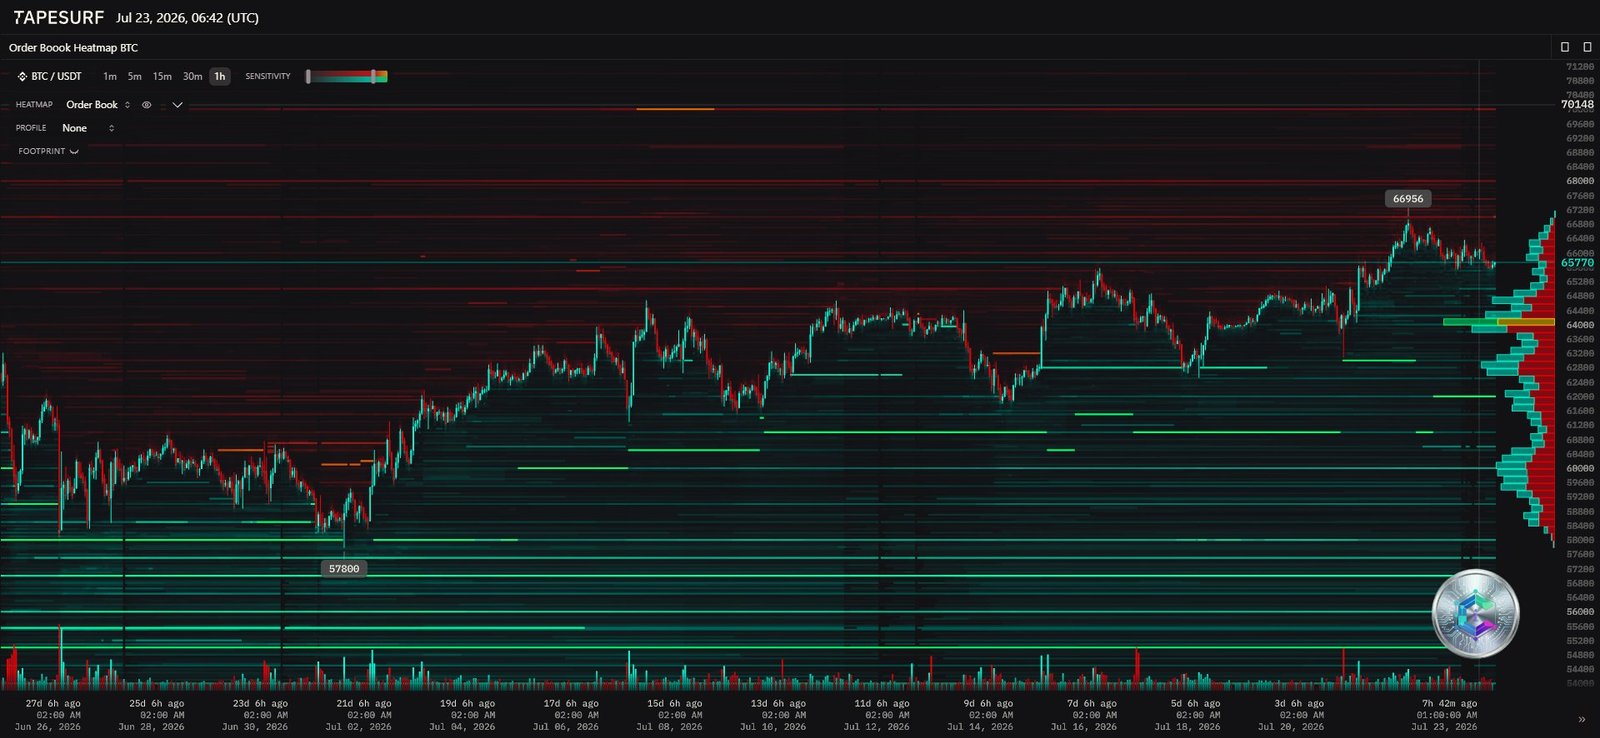
Liquidity mapping: what the heatmap reveals
Chart-based analysis alone is two-dimensional. Order book mapping adds the crucial third dimension. The heatmap shows a massive sell wall between $65,770 and $67,000, with a local high of $66,955 — any rally will need to absorb this selling liquidity to advance. Conversely, a solid bid floor sits below $64,000, with a colossal buy wall at $57,890, almost perfectly aligned with the recent macro low of $58,188. Prediction markets like Polymarket concentrate the bulk of speculative attention around the $67,500 level, a genuine psychological tipping point.
On the institutional flow side, US spot ETFs recorded five consecutive days of net inflows totaling over $600 million, a direct antidote to miner selling pressure. The derivatives market, however, remains cautious: the implied volatility skew favors downside protection by 11.4 points, a sign institutions are hedging against a potential macro shock.
Altcoins and Bitcoin dominance
BTC dominance stands at 56.8%, reflecting pronounced risk aversion within the crypto universe. Ethereum is stuck around $1,933 despite the anticipated “Glamsterdam” hard fork slated for the second half of the year. Solana illustrates the severity of the post-speculative cleanup, with fees down 50% since January and TVL down 56% from its August 2025 peak. On the regulatory front, uncertainty around the GENIUS Act and the CLARITY Act continues to weigh on stablecoin and XRP prospects, reinforcing the flight of capital toward Bitcoin’s proven liquidity.
Three scenarios for the FOMC verdict
- Status quo (base case, 82-93% probability): Bitcoin fails to break the $67,000 sell wall and drifts sideways toward the $64,500 pivot, or even $61,000 amid summer fatigue.
- Dovish surprise: a signal of autumn rate cuts would trigger aggressive buying, breaking the $67,000 resistance and opening the path to $67,500 and then $74,000 (200-day SMA).
- Hawkish surprise: a liquidity shock would break the $64,000 support, reviving crash-thesis fears toward $61,000, with a risk of extension down to the $57,890 buy wall, or even $53,000 in an extreme stress scenario.
Conclusion
Bitcoin’s resilience since testing $58,188, combined with fading bearish momentum and a Golden Cross forming on the intermediate timeframe, paints the picture of a market being methodically accumulated by institutional players. But this technical structure remains subordinate to the Fed’s macro verdict: the historic contraction in volatility reflects capital awaiting an external directive rather than a dormant market. The prudent strategy is to wait for the FOMC catalyst to materialize before taking directional positions, while watching absorption of the $67,000 sell wall as the key confirmation signal.
Disclaimer: This article is provided for educational and informational purposes only. It does not constitute investment advice or a recommendation to buy or sell any asset. Cryptocurrency markets are highly volatile; always do your own research (DYOR) and consult a financial advisor before making any investment decision.

