


Bitcoin (BTC) is going through an unusually intense bullish volatility phase, breaking above the symbolic $80,000 threshold to test the critical $81,000 zone. This move cannot be explained by chart reading alone: it is part of a deep reshuffling of global capital flows, driven by central bank policy, shifting sovereign bond yields, and an unprecedented liquidation event in the derivatives market.
During the last week of August 2026, Bitcoin posted its strongest weekly gain (+23%) since the November 2024 US presidential election, approaching its best monthly performance since 2017. This surge stands out for an unusual convergence of factors: an emergency technical intervention by the US Treasury, a short squeeze of unprecedented violence, and the resurgence of the currency-debasement narrative against a backdrop of US sovereign debt nearing $40 trillion.
The analysis below offers a cross-reading of price action across multiple timeframes (daily, 4-hour, 15-minute), order-book depth via the liquidity heatmap, and the macroeconomic environment that fueled this move.
The macro trigger: sovereign debt and the “debasement trade”
The initial catalyst for this bullish explosion did not come from the crypto sphere, but from the sovereign debt market. With US national debt nearing $40 trillion, annualized interest expense has reached around $1.4 trillion over the past twelve months — nearly triple its 2020 level.
Facing this fiscal pressure, the US Treasury Department doubled the size of its long-term debt buyback operations, from $2 billion to at least $4 billion per operation, targeting 10-, 20-, and 30-year notes. The goal was to curb rising long-term yields. The announcement had an immediate effect: the 30-year Treasury yield, which had been hovering dangerously around 5.34% (a peak unseen since 2007), pulled back toward 5.2%. The move spread to Japanese, European, and US sovereign bonds simultaneously.
When bond yields fall, the opportunity cost of holding non-yielding assets — gold, silver, Bitcoin — mechanically drops, making them more attractive to capital seeking to preserve value. This dynamic revived what institutional strategists call the debasement trade: a flight from cash and sovereign debt toward assets with mathematically proven scarcity. By injecting liquidity to control rates, the government implicitly accepts a weaker dollar, positioning Bitcoin as a hedge against the erosion of US fiscal credibility.
Bitcoin’s most violent short squeeze on record
Macro lit the fuse; the structure of the derivatives market supplied the explosive fuel. Bitcoin’s climb past $80,000 was massively amplified by the largest single-day short-liquidation event ever recorded: in 24 hours, more than $1.1 billion in BTC short positions were wiped out, pushing total crypto market liquidations to nearly $1.92 billion.
The mechanism is brutally asymmetric: the market was heavily positioned short ahead of the rally. When price began an unexpected rise, highly leveraged short sellers were forced to buy back the asset at any price to avoid liquidation, pushing the price even higher in a domino effect. On-chain data suggests this initial move resembled a low-volume liquidity trap, driven mainly by short covering rather than genuine spot demand.
A rally built solely on liquidations is structurally fragile and prone to a sharp reversal once excess leverage is purged. For the $80,000 level to hold, spot demand must take over — and recent on-chain data sends robust confirmation signals:
| Capital Flow Indicator | Recorded Volume | Interpretation |
|---|---|---|
| Whale accumulation (60 days) | ~43,000 BTC | Quiet buying into the dip, showing long-term conviction despite persistent bearish sentiment. |
| Accumulation value (2 months) | ~$2.64B | Major fundamental support, continuous dip-buying strategy. |
| US spot ETF inflows (2 days) | ~$486M | Traditional finance quickly capturing the bullish trend. |
| US spot ETF inflows (August 2026) | ~$1.47B | Sustained appetite for regulated Bitcoin exposure vehicles. |
This rotation from purely speculative capital to institutional conviction capital suggests the break above $80,000 now rests on firmer ground. Still, non-ETF spot trading volume recently hit historically low levels, reminiscent of 2019’s activity troughs — a lingering fragility in overall liquidity.
Monetary policy, DXY, and market psychology
Bitcoin has definitively shed its status as a decorrelated niche asset to become a high-beta instrument, hyper-reactive to liquidity injections and central bank signals. In January 2026, the Fed held its policy rate in a range of 3.5%–3.75%. At this “risk-free” yield level, institutional investors can secure reliable returns via US Treasuries without the extreme volatility of crypto assets — an opportunity cost that acts as a gravitational force draining liquidity from digital asset exchanges.
The dollar’s trajectory (DXY) remains equally decisive: a historically strong inverse correlation links it to Bitcoin’s price. A hawkish Fed stance strengthens the dollar, making Bitcoin more expensive for international investors and weighing on valuations.
Analysis of Bitcoin’s behavior around 2025 FOMC meetings reveals a recurring psychological pattern: rate-decision probabilities, heavily priced in via the CME FedWatch tool, often turn the announcement itself into a contrarian catalyst.
| 2025 FOMC Meeting | Decision | BTC Performance (48h) |
|---|---|---|
| January | Hold | -27% |
| March | Hold | -14% |
| May | -0.25% Cut | +15% |
| June | Hold | -8% |
| July | Hold | -6% |
| September | -0.25% Cut | -7% |
| October | -0.25% Cut | -29% |
| December | -0.25% Cut | -9% |
Across eight meetings, Bitcoin posted a positive performance only once — a clear illustration of the “sell the news” dynamic, even during rate-cut cycles theoretically favorable to risk assets. This precedent is a warning as BTC trades near elevated local highs.
Late August 2026 concentrates several high-risk catalysts: the Jackson Hole symposium (August 27-29), marking Kevin Warsh’s debut as Fed Chair; Nvidia’s earnings, with Bitcoin having become an indirect proxy for high-beta risk appetite; and July PCE inflation data, which will sharpen rate expectations.
Mapping liquidity: the order-book heatmap
The order-book heatmap provides a real-time map of market intent, visualizing where institutions are stacking limit orders. These zones act as magnets when price is nearby, or as absorption walls when they oppose the trend.
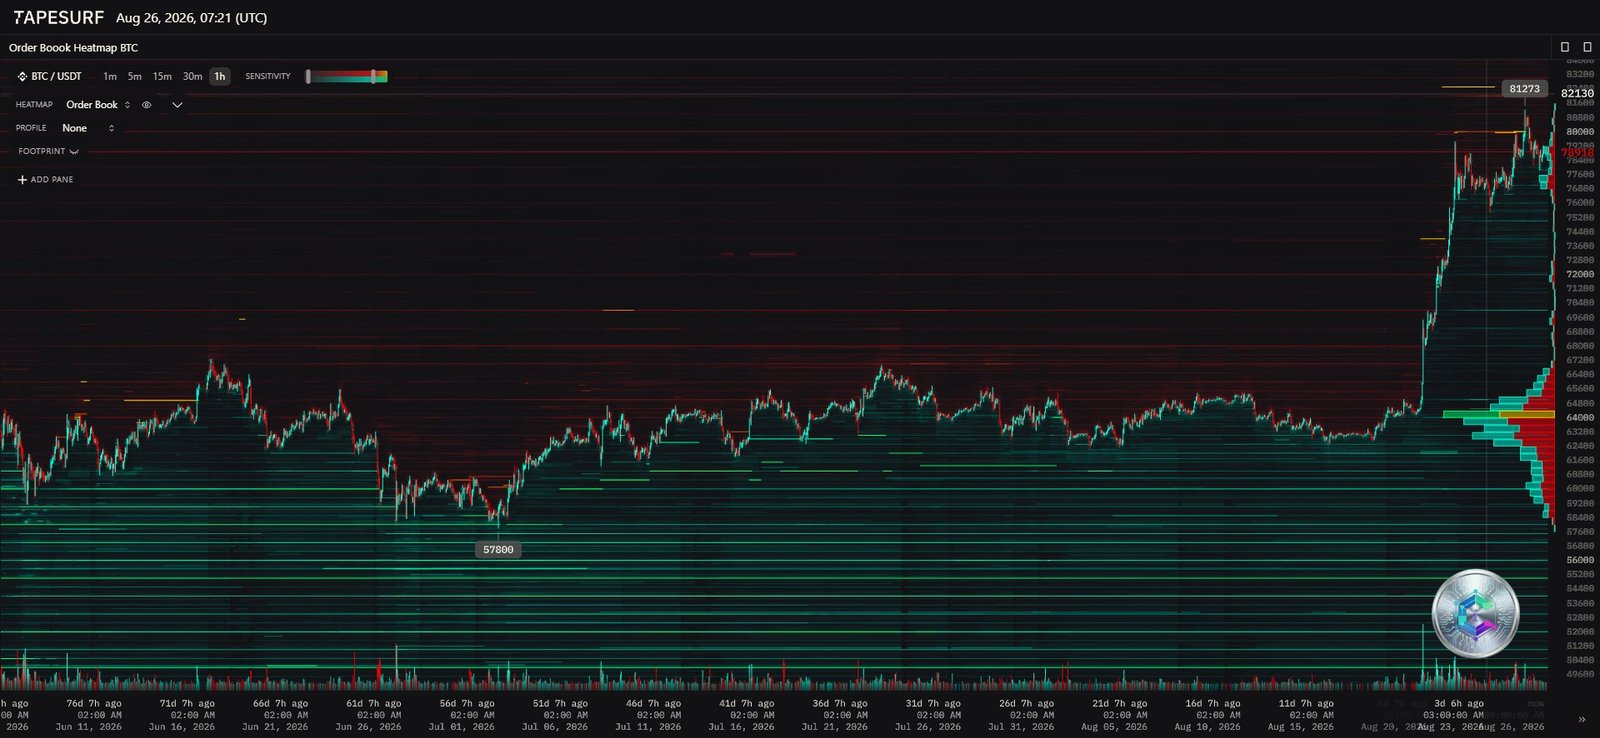
The heatmap reveals an extreme concentration of sell-side liquidity in the $81,000–$82,130 corridor, showing up as dense red/orange bands above the spot price — a genuine terminal sell wall. Conversely, a high-volume node forms between $62,000 and $64,000, encompassing the Median Realized Price estimated around $63,000 — the average acquisition cost of on-chain holders, and a massive buy-side floor.
The current gap between price (~$79,800) and this volume node creates a liquidity void that markets naturally tend to fill. If the market fails to durably break $82,130, the risk of a sharp pullback toward the $63,000 zone remains statistically elevated. A secondary accumulation layer around $57,800 marks the origin of the impulse that preceded the short squeeze.
Multi-timeframe technical reading
Underlying trend (Daily)
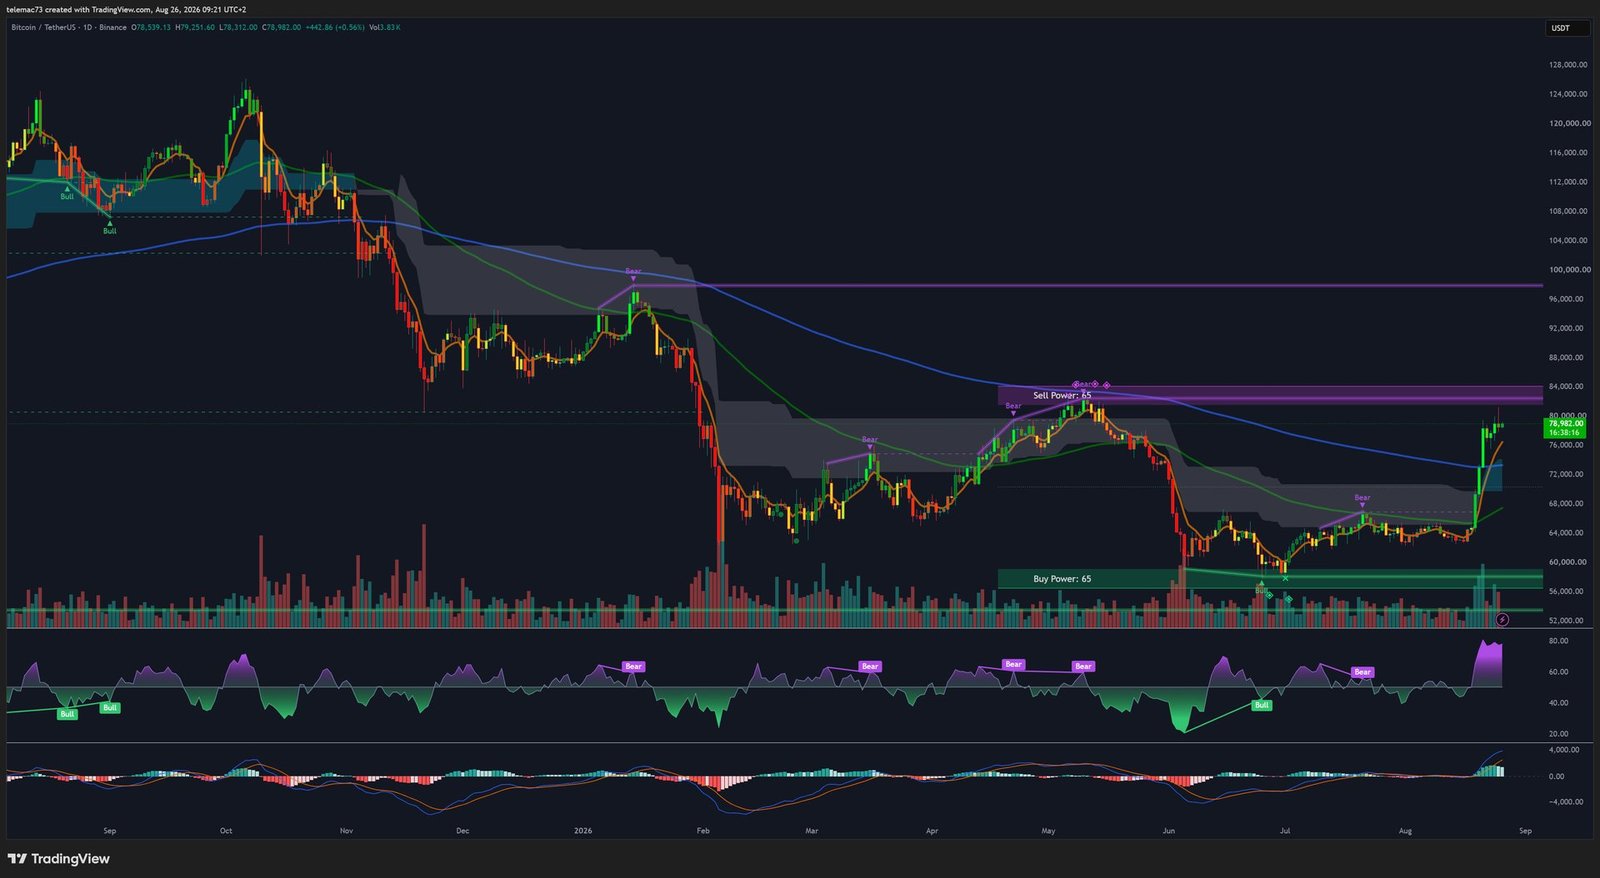
The daily chart offers the institutional perspective. Recent price action traces a V-shaped rebound or asymmetric double bottom, validated by exceptional volume expansion — the fingerprint of the billion-dollar short squeeze. Having broken through major resistance levels ($65,000, then $70,000) with ease, Bitcoin has fully reversed its market structure polarity: highs and lows are now unmistakably ascending.
Price trades comfortably above its 50-day exponential moving average, recently reclaimed with authority. The curvature of short and long moving averages suggests a potential “Golden Cross” forming, a technical signal closely tracked by trend-following quant funds. The daily MACD shows a strong bullish crossover, while RSI has pushed into extreme overbought territory (above 75-80), signaling a likely need for consolidation before any further sustainable leg higher.
Intermediate dynamics (4-hour)
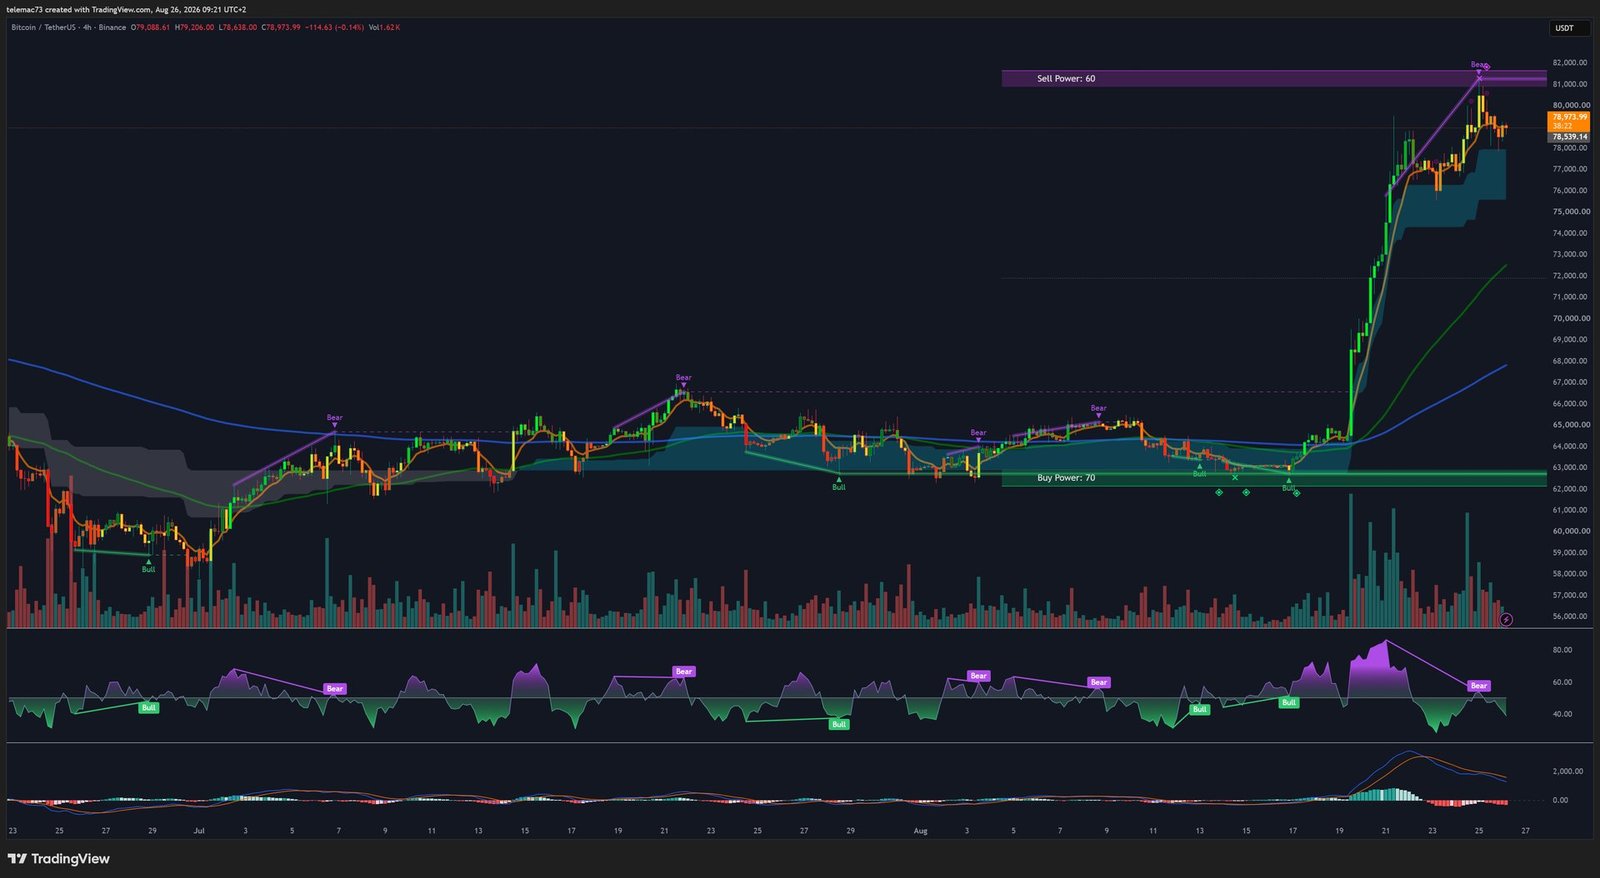
The swing traders’ preferred timeframe shows a sideways decompression phase after a peak above $80,000. Price is consolidating in the upper quarter of the prior impulse candle, drawing a textbook Bull Flag: dips are consistently bought at progressively higher levels. Order-flow indicators confirm the heatmap’s conclusions, with a “Sell Power: 60” band sitting exactly in the $81,000 zone, and a “Buy Power: 70” block much lower, around $62,000.
The 4H RSI, after reaching dizzying highs, is retreating toward the 60-65 zone without price collapsing proportionally — a healthy decompression that purges overbought excess while preserving bullish structure. The MACD histogram is tapering, giving faster moving averages time to catch up and offer dynamic support.
Microstructure (15-minute)
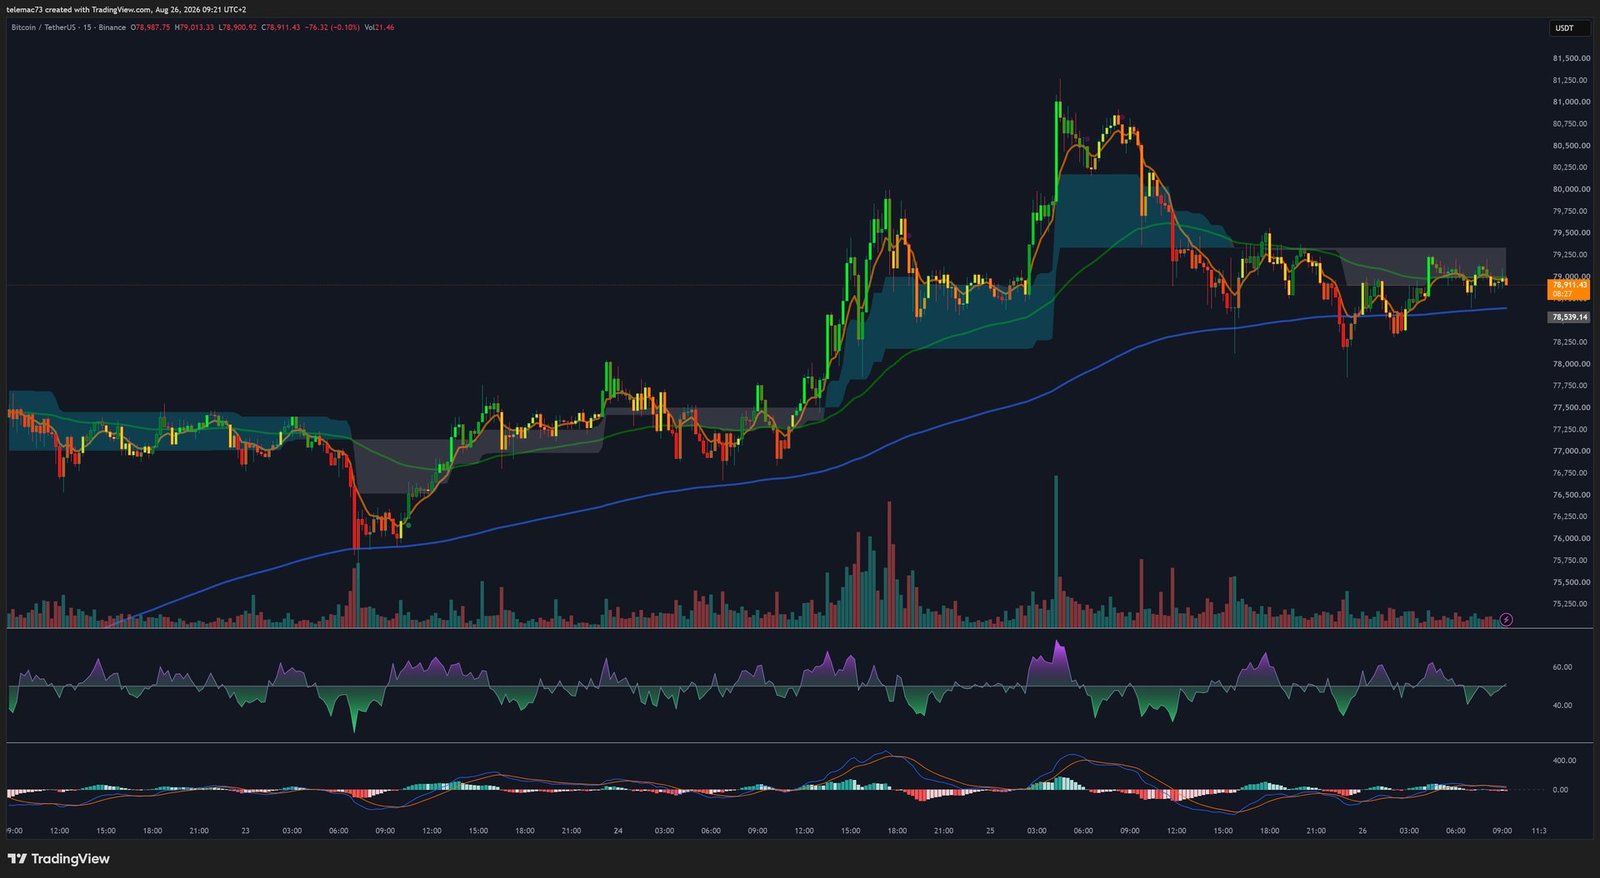
The 15-minute chart zooms into the anatomy of the ongoing consolidation inside the 4H bull flag. Price is trading tightly between $78,500 and $80,500, drawing a Compression Triangle with declining highs and firmly defended lows — a coiled spring storing energy while awaiting the next catalyst. The long moving average acts as a precise dynamic support around $78,500: as long as 15-minute closes stay above it, buyers retain control.
RSI has fully flattened around the 50 equilibrium line, while MACD hovers near the zero line without directional conviction. This triad of signals — flat RSI, MACD at zero, price compressing in a triangle — is a classic precursor to a sharp, imminent volatility expansion.
Key level summary
| Level (USD) | Classification | Technical & Macro Significance |
|---|---|---|
| 81,000 – 82,130 | Terminal resistance | Sell wall (heatmap) and “Sell Power 60.” Requires a massive dovish catalyst to break. |
| 78,500 | Intraday pivot support | M15 dynamic moving average. Last line of defense before a bull-flag correction. |
| 72,000 | Fill zone (FVG) | Logical retracement target to fill inefficiencies left by the vertical rally. |
| 64,000 | Major structural support | Median Realized Price and psychological rebound zone. |
| 62,000 | Liquidity node (POC) | “Buy Power 70” (H4). Highest historical accumulation volume. |
| 57,800 | Impulse origin | Base of the rebound preceding the billion-dollar liquidation. |
Two scenarios ahead
Bullish case: institutional absorption and price discovery
This scenario requires sustained ETF inflows above $1 billion per month, a dovish tone from Kevin Warsh at Jackson Hole, and strong Nvidia earnings restoring risk appetite. Technically, it would be confirmed by a high-volume bullish breakout of the 15-minute triangle, with a clean 4H close above $82,200 triggering the stop-losses of remaining short sellers. Fibonacci extensions would then project targets toward $85,000, then $88,000–$90,000.
Bearish case: exhaustion and gap fills
A restrictive tone from the Fed at Jackson Hole, persistent PCE inflation, or a stronger DXY would instantly weigh on Bitcoin, reviving the “sell the news” dynamic. A clean break of the $78,500 support would draw a double top on the 4H chart, opening the way toward $74,000, then $72,000, with a chain-liquidation risk for late longs extending down to the $63,000–$65,000 zone — a healthy leverage purge offering long-term participants an accumulation opportunity.
Disclaimer: This article is provided for educational and informational purposes only. It does not constitute investment advice, a recommendation to buy or sell, or a solicitation to act on financial markets. Crypto assets are highly volatile and risky instruments. Always do your own research (DYOR) and consult a qualified financial advisor before making any investment decision.

