


Bitcoin trades at $85,915 on the BTCUSDT pair on October 2, 2026, up 1.28% on the last daily candle and 11.23% over the past twenty days. Price sits 5.16% below the period high of $90,593 and 48.75% above the $57,759 low touched earlier in the year. The configuration extends the impulsive rebound initiated in late September from $74,909 and reflects a gradual return of buyers. The Uptober sequence — a name historically given by traders to the month of October — finds here a first technical expression.
Institutional demand remains the dominant driver. According to The Block (October 2, 2026), U.S. spot Bitcoin ETFs pulled in $2.65B of net inflows in September, the second-best month since October 2025, including $102.7M on October 1 alone. Dominick John, an analyst at Zeus Research, sees “an apparently established Q4 floor” and a “potentially more bullish setup for the quarter.” The Fear & Greed index reads 69 (greed without excess), while Bitcoin Foundation (September 28, 2026) reports that wallets holding 100–1,000 BTC have accumulated 113,950 BTC over ten weeks, roughly $9.7B at the current price. This dual flow — ETFs on the institutional side and on-chain accumulation on the medium-holder side — structurally supports the trend.
On the macro side, the Fed raised its policy rate to 3.75–4.00% on September 16, 2026, with a hawkish tone from chairman Kevin Warsh (Fidelity, September 22). The 10-year U.S. yield hit 5.243% per CNBC (October 1), the highest level since April 2002, maintaining pressure on risk assets. Recent prints are tamer: Core PCE m/m at 0.3% vs. 0.4% consensus on September 30, final GDP t/t at 6.1% vs. 6.4%, ISM Manufacturing at 54.5 vs. 55.0, and JOLTS job openings at 7,079 vs. 7,230 consensus. The October NFP report, due today at 2:30 PM Zurich time (consensus 90K vs. 162K prior), is the immediate catalyst that could push price out of the $86,800–$87,400 resistance zone.
Multi-Timeframe Technical Analysis
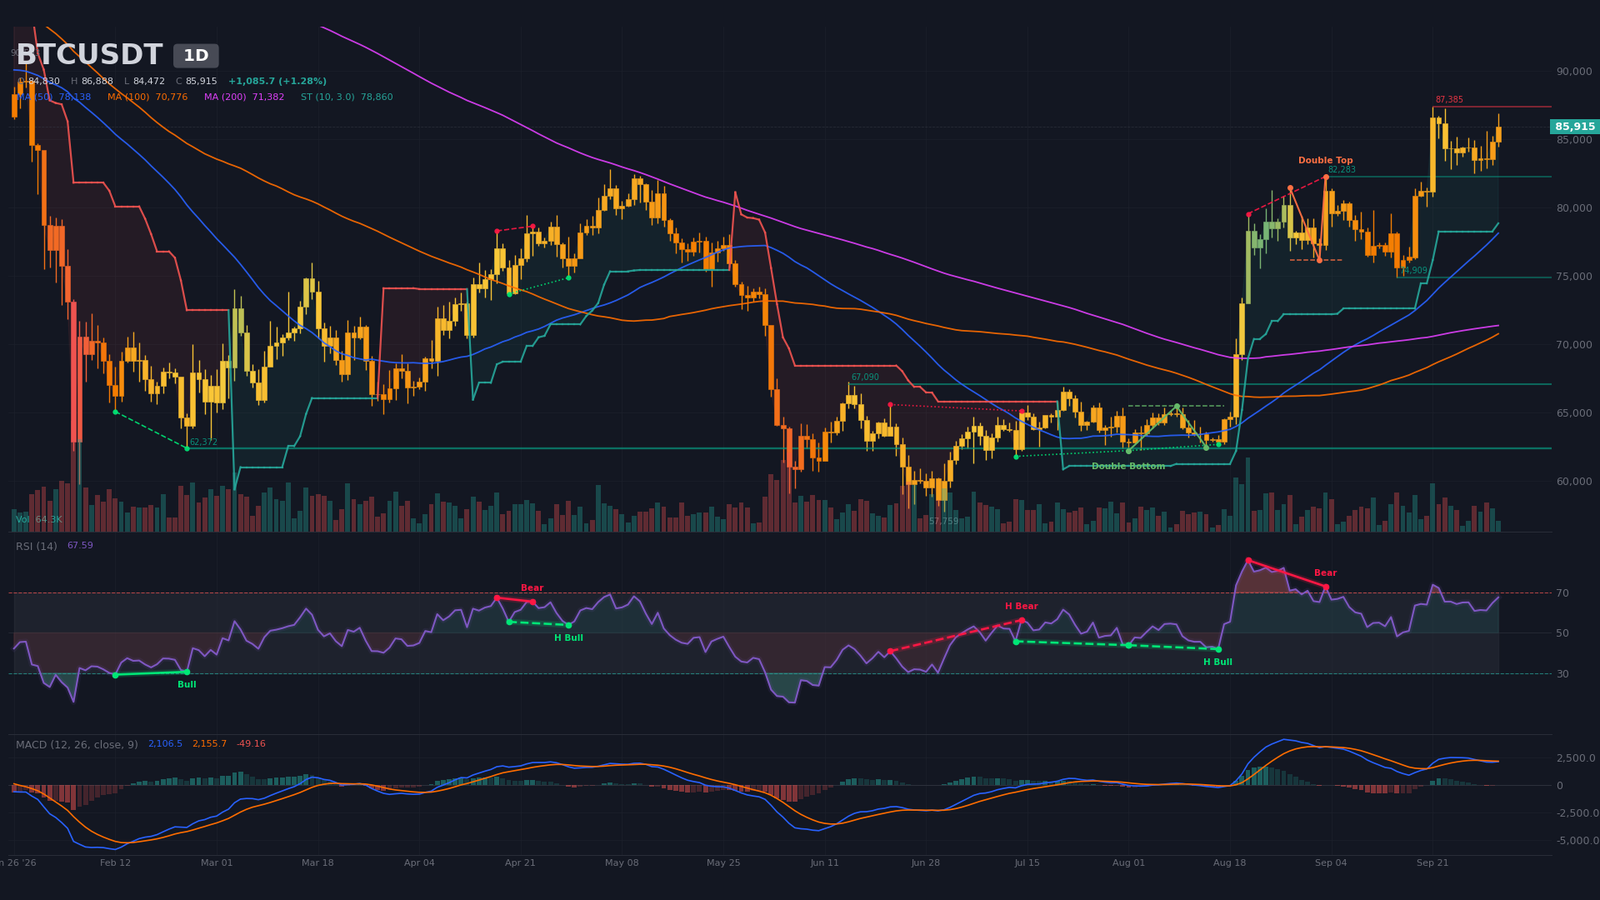
Daily Timeframe (1D): Impulsive Rebound Below the $87,385 Major Resistance
The dominant structure on the daily timeframe is a post-trough impulsive rebound. After a double-bottom validation (neckline at $65,483, algorithmic target $68,609 hit by late August), price printed a $87,385 high on September 21 before correcting toward $74,909 on September 15. The consolidation resolved in an 11.2% rally over the last 20 candles, returning price to the resistance zone that triggered the initial rejection.
Price trades above the three reference simple moving averages: 20-day SMA at $82,106, 50-day SMA at $78,138, and 200-day SMA at $71,382. The bullish 50/200 crossover from September 8 marks its 24th day, placing the structure in early maturity. RSI 14 at ~68 (neutral-bullish) remains rising from 60.9 on September 28. MACD posted a bearish crossover on September 29 — the first exhaustion alert — with a negative histogram at –49.
Session volume (64,291) represents only 45% of the 20-day average, signaling declining participation into the $87,385 resistance, where one algorithmic contact was detected. A regular bearish divergence was identified between August 21 ($79,555, RSI 86) and September 3 ($82,283, RSI 73) — an older signal now diluted by the subsequent impulse.
Intermediate Dynamics (4H): Ascending Triangle and Bullish Triple-Bottom Confirmed
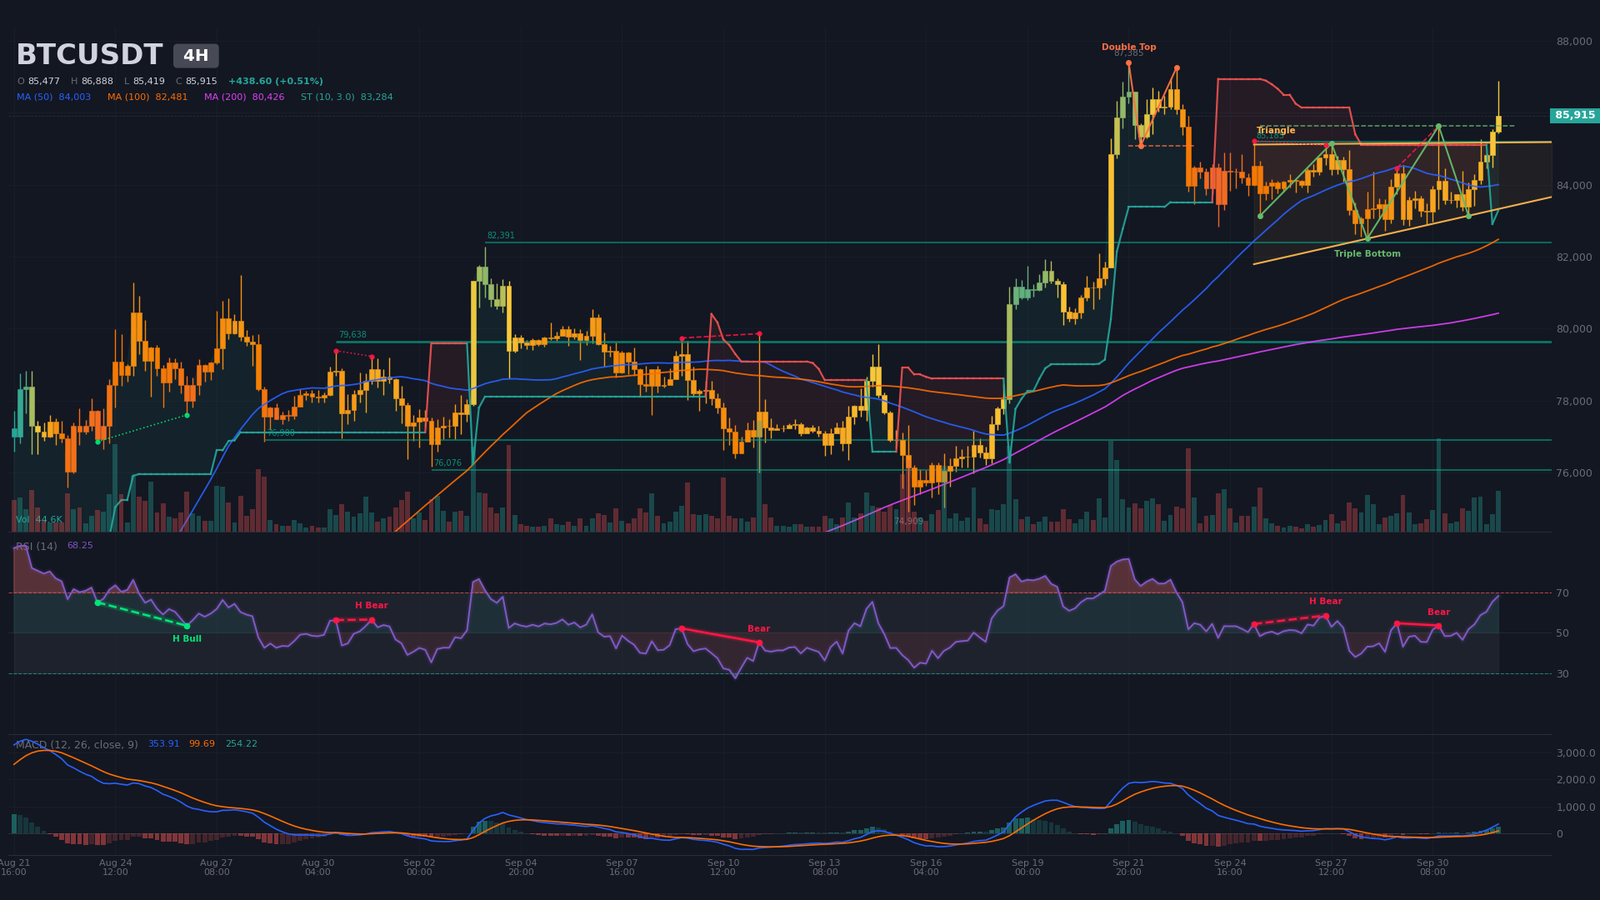
The four-hour timeframe validates a bull flag doubled with an ascending triangle: the compression between $83,137 (rising low) and $85,165 (horizontal resistance) since September 25 resolved in a confirmed breakout on the October 2 candle at 04:00, on volume of 44,600 (189% of the 20-period average). The triangle apex is estimated for October 10 at 16:48.
A bullish triple-bottom has also been confirmed (neckline $85,633, algorithmic target $88,343, last pivot October 1), offering +2.8% potential toward the daily resistance. The prior bearish double-top (neckline $85,080, target $82,844) was invalidated. RSI 14 at ~68 (neutral-bullish) supports momentum, and MACD shows a bullish crossover from September 30 at 08:00 with an expanding histogram at +254. The bullish SuperTrend at $83,284 (~3% below price) defines the invalidation threshold. A regular bearish divergence was detected between September 29 and 30 ($84,465 RSI 54.8 → $85,633 RSI 53.6), a technical signal to monitor if the rally extends without momentum confirmation.
Intraday Structure (15m): Post-Impulse Consolidation After the $86,888 Peak
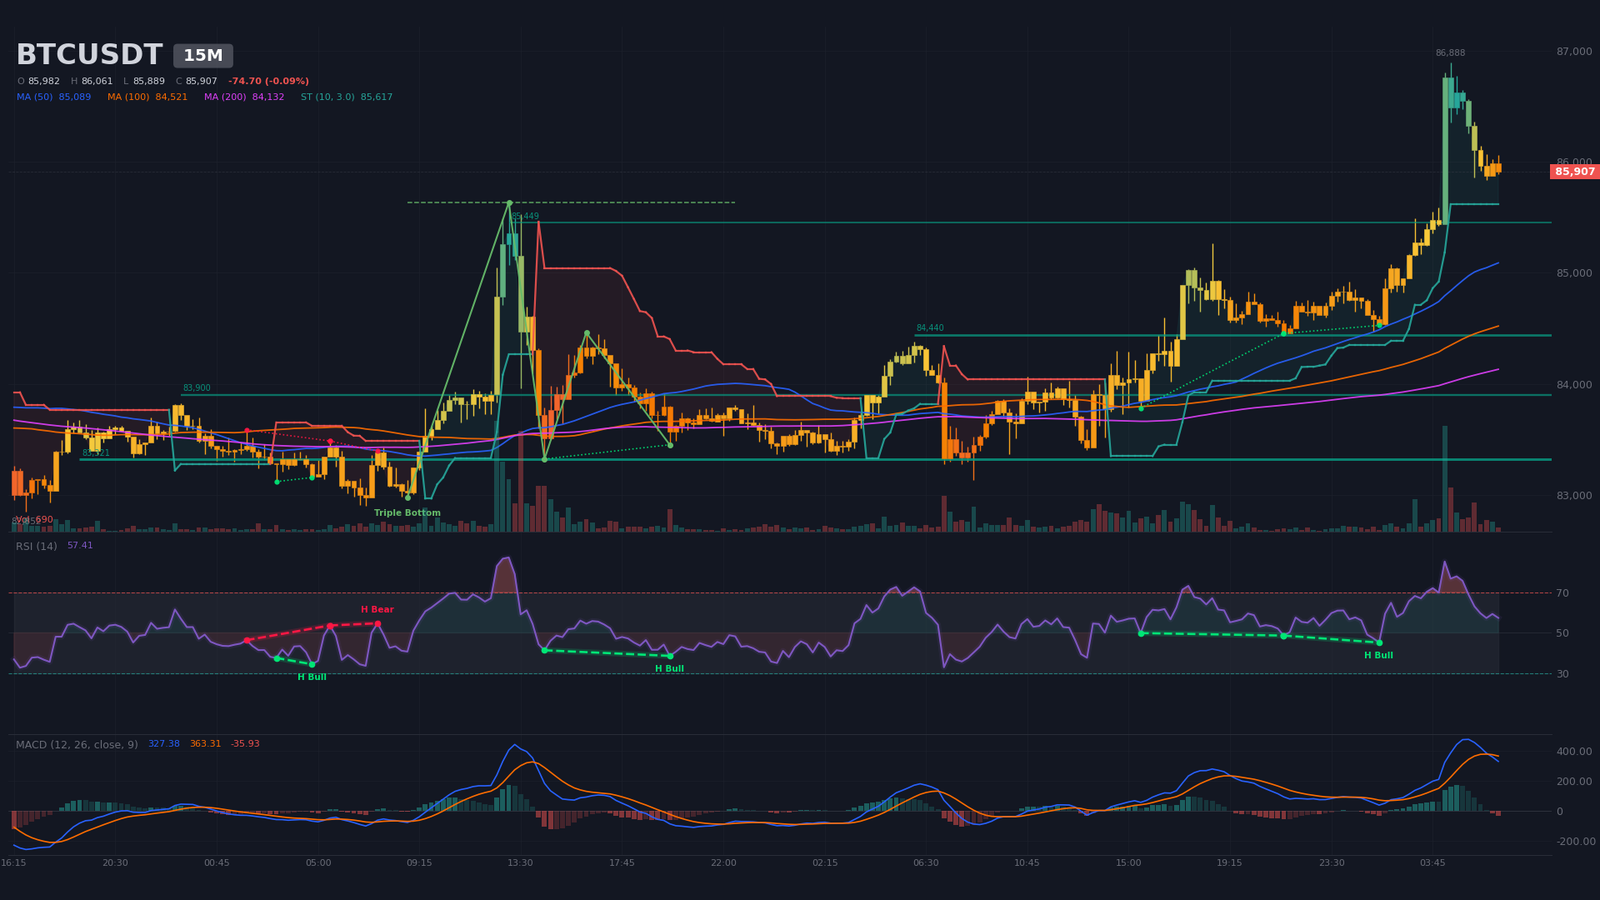
The dominant structure on the fifteen-minute timeframe is a post-impulse bull flag. The 04:15 candle on October 2 delivered an explosive ~2.1% extension in fifteen minutes, from the $85,435 low to the $86,888 peak, on volume of 17,222 (580% of average), followed by a descending-wedge consolidation on the 05:00 to 06:30 candles — a classic pullback configuration after a price explosion.
RSI 14 cooled from 76.9 (peak) to 57.4, returning to neutral territory. MACD just posted a bearish crossover at 06:15, with a negative histogram at –36. Three hidden bullish divergences (continuation) between September 30 and October 1 confirm a buyer consolidation, not a reversal. The confirmed triple-bottom (neckline $85,633, target $88,013) offers a +2.5% objective. Intraday supports sit at $85,449 (2 contacts), $84,440 (4 contacts), and the very dense $83,320 zone (10 algorithmic contacts). Immediate resistance is the sellers’ order wall at $85,965 ($32.1M).
Multi-Timeframe Synthesis
The table below condenses the reading across the three timeframes and highlights the bullish Daily / 4H convergence, nuanced by the intraday consolidation.
| Timeframe | Dominant trend | RSI (14) | MACD | Chart pattern |
|---|---|---|---|---|
| Daily (1D) | Bullish (impulsive rebound) | ~68 | Bearish crossover stabilizing, >0 | Post-double-bottom rebound, $87,385 resistance |
| 4 hours (4H) | Bullish (flag / triangle) | ~68 | Bullish crossover, expanding histogram | Ascending triangle + triple-bottom confirmed |
| 15 minutes | Neutral-bullish (consolidation) | ~57 | Fresh bearish crossover, >0 | Post-impulse bull flag |
Mapping of Technical Levels and Pivots
The mapping combines classic Daily pivots, algorithmic levels from detected patterns, and liquidity concentrations from the Binance order book. The short-term central pivot sits at $85,900, a zone that polarizes intraday buyers and sellers and serves as a reference for the strategy of the next sessions.
| Level | Price (USD) | Category | Technical foundation |
|---|---|---|---|
| Major resistance 3 (R3) | 87,800 – 88,400 | Estimated liquidations | Short liquidation peak at $87,805 ($360M estimated) + H4 triple-bottom target ($88,343) + Daily swing high Sept 21 ($87,385) |
| Major resistance 2 (R2) | 86,900 – 87,400 | Order wall + structure | Ask wall at $86,999.7 ($9.5M) + H4 triangle upper boundary ($85,165 broken) + 1.618 Fibonacci extension |
| Immediate resistance (R1) | 85,960 – 86,050 | Order wall + pivot | Ask wall at $85,964.9 ($32.1M, +0.07% distance) + Daily R1 pivot ($85,684) |
| Central pivot (P) | 85,800 – 85,960 | Technical convergence | Current price + 20-day SMA ($82,106) + Daily pivot $84,410 + H4 SuperTrend ($83,284) |
| Immediate support (S1) | 84,400 – 84,500 | Algorithmic support | M15 support at $84,440 (4 contacts) + H4 triangle lower boundary ($83,137) |
| Major support 2 (S2) | 82,400 – 82,800 | Swing low + liquidations | Daily swing low Sept 28 $82,500 + estimated liquidation pocket $80,733–$81,883 ($333M) |
| Major support 3 (S3) | 80,700 – 81,900 | Estimated liquidations | Long liquidation peak at $81,711 ($333M estimated, –4.9% distance) + Daily support $82,283 |
Order Book and Liquidity Heatmap
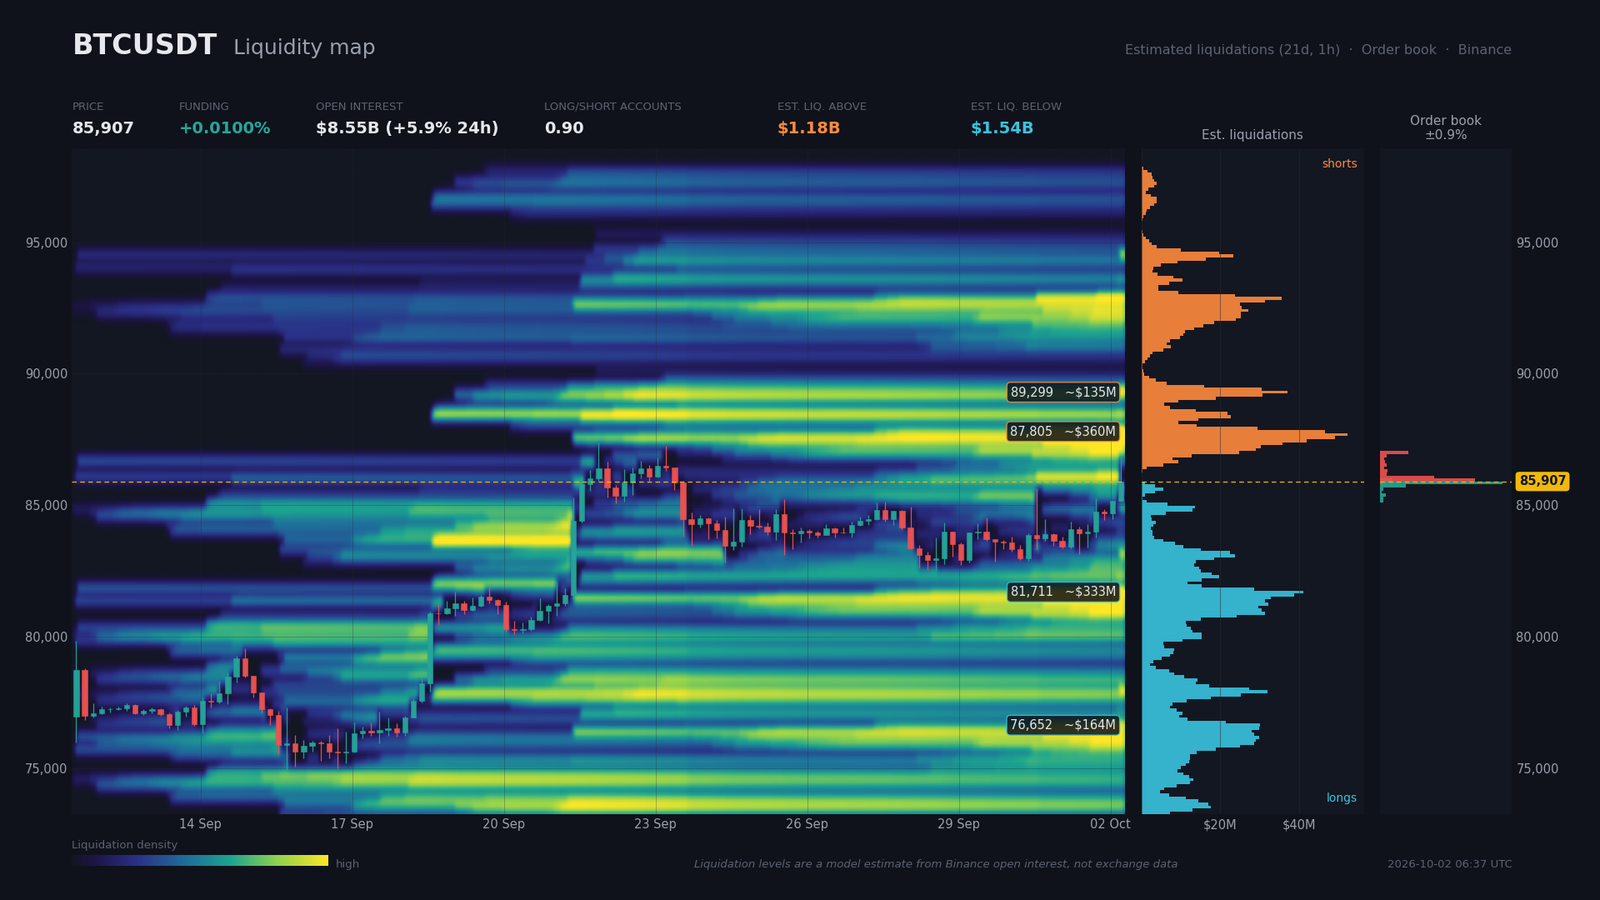
The Binance book shows a –10.6% imbalance in favor of sellers: $73.9M of asks against $59.7M of bids across the ±2% band, with 88% book coverage. The main buyer wall sits at $85,849.9 ($41.5M, –0.07% from price). Sellers’ walls step from $85,964.9 ($32.1M) to $86,999.7 ($9.5M), forming a very dense resistance belt across the $85,960–$87,000 zone that explains the intraday pullback from the $86,888 peak.
On the derivatives side, open interest stands at $8.55B (+5.88% over 24 hours, +5.26% over seven days), a sign of recent directional positioning. Funding is neutral at 0.01% (10.9% annualized), neither encouraging short squeeze nor long squeeze. The top-trader long/short ratio at 1.997 contrasts with the global ratio of 0.896: the best-informed accounts are twice as long as short.
Estimated liquidation pockets total $1.18B above (shorts) against $1.54B below (longs). The first bullish pocket, between $86,942 and $87,977 with a peak at $87,805, concentrates $360M — the short-term magnet price is currently testing. Below, the $80,733–$81,883 pocket ($333M) acts as a mirror: a pullback below $84,500 would open a liquidity sweep toward $81,700. The dominant risk is a bullish short squeeze on a clean $86,050 breakout on volume.
Calendar: Catalysts to Watch
The October NFP report, released today at 2:30 PM Zurich time, is the immediate catalyst of the day. Beyond, several high-impact macro events mark the next ten days and could shift the technical configuration, in particular the FOMC Minutes and the ISM Services print.
- Oct 2, 2:30 PM Zurich — NFP, unemployment, hourly earnings (USD): consensus 90K, 4.1%, 0.3% m/m. Weak print (<80K) → risk-on rally; strong print (>120K) → bond correction.
- Oct 5, 4:00 PM Zurich — ISM Services PMI (USD): previous 55.4. Key services-sector read, accounting for 70% of U.S. GDP.
- Oct 7, 8:00 PM Zurich — FOMC Minutes: explicit guidance on the hiking pace. Direct source of volatility.
- Oct 9, 4:00 PM Zurich — Michigan Consumer Sentiment Prel: previous 48.1, historical low, a stress signal.
- Oct 2, 11:00 AM Zurich — Inflation YoY Flash (EUR): consensus 3.6%, previous 3.2%. Moderate impact on BTC, watched for ECB tone.
Three Scenarios for the Coming Weeks
Three trajectories emerge from the mapped levels, the order book, and the macro calendar. The central scenario (A) remains a breakout to the upside, provided an accommodating catalyst — first and foremost the NFP — lifts the $86,050 resistance. Scenarios B (range) and C (bearish breakout) offer attractive R:R setups in case of an identified trigger.
Scenario A — Breakout Toward $87,800–$88,400 (probability 50%)
Trigger: weak NFP (≤80K) or accommodating surprise at 2:30 PM Zurich, combined with a confirmed $86,050 break above the sellers’ wall. Path: $86,050 → $86,888 (M15 peak) → $87,385 (Daily resistance / swing high) → $87,805 (estimated liquidation pocket) → $88,343 (H4 triple-bottom target). Execution zone: $85,960–$86,050 (wall breakout, volume confirmation > 30,000 on M15). Invalidation: H4 close below $85,165 (triangle upper boundary). Stop: $84,800 (≈ 1.2 × ATR14 H4 = $1,122). R:R: ~2.4 ($2,250 gain vs. $1,150 risk).
Scenario B — Rejection at Resistance and $83,200–$86,050 Range (probability 35%)
Trigger: in-line NFP (90K) or strong wage inflation keeping U.S. yields at 5.2% and beyond. Path: rejection at $86,050 → return to $84,500 (M15 support, 4 contacts) → test of $83,900 / $83,320 (dense M15 support, 10 contacts) → stabilization in the $83,200–$86,050 range until the FOMC Minutes on October 7. Execution zone: $85,800–$85,960 (sell below resistance, stop above the wall). Invalidation: confirmed Daily break > $86,500. R:R: ~1.6 ($1,800 gain vs. $1,100 risk).
Scenario C — Bearish Breakout Toward $81,700–$82,500 (probability 15%)
Trigger: very strong NFP (>120K) or ISM Services above 57 on October 5, triggering a rates rally. Path: loss of $84,440 → $83,320 → $82,500 (September 28 swing low) → $81,700 (estimated liquidation pocket $333M). Execution zone: $84,400–$84,500 (below the 4-contact M15 support, bearish acceleration). Invalidation: return above $85,165 on H4 close. Stop: $85,200 (1.3 × ATR14 H4). R:R: ~1.8 ($2,800 gain vs. $800 risk).
Summary and Conclusion
Bitcoin sits within a medium-term impulsive rebound, validated by a 24-day-old Daily 50/200 golden cross, but faces a major technical resistance around $87,385 reinforced by a sellers’ wall belt between $86,050 and $87,000 and by an estimated $87,800 liquidation pocket ($360M of shorts). The intraday pullback from the $86,888 peak takes the shape of a classic bull flag on the 15-minute timeframe, and the four-hour momentum remains expanding (bullish MACD, RSI 68).
Dominant strategy: favor entries at $85,200–$85,500 on a pullback toward the upper boundary of the four-hour triangle, targeting $87,800, with invalidation below $84,400 (1×ATR H4). Structural protection: Daily swing low at $82,500 and dense support at $83,320 (10 contacts). Critical levels: $86,050 (sellers’ wall), $87,385 (Daily algorithmic resistance), $84,440 (intraday support), $82,500 (Daily swing low), $81,700 (estimated liquidation pocket).
Sources
- Spot bitcoin ETFs log $2.7 billion in September inflows — The Block, October 2, 2026
- Crypto shorts take the brunt of $102 million liquidation wave — Crypto Briefing, October 2, 2026
- Bitcoin Whales Are Buying Again: 113,950 BTC Added in 10 Weeks — Bitcoin Foundation, September 28, 2026
- How high could interest rates go — Fidelity, September 22, 2026
- Friday’s big stock stories: What’s likely to move the market — CNBC, October 1, 2026
- A Brexit reversal is on the table 10 years on — CNBC, October 2, 2026
- Core Lightning warns attackers are targeting unpatched Bitcoin nodes — Cointelegraph, October 2, 2026
- SEC moves to clear custody hurdle for advisers offering crypto — Cointelegraph, October 2, 2026
- SEC Proposes New Rules On Crypto Custody — Bitcoin Magazine, October 1, 2026
- Jack Dorsey’s Block Launches Campaign To Get People Spending Bitcoin — Bitcoin Magazine, October 1, 2026
- XRP Outflows Spike Above 320M, Echoing August Rally Setup — CryptoPotato, October 2, 2026
- It’s the Start of Uptober. Will Bitcoin Live Up to It? — Decrypt, October 1, 2026
- SEC Gives U.S. Crypto Companies the Green Light to Operate Nationwide — Bitcoin Foundation, September 22, 2026
Disclaimer: This article is for educational and informational purposes only. It does not constitute investment advice, a recommendation to buy or sell, or an invitation to trade any financial asset. Cryptocurrency markets are extremely volatile; any investment decision should be based on your own research (DYOR) and, where appropriate, the advice of a licensed financial adviser.

