


Bitcoin trades at $79,850 on October 29, about 8.6% below the $87,385 period high set on September 21 and 38% above the $57,759 period low. The pullback is orderly rather than violent, but the structure has turned corrective: price sits beneath its daily moving averages and has failed to reclaim the $81,800 area.
The dominant driver remains U.S. monetary policy. On October 28 the Federal Reserve held its policy rate in a 3.75% to 4% range by a 10-2 vote, with Lisa Cook and Beth Hammack pushing for a 25-basis-point hike. It was the first dual dissent from a governor and a regional bank president on the same side since 1992 (Bitcoin Magazine, October 28). The statement described growth as « strong » and dropped its previous wording on the rate path. CME FedWatch puts the probability of a December hike, at the December 8-9 meeting, at 78.4% (Cointelegraph, October 29), while Treasury Secretary Scott Bessent said a further hike would be « not necessarily » a mistake (CNBC, October 28). Bitcoin touched about $81,700 after the announcement, slipped back below $80,500, and then fell to $79,667 during the October 29 session.
ETF flows tell a more mixed story. U.S. spot ETFs took in $110M on October 26 and $176M on October 27 (Bitcoin Magazine, October 28), after outflows of $487.1M on October 8 (CoinDesk) and $681.1M for the week ending October 10 (Abra). Galaxy Research counts nine funds and banks that cut their positions by 68,000 BTC (about $5.4B), while Morgan Stanley, Mubadala and Abu Dhabi were buyers (Decrypt, October 28). On the macro side, U.S. core durable goods came in at 0.5% against 0.6% expected on October 27, Japan’s annual inflation printed 2.1% in line with consensus, and UK retail sales disappointed at 0.8% versus 1% expected on October 23. The sources document no identifiable price effect from these releases, which matter mainly through the rate outlook they feed.
The technical reading that follows has to be seen through this lens. While the Fed keeps a hike on the table, rallies tend to meet supply, and the $79,200 to $79,600 floor becomes the short-term pivot of the setup.
Multi-Timeframe Technical Analysis
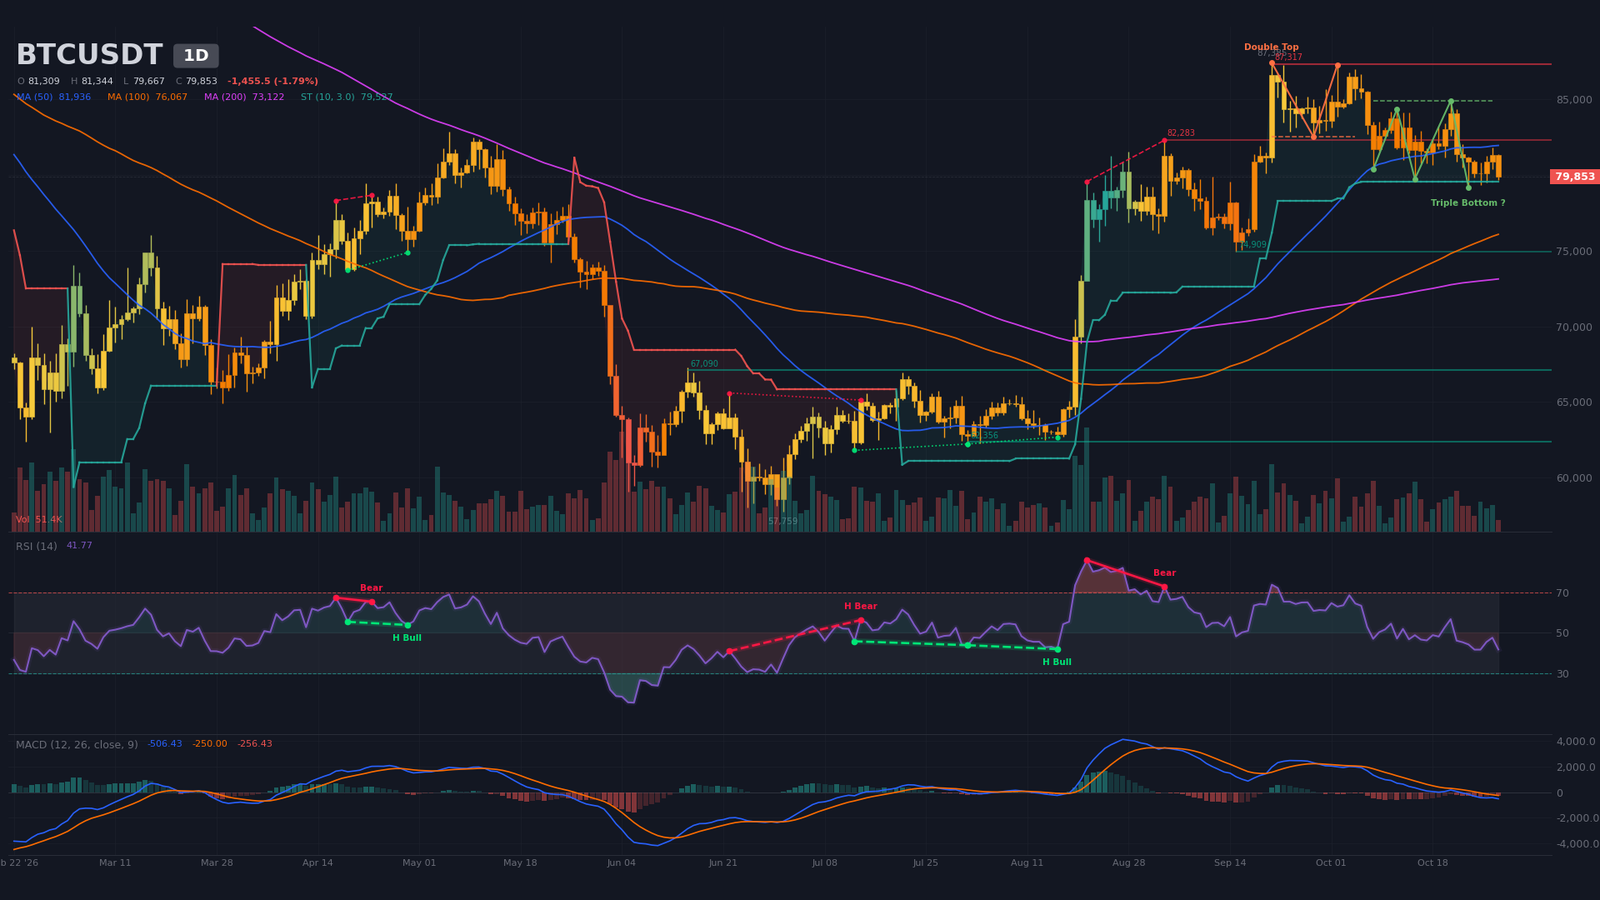
Daily Timeframe (1D): double top confirmed below the moving averages
On the daily chart, the structure is a corrective consolidation since the September 21 peak at $87,385. The highs at $87,250 (October 2) and $86,976 (October 5) were rejected, and rebounds then capped out at $84,340 (October 12) and $84,875 (October 21). Price trades below the SMA20 (≈$81,800) and SMA50 (≈$81,900) but remains above the SMA200 (≈$73,100). No 50/200 crossover has printed, and the $81,800 to $82,000 zone acts as dynamic resistance.
The algorithm flags a confirmed bearish double top, with a neckline at $82,500 and a target at $77,680. A bullish triple bottom is also detected but remains unconfirmed: its neckline sits at $84,880, with a target at $90,000, and it requires a daily close above $84,900. The daily SuperTrend stays bullish at $79,530, almost touching price; a break of that level would be the first real signal of a regime change.
Oscillators confirm the loss of momentum. The RSI (14) sits near ~42, neutral but sloping lower from ~57 on October 21. A regular bearish divergence between August 21 and September 3, with price rising while the RSI fell from ~86 to ~73, preceded the current correction. The MACD remains below zero and well under its signal line since the bearish crossover of September 29. Volume so far is only 43% of its 20-period average, a provisional figure until the candle closes.
Intermediate Dynamics (4H): a compressed range under descending averages
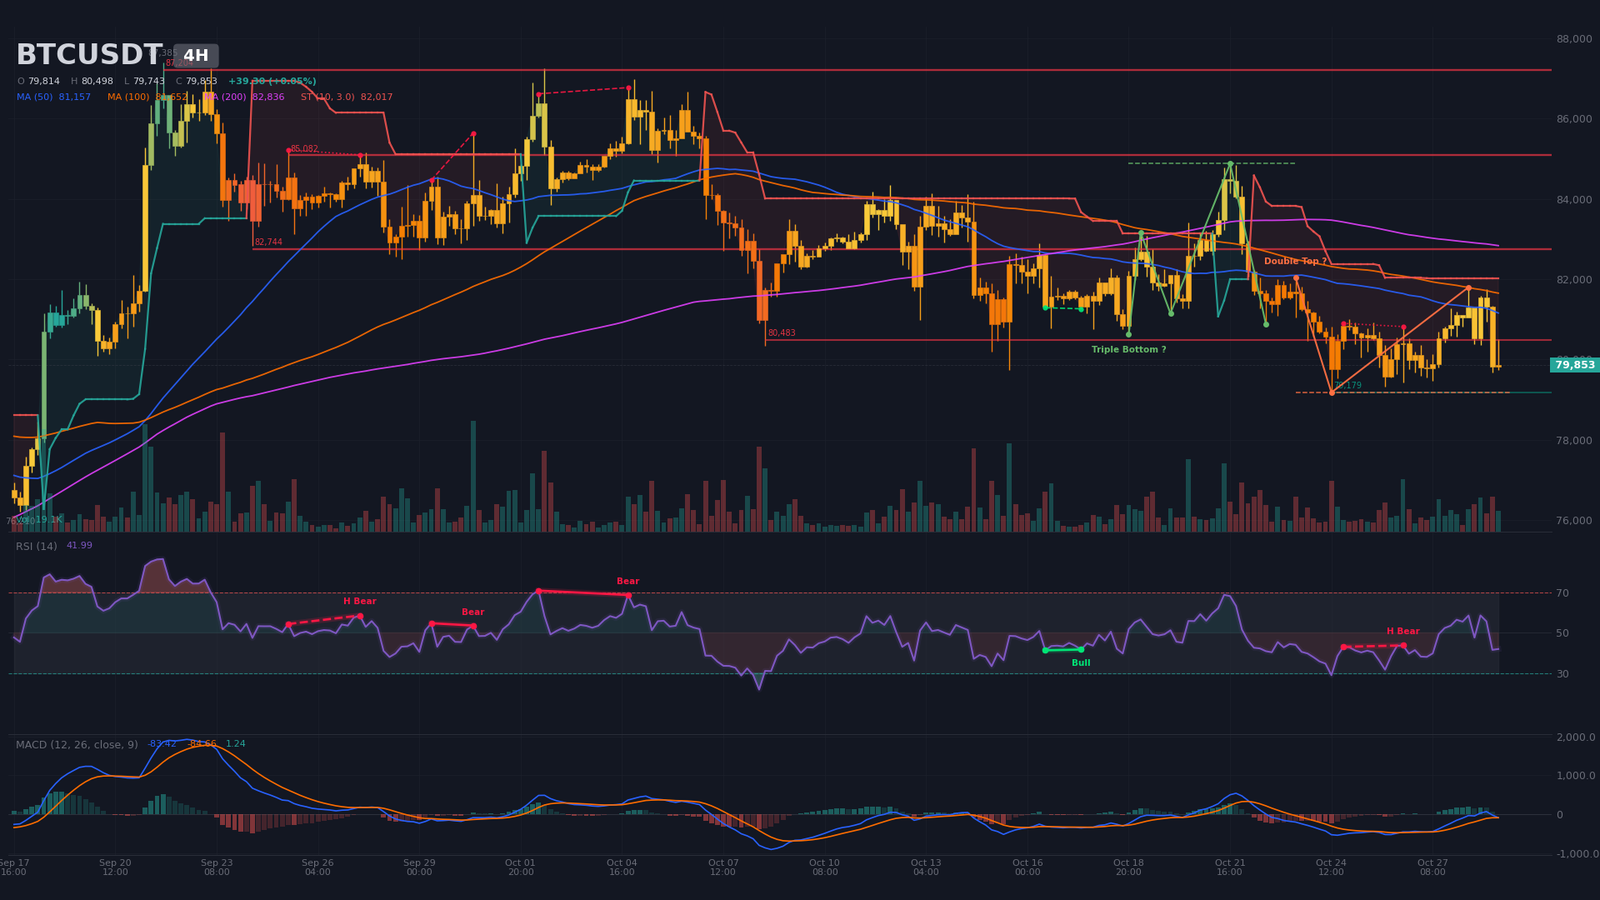
On the four-hour chart, price oscillates between $79,180 (the October 24 low) and $81,800 (the October 28 high). Lows keep clustering around $79,300 to $79,500 (October 26 and 27) while highs edge higher, with $81,270 followed by $81,800, a clear sign of compression. Price trades below the SMA20, SMA50 and SMA200 (≈$80,400, $81,150 and $82,840), and the H4 SuperTrend remains bearish at $82,020.
An unconfirmed H4 double top is flagged, with a neckline at $79,180 and a target at $76,440; an H4 close below $79,180 would validate it. The H4 triple bottom, with a neckline at $84,880 and a target at $88,860, is too far away to matter for now. Resistances sit at $80,480 (2 contacts), $82,740 (3 contacts) and $85,080 (3 contacts). The RSI is near ~42, with neither overbought nor oversold readings. The MACD crossed higher on October 26, below zero, with a barely positive histogram, which makes this a fragile rebound. A hidden bearish divergence (October 24 to 26) is classified as recent, and H4 volume is at 95% of its average.
Intraday Structure (15m): a wedge below $80,500
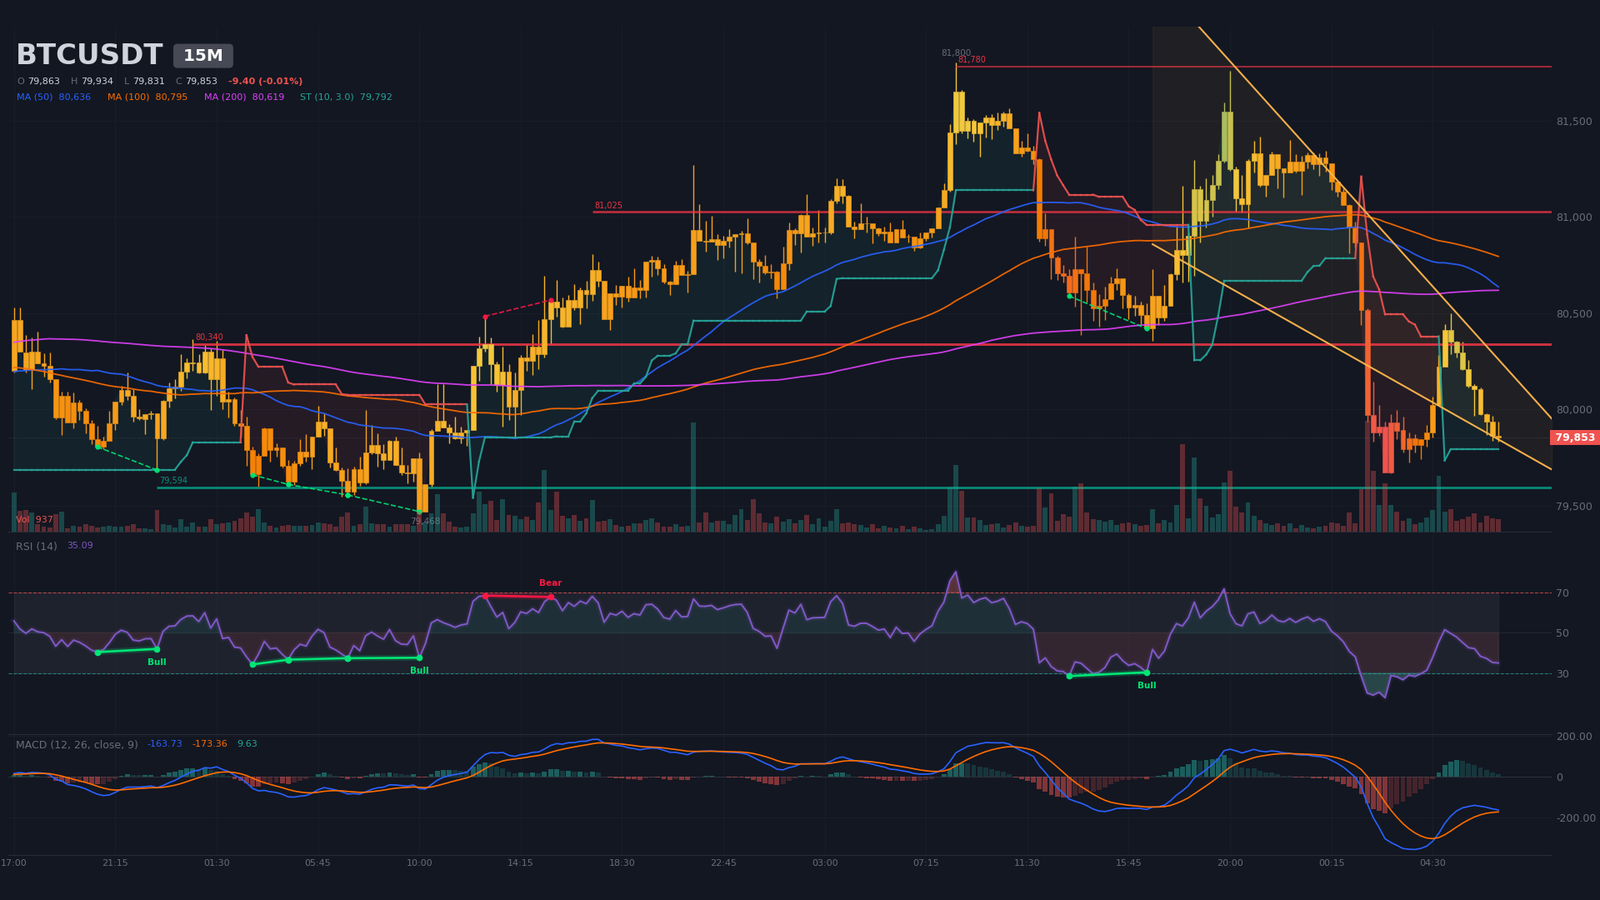
The algorithm detects a tight wedge between $79,980 at the lower boundary and $80,540 at the upper one, with an estimated apex on October 29 around 13:23. Price at $79,850 sits below the lower boundary: this is an analyst reading, since a bearish test is already under way and must be confirmed by a sustained 15-minute close below $79,590. The $79,590 support has five contacts; resistances sit at $80,340 (five contacts), $81,030 (four) and $81,780 (two). The M15 SuperTrend is bullish at $79,790.
The M15 RSI is near ~35, close to oversold, and a regular bullish divergence from October 28 is recent. The MACD has been above its signal line since 04:45, still below zero, and volume is at 63% of its average. The compression will probably resolve before or around the apex: a break below $79,590 opens the way to $79,180, while a return above $80,340 points to $81,030.
Multi-Timeframe Synthesis
| Timeframe | Dominant Trend | RSI (14) | MACD | Chart Pattern |
|---|---|---|---|---|
| Daily (1D) | Bearish (correction below SMA20/50) | ~42 | Bearish crossover on 09/29, below zero | Confirmed double top |
| 4 hours (4H) | Sideways with a bearish bias | ~42 | Bullish crossover on 10/26, fragile | Range / unconfirmed double top |
| 15 minutes (15m) | Rebound under resistance, compression | ~35 | Bullish crossover on 10/29, below zero | Wedge |
Key Levels and Pivot Map
The map combines classic daily and H4 pivots, detected supports and resistances, pattern targets, order walls and estimated liquidation pockets. No single impulse is used for Fibonacci extensions. The short-term central pivot lies between the H4 pivot ($80,275) and the daily pivot ($81,155): this is the zone where price must stabilize for the bias to change.
| Level | Price (USD) | Category | Technical Basis |
|---|---|---|---|
| Major Resistance 3 (R3) | $87,200 – $87,400 | Resistance | September 21 high at $87,385, daily resistance at $87,317 (2 contacts), H4 at $87,204 |
| Major Resistance 2 (R2) | $84,900 – $85,250 | Resistance | Triple bottom neckline ($84,875), estimated short pocket $84,946 – $85,261 |
| Immediate Resistance (R1) | $82,300 – $82,800 | Resistance | Daily double top neckline ($82,500), daily resistance at $82,283 and H4 at $82,744, estimated short pocket (peak $82,662) |
| Central Pivot (P) | $80,300 – $81,150 | Pivot | H4 pivot $80,275, daily pivot $81,155, H4 SMA20 $80,429, M15 resistance $80,341 |
| Immediate Support (S1) | $79,180 – $79,600 | Support | October 24 H4 low ($79,179), M15 support at $79,594 (5 contacts), daily SuperTrend $79,527, buy walls $79,722 – $79,827 |
| Major Support 2 (S2) | $78,400 – $78,960 | Support / liquidity | Estimated long pocket of $211.8M (peak $78,725) |
| Major Support 3 (S3) | $76,900 – $77,700 | Support | Daily double top target ($77,683), estimated long pocket $76,914 – $77,019, True Market Mean $77,765 (Bitfinex) |
Order Book and Liquidity Heatmap
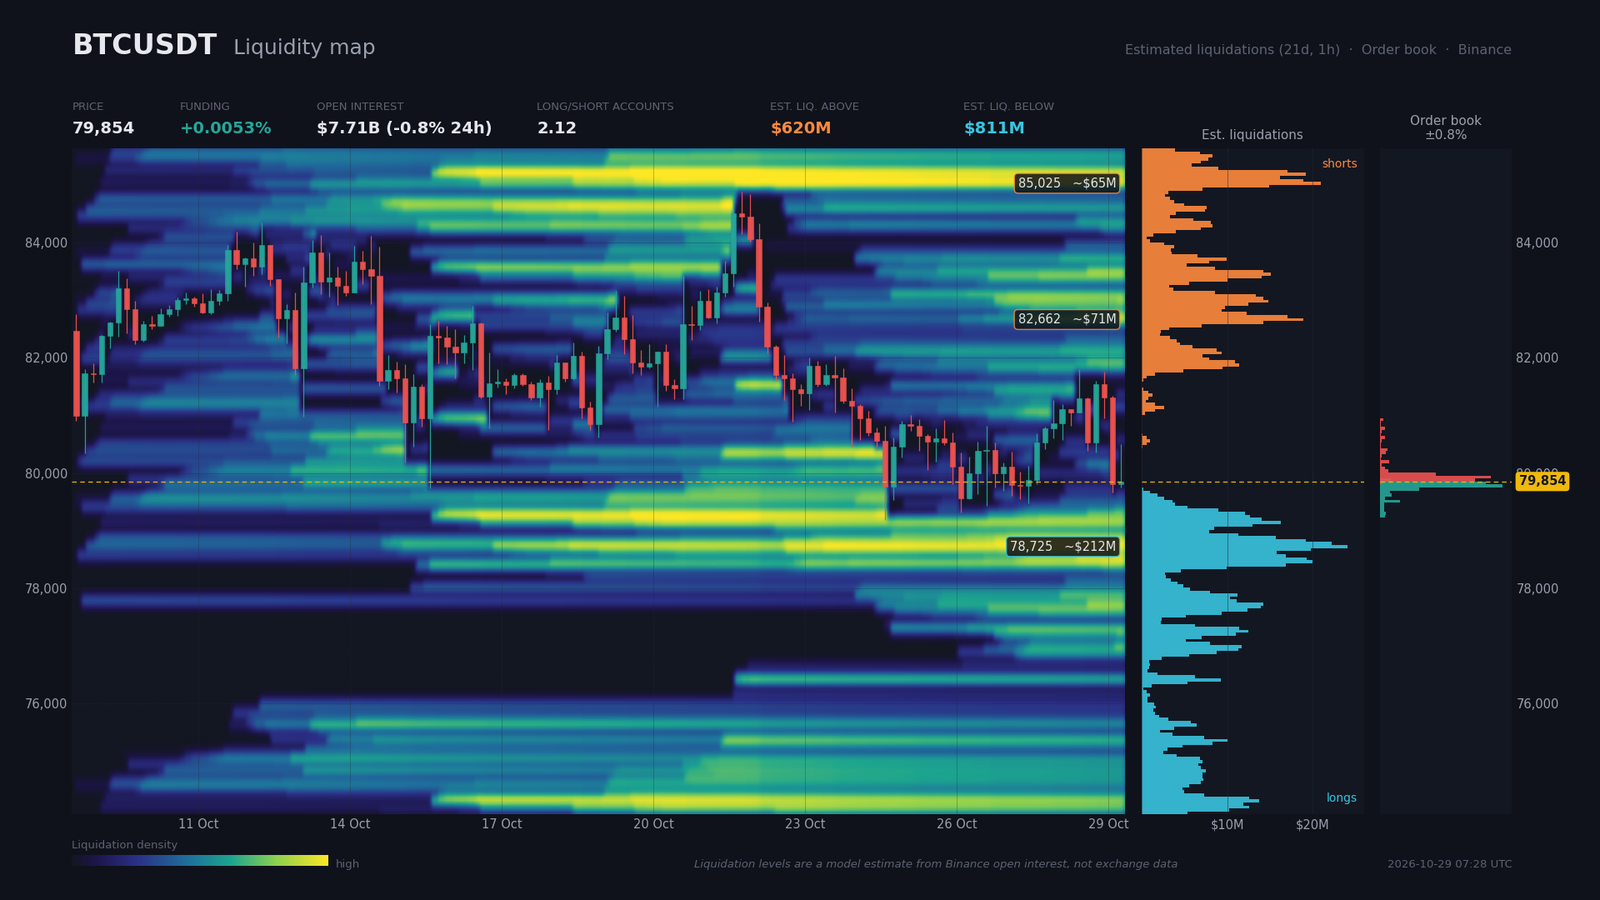
The order book is only readable across 0.76% around price. Sell walls sit at $79,880 ($22.7M), $79,930 ($26.5M), $79,985 ($13.4M) and $80,195 ($2.1M), facing buy walls at $79,827 ($25.2M), $79,775 ($29.2M), $79,722 ($9.2M) and $79,512 ($4.7M). Balance is almost perfect at the touch of price. Within a 2% window, bids total $82.6M against $75.9M for asks, a 4.2% imbalance in favor of buyers; beyond 0.76%, only estimated liquidations inform liquidity.
The estimated liquidation zones, built on a model driven by open interest rather than measured data, are asymmetric. Above price, shorts total roughly $620M: $70.7M between $82,580 and $82,790 (+3.5%), then $65.4M between $84,950 and $85,100 and $53.0M between $85,160 and $85,260. Below price, longs total roughly $811M, with a dominant $211.8M pocket between $78,380 and $78,960 (−1.4%), followed by $28.8M near $76,990 and $38.3M near $74,310. The pocket at −1.4% acts as a plausible magnet.
Funding is slightly positive at 0.0053%, or about 5.8% annualized, and open interest reaches $7.71B (−0.8% over 24 hours, +1.3% over seven days). The account-based long/short ratio is 2.12, the top traders’ ratio is 2.0, and the 24-hour taker buy/sell ratio of 0.96 signals a mild selling bias. This mix points to a net long positioning with moderate leverage, and therefore to vulnerability to a liquidity sweep toward $78,400 to $78,960. Conversely, a bullish squeeze toward $82,600 would require a macro trigger.
Calendar: Catalysts to Watch
The 13:30 PCE print on October 29, followed by the Deribit expiry at 09:00 on October 30, is the appointment most likely to move price out of its $79,200 to $81,800 range. The items below are the ones able to truly shift the tape.
- Thursday, October 29, 13:30 (Zurich) — Core PCE m/m (consensus 0.3%, previous 0.2%): an upside surprise would strengthen the December hike scenario and put the $79,200 floor under pressure.
- Thursday, October 29, 13:30 (Zurich) — Advance GDP q/q (consensus 3.2%, previous 2.2%) and personal income (0.6%, previous 0.9%): robust growth would confirm the Fed’s restrictive tone.
- Thursday, October 29, 14:15 (Zurich) — ECB main refinancing rate (consensus 2.65%) and deposit facility (consensus 2.5%), both unchanged: a hold would reinforce the view of a global high-rate cycle.
- Friday, October 30, 04:00 (Zurich) — BoJ policy rate (consensus 1.25%, unchanged), press conference at 07:30: a non-restrictive tone would support Scenario C.
- Friday, October 30, 09:00 (Zurich) — Monthly expiry of BTC and ETH options on Deribit, medium impact: it can amplify moves around the most-traded strikes.
- Tuesday, November 3 — U.S. midterm elections (Bitcoin Magazine), a political event whose effect on price remains indirect for now.
Three Scenarios for the Coming Weeks
Three paths stand out, with probabilities totaling 100%. They all start from the same observation: price is compressed between $79,200 and $81,800, and the direction of the exit will decide the next leg.
Scenario A — Bearish continuation toward the double-top target (probability 45%)
This remains the most likely path, because it rests on the full daily structure and on a rate backdrop that is tightening. The trigger is twofold: a core PCE print above consensus by 0.3% at 13:30 on October 29, and/or heightened volatility around the Deribit expiry on October 30 at 09:00. An H4 close below $79,180, or a clean rejection of the rebound between $80,340 and $80,500, would open the path toward $78,725, then the daily double-top target at $77,680, and finally $76,440, the H4 objective. The stop, placed above $81,300, sits roughly $900 away and exceeds the H4 ATR (≈$814); the risk-reward ratio (R:R) reaches about 1.9 toward $78,725 and 3 toward $77,680. Execution zone: sell the rebound between $80,340 and $80,500. Invalidation: H4 close above $81,300, the October 28 close.
Scenario B — Liquidity sweep followed by a rebound (probability 35%)
This scenario assumes the market first seeks liquidity below before turning. The trigger is a wick toward $78,400 to $78,960, the estimated long pocket, followed by a reclaim of $79,600 on the M15 or H4 chart. The path leads to $80,340, then $81,030 and finally $81,800. The entry would sit between $78,500 and $78,950, with invalidation on an H4 close below $77,600, just under the $77,683 target and the True Market Mean at $77,765. The risk of roughly $1,100, at least equal to the H4 ATR, for an R:R of about 1.5 toward $80,340 makes this setup more technical than comfortable. Execution zone: buy between $78,500 and $78,950. Invalidation: H4 close below $77,600.
Scenario C — Bullish reversal, invalidating the bearish bias (probability 20%)
This scenario challenges the current bearish bias. It requires a PCE print below consensus and/or a non-restrictive BoJ on October 30, both of which would ease the rate backdrop. The trigger would be an H4 close above $82,750, the daily double-top neckline and the estimated short zone between $82,580 and $82,790. The path targets $85,000, where the estimated short pocket meets the triple-bottom neckline, then $87,300. The $90,000 objective linked to the triple bottom remains unconfirmed until price closes above $84,900. Execution zone: retest of $81,800 to $82,300 after the breakout. Invalidation: H4 close below $81,300, with a risk at least equal to the H4 ATR.
Synthesis and Conclusion
The phase is a corrective consolidation below $82,500, in an environment where the Fed is not easing its stance. ETF flows are mixed: the $286M of inflows recorded on October 26 and 27 coexist with the heavy exits by fast money documented by Galaxy Research. These flows cushion the decline without reversing the trend. For the structure to turn bullish again, price would need to close above $82,750, and more decisively above $84,900, the triple-bottom neckline. The macro backdrop therefore supports a cautious bearish bias, tempered by ETF flows that stayed positive early in the week; conviction is moderate, with a confluence score of 3 out of 5.
The dominant technical strategy is to sell rebounds below $80,500 as long as price stays under $81,300 on an H4 close. A break of $79,180 would accelerate toward $78,700, then $77,700. The protection level is $81,300 for sellers and $77,600 for buyers of a liquidity sweep. The critical levels to watch are $82,300 to $82,800, $80,340 to $80,500, $79,180 to $79,600, $78,400 to $78,960 and $77,700. This read only holds while these thresholds are respected, and the analysis should be updated after each macro release.
Sources
- Fed’s hawkish rate hold keeps pressure on Bitcoin: Analysts — Cointelegraph, October 29, 2026
- Bitcoin Price Trades Above $81,500 as Fed Keeps Rates Steady in Split Vote — Bitcoin Magazine, October 28, 2026
- Here are five key takeaways from the Fed rate decision and Warsh news conference — CNBC, October 28, 2026
- Bessent says ‘not necessarily’ a mistake if the Fed hikes again — CNBC, October 28, 2026
- Wall Street’s Fast Money Fled Bitcoin ETFs, Sovereign Funds Stepped In — Decrypt, October 28, 2026
- Bitcoin ETFs bleed nearly $500 million in one day: Crypto Daily — CoinDesk, October 8, 2026
- This Week in Crypto: Security and Rules in Focus — Abra, October 13, 2026
- Bitcoin Tests Key Support as Fed Decision Looms — Bitfinex blog, October 26, 2026
- Bitcoin Treasury Datavault AI Says It Can’t Access Its BTC, Stock Tanks — Decrypt, October 28, 2026
Disclaimer: This article is for educational and informational purposes only. It does not constitute investment advice, a recommendation to buy or sell, or an invitation to trade any financial asset. Cryptocurrency markets are extremely volatile; any investment decision should be based on your own research (DYOR) and, where appropriate, the advice of a licensed financial adviser.

