


- Ethereum has bounced about 9% from $1,536 but stays below all key averages inside a bearish trend running for six weeks.
- Driver: a leverage purge ($1.53B liquidated in 24h) and capital rotation after the Anthropic IPO, with ETF outflows.
- Watch: the PCE release on November 25 and the Deribit expiry on November 27 to settle the $1,780–$1,795 zone.
Ethereum trades near $1,677 on November 21, in candles that are still open, after touching a low of $1,536 earlier the same day. The rebound of roughly 9% from that floor does little to hide the scale of the decline: the daily peak of $2,806.8 on September 21 sits about 40% above the price. Six consecutive weekly declines have flipped the weekly trend, and price now sits below its 10- and 20-week simple moving averages ($2,324 and $2,220).
The dominant shock came from outside crypto. Anthropic’s IPO on November 19 at $83 a share raised $81.34B, the largest listing in history according to Decrypt (November 20). CNBC notes that Ether had fallen 25.3% and 28% in the 30 days before the Anthropic and SpaceX listings, a pattern read as capital rotating out of digital assets. On Friday, November 20, the Nasdaq dropped about 5% and the S&P 500 about 3.5%, pulling Bitcoin down to $57,655. Over 24 hours, $1.53B of leveraged positions were liquidated, $1.4B of them longs, and the Fear & Greed index fell to 9, its lowest since February.
Flows and macro add to the pressure. US spot Bitcoin ETFs booked $582M of outflows on Thursday, including a record $541M from IBIT, while month-to-date outflows range from $2.9B (Decrypt) to $3.5B (Bitcoin Magazine). Aggregate open interest in Ethereum fell to $9.12B, its lowest since October 2024 (E8 Markets, November 18). Markets price more than a 98% probability of a 25-basis-point Fed hike in December, and Treasury Secretary Bessent ruled out a 50-point move. US housing starts surprised to the upside at 1.309M against 1.245M expected, while Japanese core inflation at 2.2% keeps the odds of a BoJ hike in December at 72%. Rising rates and a firm dollar weigh on risk assets.
This backdrop frames the technical reading that follows: a rebound born from a leverage purge and extreme sentiment, but not yet backed by flows or macro.
Multi-Timeframe Technical Analysis
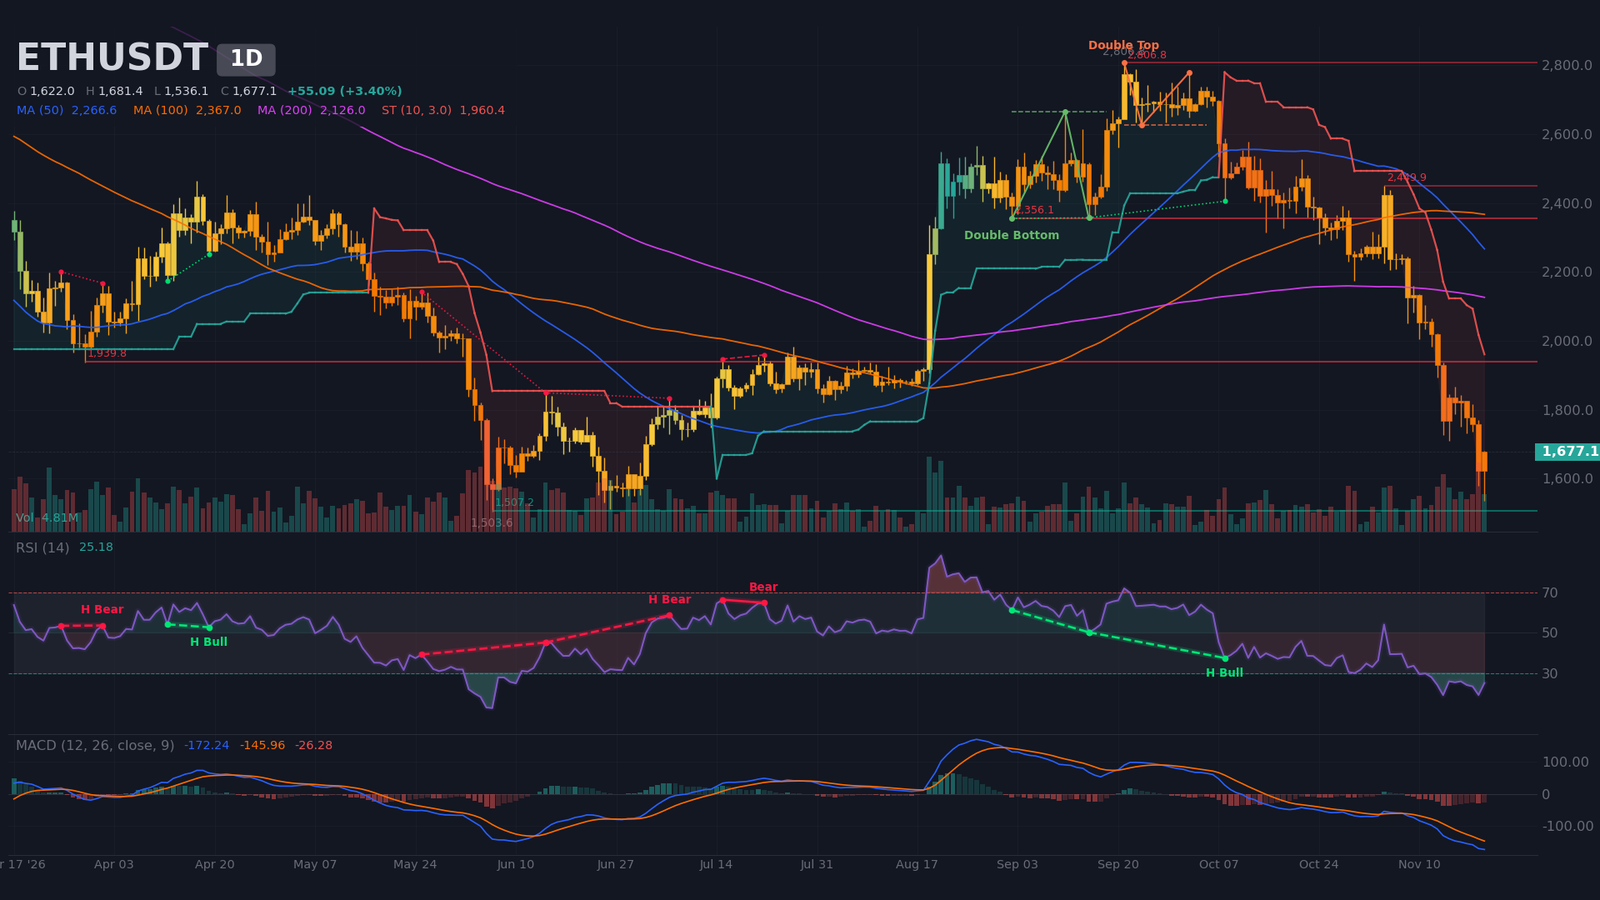
Daily Timeframe (1D): Late-Stage Sell Impulse in Oversold Territory
On the weekly chart, this is a reversal rather than a simple correction. Price sits below the 10- and 20-week SMAs after six weeks of declines, with weekly RSI at 35, and it is testing the weekly S1 pivot at $1,643. The November 20-21 bounce therefore unfolds inside a bearish primary trend.
On the daily, the trend is established: ADX reads 44, Bollinger Bands are expanding (rank 93), and price trades below the 20-day SMA ($2,003), the 50-day ($2,267) and the 200-day ($2,126), with no 50/200 cross yet. The SuperTrend stays bearish at $1,960. The confirmed double top, with a neckline at $2,626 and a $2,459 target, has largely been reached and no longer adds information. The bullish double bottom, targeting $2,976, is obsolete since price closed below its last low at $1,710. On the major impulse from the June 6 low ($1,503.6) to the September 21 high ($2,806.8), the current retracement is near 87%, beyond the 78.6% Fibonacci level at $1,782, now the first resistance to reclaim. The next structural support is the June low at $1,504–$1,507, tested twice.
Oscillators confirm oversold conditions without reversing the trend. RSI sits near 25, flat at low levels, with no bullish divergence detected. MACD has been below zero since its bearish crossover on November 8, and the negative histogram is expanding. Volume on the November 20 candle reached 228% of its 20-day average, the highest of the last 40 candles: a possible capitulation, though still a hypothesis. Price trades below the value area ($1,802–$2,535), which explains the speed of recent moves, and volume nodes at $1,761 and $1,897 act as resistance.
Intermediate Dynamics (4H): Broken Triangle, Rebound Under the Averages
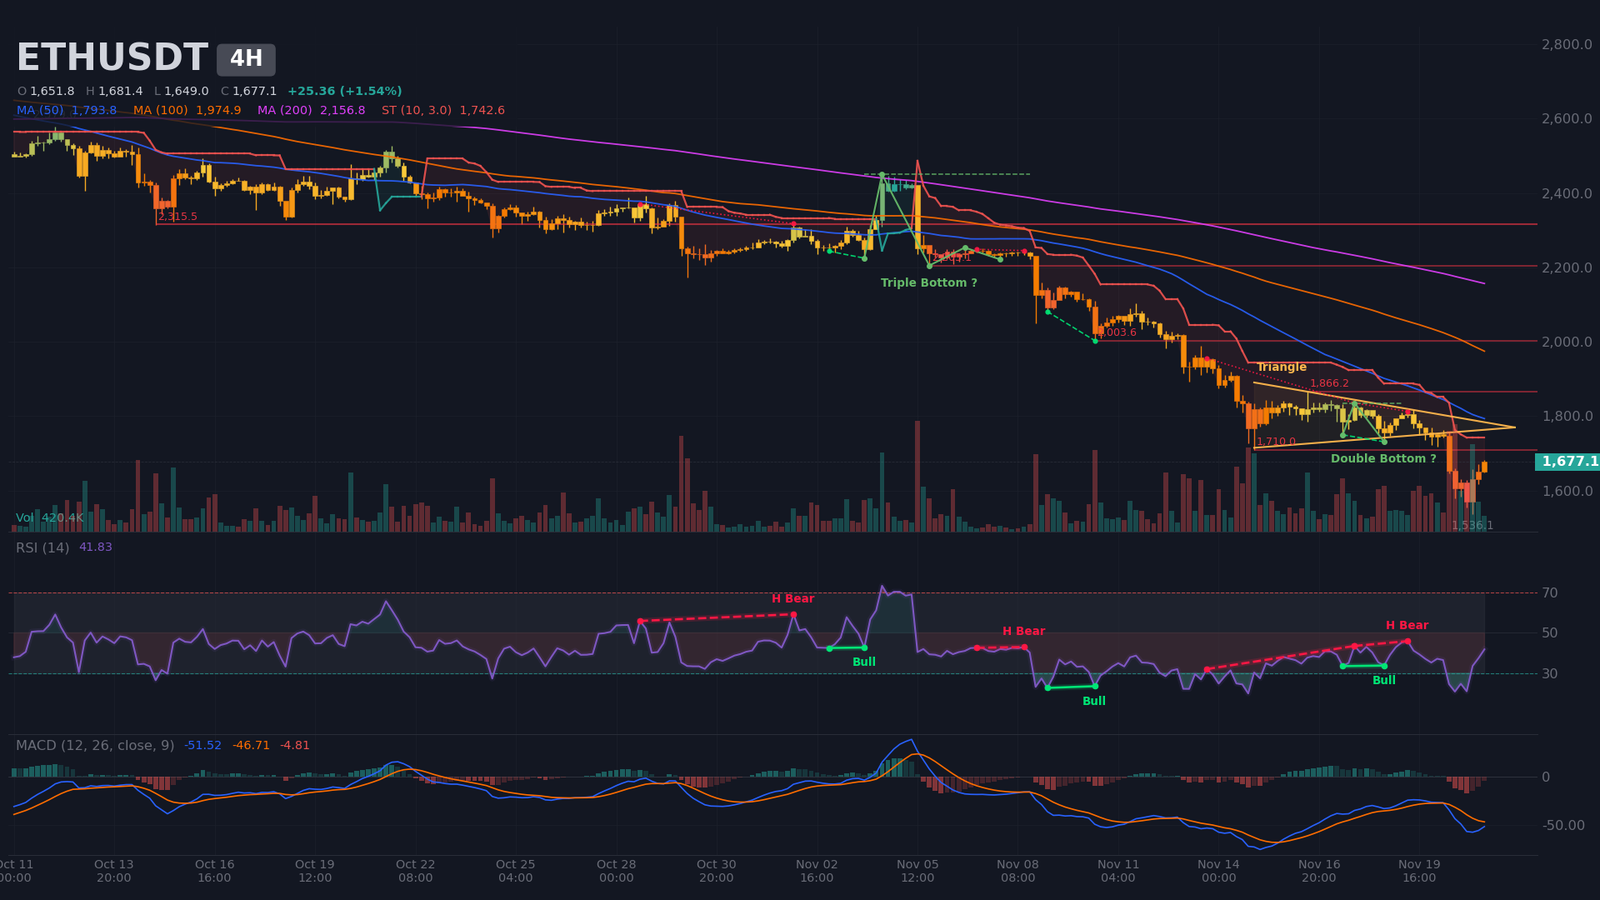
The 4H structure remains bearish, with lower highs and lower lows. The symmetrical triangle bounded by $1,817 and $1,749 was broken to the downside during the November 20 acceleration. The regime is a strong trend: ADX 51 and expanding bands (rank 97). Price sits below the 4H 20-period SMA ($1,724), the 50-period ($1,794) and the 200-period ($2,157), and the 4H SuperTrend is bearish at $1,743.
4H RSI at 42 is neutral and climbing out of oversold territory. MACD has been in a bearish crossover since November 20, below zero, but the histogram is contracting, a sign that selling pressure is slowing. Hidden bearish divergences, which signal continuation, point in the direction of the trend. The 4H double bottom (neckline $1,835, target $1,930) is not confirmed; it is a hypothesis, and price is far from it. On the recent swing from $2,103.6 to $1,536.1, the 23.6% retracement ($1,670) was only just cleared. The 38.2% level ($1,753) is the next hurdle and coincides with R1. The last completed 4H candle carries only 73% of average volume: the rebound is not driven by buyers.
Intraday Structure (15m): Higher Highs and Higher Lows
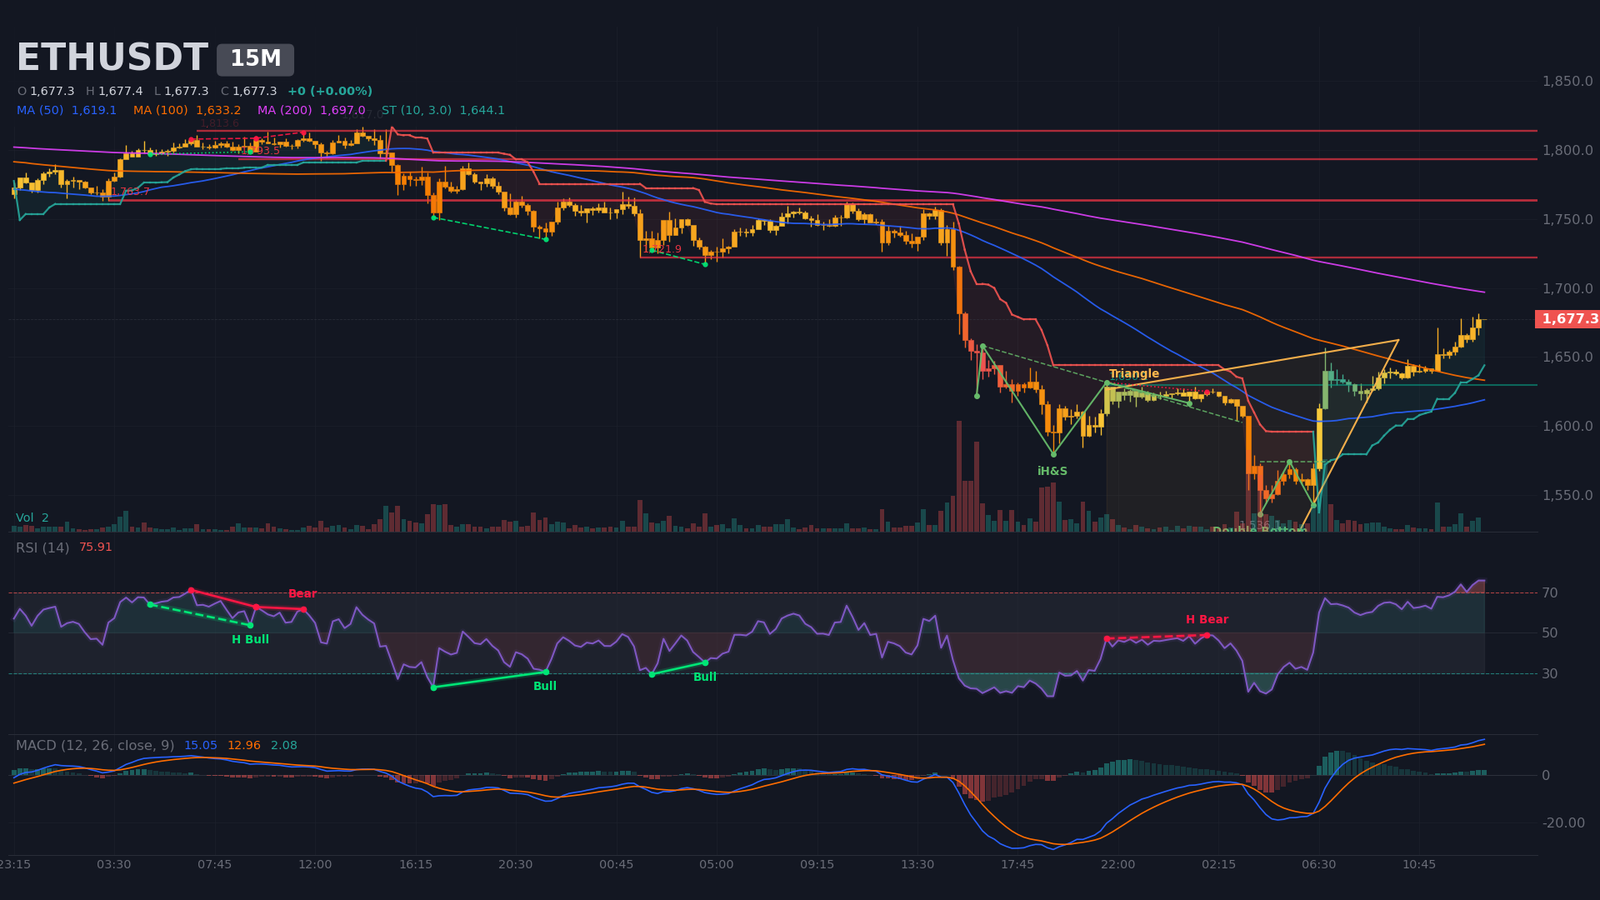
On the 15-minute chart, structure is bullish, with ADX at 50, DI+ dominant and a bullish SuperTrend at $1,644. RSI at ~76 signals overbought conditions, and price touches 98% of the upper Bollinger Band. The confirmed double bottom (target $1,610) and the inverse head-and-shoulders (neckline $1,632, target $1,677) have been reached, and the ascending triangle between $1,617 and $1,658 resolved to the upside.
Useful levels sit at $1,630 below (two-touch support, with a volume point of control (POC) at $1,627) and $1,722 above (three-touch resistance), then $1,764 at four touches. This 9% bounce remains a counter-trend move: a short-term trigger, not a change of bias.
Multi-Timeframe Summary
| Timeframe | Dominant trend | RSI (14) | MACD | Chart pattern |
|---|---|---|---|---|
| Daily (1D) | Bearish (sell impulse in oversold territory) | ~25 | Bearish crossover below zero, histogram expanding | Trend below the 78.6% Fibonacci |
| 4 hours (4H) | Bearish (lower highs and lower lows) | ~42 | Bearish crossover, histogram contracting | Symmetrical triangle broken to the downside |
| 15 minutes (15m) | Bullish (rebound) | ~76 | Bullish crossover above zero | Double bottom and inverse H&S targets reached |
The two longer timeframes point down and the short one points up; this divergence in time horizons underpins the central scenario.
Map of Technical Levels and Pivots
The method combines daily and weekly pivots, Fibonacci retracements of the daily and 4H impulses, 4H moving averages, volume nodes, order-book walls and estimated liquidation zones. The short-term central pivot, between $1,655 and $1,680, is where price currently sits. The rebound’s pivot zone, between $1,780 and $1,795, combines the 78.6% retracement of the major impulse, the 4H 23.6% retracement, the 4H SMA50 and an M15 resistance: this is where the structure’s recovery will be tested.
| Level | Price (USD) | Category | Technical basis |
|---|---|---|---|
| Major resistance 3 (R3) | $1,845 – $1,905 | Resistance (Daily/H4) | R2 pivot ($1,847), 4H resistance ($1,866), estimated short pockets ($1,851–$1,865 and $1,883–$1,892), volume node ($1,897), weekly pivot P ($1,901) |
| Major resistance 2 (R2) | $1,780 – $1,795 | Resistance (Daily/H4) | Daily 78.6% Fib ($1,782), 4H 23.6% Fib ($1,782), 4H SMA50 ($1,794), M15 resistance ($1,794) |
| Immediate resistance (R1) | $1,720 – $1,765 | Resistance | M15 three-touch resistance ($1,722), 4H SMA20 ($1,724), R1 pivot ($1,735), sell wall ($1,748), daily volume node ($1,761), M15 four-touch resistance ($1,764) |
| Central pivot (P) | $1,655 – $1,680 | Pivot | Daily pivot ($1,657), recent 4H 23.6% Fib ($1,670), M15 50% Fib ($1,677), order walls ($1,670–$1,680) |
| Immediate support (S1) | $1,625 – $1,645 | Support | Weekly S1 pivot ($1,643), M15 SuperTrend ($1,644), M15 support ($1,630), inverse H&S neckline ($1,632), M15 POC ($1,627) |
| Major support 2 (S2) | $1,535 – $1,580 | Support (Daily/H4) | November 21 low ($1,536), S1 pivot ($1,545), estimated long pocket ($1,572–$1,577), M15 double-bottom neckline ($1,575) |
| Major support 3 (S3) | $1,500 – $1,510 | Support (Daily) | June 6 low ($1,503.6), daily two-touch support ($1,507) |
Order Book and Liquidity Heatmap
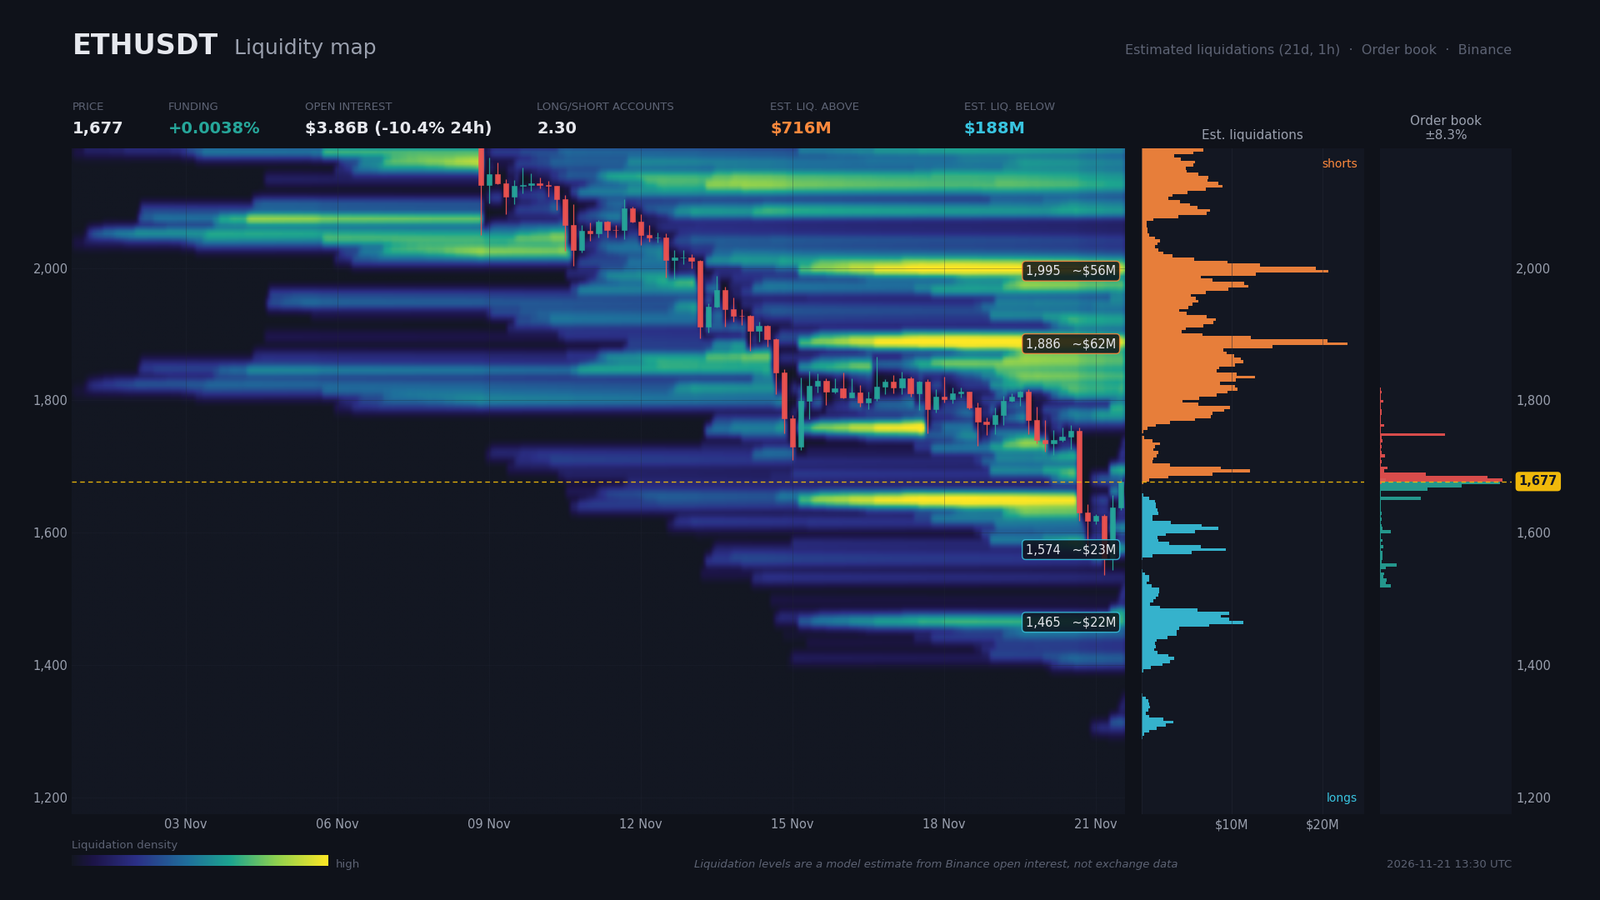
The Binance order book (perpetual and spot) is only visible across about 8% around price. Within 2% of the price, buy orders ($43.5M) and sell orders ($42.5M) are balanced, with an imbalance of 1.2%. Sell walls sit at $1,680 ($18M), $1,684 ($15.8M), $1,689 ($6.7M) and $1,748 ($9.5M, or +4.2%); buy walls at $1,675 ($17.7M), $1,671 ($12M), $1,666 ($6.9M) and $1,652 ($5.9M). Price is therefore squeezed between two very close walls, and the immediate ceiling is thin above $1,690.
Estimated liquidation zones (a model based on open interest, not a measured figure) are asymmetric. Above price, roughly $716M of shorts cluster near $1,853 ($36M), $1,886 ($62M) and $1,995 ($56M); below, about $188M of longs sit near $1,574 ($23M), $1,478 ($19M) and $1,465 ($22M). A rebound toward $1,850–$1,890 would therefore act as a magnet and could trigger a short squeeze.
Funding is slightly positive (0.0038%, or 4.2% annualized) and open interest stands at $3.86B (−10.4% over 24 hours, −12.7% over seven days). Accounts remain mostly long, with a global long/short ratio of 2.30 and a top-trader position ratio of 1.64; the taker buy/sell ratio of 0.95 confirms that longs persist despite the drop. This imbalance keeps a risk of a fresh liquidity sweep toward $1,575, then $1,465–$1,480.
Calendar: Catalysts to Watch
The PCE release on November 25, followed by the Deribit expiry on November 27, is the event most likely to pull Ethereum out of its current structure. Earlier, US retail sales (+0.6% against +0.4% expected) produced no clear market reaction in the sources.
- Tuesday, November 24, 16:00 (Zurich) — CB consumer confidence (consensus 92.5, previous 91.7): a read on domestic demand that will shape the Fed’s tone.
- Wednesday, November 25, 14:30 (Zurich) — core PCE m/m (consensus +0.3%, previous +0.4%) and personal spending (consensus +0.4%, previous +0.5%): the key inflation gauge for the Fed and a direct test of the December hike case.
- Wednesday, November 25, 14:30 (Zurich) — preliminary US GDP (consensus 2.3%, previous 6.4%): growth data that will show whether the economy is absorbing higher rates.
- Friday, November 27, 09:00 (Zurich) — monthly BTC and ETH options expiry on Deribit: volatility risk and price magnetism around strikes.
- Friday, November 27, 16:00 (Zurich) — CME monthly futures settlement: additional pressure around settlement levels.
- Tuesday, December 1, 11:00 (Zurich) — euro area flash core inflation (previous 2.5%): a further signal for global rate expectations.
Three Scenarios for the Coming Weeks
The three scenarios cover a one- to two-week horizon. Their probabilities, which total 100%, reflect the relative weight of the bearish structure, oversold conditions and liquidation pockets.
Scenario A — Capped Rebound Below $1,795, Bearish Resumption (probability 45%)
The trigger is a rejection in the R1 zone between $1,745 and $1,765, confirmed by a 4H close below $1,745. The path returns price to immediate support S1 ($1,625–$1,645), then to S2 near $1,575. A 4H close below $1,535 would open S3 ($1,500–$1,510), then the estimated long pockets between $1,465 and $1,480. Risk-reward (R:R) is about 3.3: ($1,755 − $1,575) ÷ ($1,810 − $1,755) = 180 ÷ 55. Execution zone: $1,745–$1,765 (reference entry $1,755). Invalidation: 4H close above $1,810, beyond the 4H SMA50 and R2; the stop sits $55 from entry, more than the 4H ATR ($52).
Scenario B — Bullish Liquidity Sweep Toward Estimated Shorts (probability 35%)
The trigger is a 4H close above $1,795, with a reference entry at $1,800. The natural target is $1,885, the peak of the estimated $62M short pocket, where a short squeeze could unfold. R:R is about 1.55: ($1,885 − $1,800) ÷ ($1,800 − $1,745) = 85 ÷ 55. After such a sweep, a rejection below $1,960 would remain consistent with the bearish bias. This scenario keeps significant weight because of the $716M of estimated shorts above price and daily oversold conditions. Execution zone: $1,795–$1,805. Invalidation: 4H close below $1,745, at the lower bound of the 4H triangle ($1,749) and the $1,748 sell wall.
Scenario C — Bullish Reversal (probability 20%)
The trigger is a daily close above $1,960, which would invalidate the bearish thesis. Successive targets are $2,000–$2,015, where the daily 20-day SMA ($2,003), a short pocket of $1,993–$2,002 and the 38.2% Fibonacci of the recent impulse ($2,014) overlap, then $2,155–$2,162 with the major and recent 50% Fibonacci levels. Execution zone: $1,960–$1,970. Invalidation: daily close below $1,830, the 23.6% Fibonacci of the recent impulse ($1,831.5); the stop sits about $135 from entry, more than the daily ATR ($113).
The signal to watch: a 4H close above $1,795 shifts scenario A toward B, then a daily close above $1,960 shifts it toward C. Conversely, a clear rejection below $1,745 would confirm the resumption of the bearish structure.
Summary and Conclusion
The phase is a late-stage sell impulse, with a likely capitulation on November 20 (volume at 228% of average). The intraday rebound comes from a leverage purge and extreme sentiment, but flows have not turned: record outflows from Bitcoin ETFs, capital rotating toward AI, and a Fed in tightening mode. The rebound is therefore not confirmed as a reversal, and the daily chart has not yet reclaimed its resistances.
The dominant technical strategy is to sell rallies into the $1,720–$1,795 zone rather than chase the oversold decline. Protection sits above $1,810 on the 4H for the short term, and above $1,960 on the daily for the overall thesis. Key levels: $1,780–$1,795 (rebound pivot zone), $1,625–$1,645 (intraday support), $1,535–$1,580 (November 21 low and estimated long pocket), $1,500–$1,510 (June low) and $1,960 (daily invalidation).
Sources
- Cathie Wood Bets $91M on Anthropic IPO While Paring Crypto Exposure — Decrypt, 20/11/2026
- Bitcoin Breaks Below $60K as Crypto Fear Index Hits Worst Level Since February — Decrypt, 20/11/2026
- Bitcoin suffered identical sell-off pattern ahead of Anthropic, SpaceX IPOs — CNBC, 20/11/2026
- Bitcoin Price Slips Near $58,300 As Nasdaq Falls 5% — Bitcoin Magazine, 20/11/2026
- Binance hacker moves nearly $600M in ETH, routes funds through THORChain, Chainflip — Cointelegraph, 20/11/2026
- Ethereum’s Glamsterdam upgrade could slip to May 2027 over compatibility concerns — Cointelegraph, 19/11/2026
- Japan core inflation soars to highest this year — CNBC, 20/11/2026
- The Fed is too busy fighting inflation to rescue the stock market — MarketWatch, 20/11/2026
- Bitcoin clears its largest liquidation cluster between $59K and $62K — Crypto Briefing, 21/11/2026
- Ethereum Futures Open Interest Hits a Two-Year Low — E8 Markets, 18/11/2026
- Adviser and Regulated Fund Custody Rules; Crypto Custody Rules — SEC.gov, 12/10/2026
- Agenda économique et données de carnet d’ordres et de dérivés (liquidations estimées) — données fournies, 21/11/2026
Disclaimer: This article is for educational and informational purposes only. It does not constitute investment advice, a recommendation to buy or sell, or an invitation to trade any financial asset. Cryptocurrency markets are extremely volatile; any investment decision should be based on your own research (DYOR) and, where appropriate, the advice of a licensed financial adviser.

