


Bitcoin is trading at $74,763 on November 10, 2026, 14.4% below the period high of $87,385 reached on October 2 and 29.4% above the period low of $57,759. The price has shed 11% over the last 20 sessions, moving through a distribution phase followed by a corrective impulse. The most recent significant low sits at $73,333, touched on November 8, less than 2% below the current price.
The immediate driver remains the stress left by the October 29 Binance hack, which Cointelegraph (November 10) describes as a record. Binance says it has restored roughly 98% of the affected tokens and will absorb the losses, but distrust lingers: North Korea-linked hackers are reportedly laundering part of the proceeds through memecoins on NEAR, according to Bitcoin Magazine (November 9). On the flow side, US spot Bitcoin ETFs show $415.9M in cumulative net outflows for 2026 (Bloomingbit, November 6, citing Cointelegraph). MARA sold 13,597 BTC, roughly $1.1B, to repay $750M in loans (The Block, November 9). HIVE’s average quarterly BTC price of $71,003 compares with $114,382 a year earlier (Cointelegraph, November 10). Mercado Bitcoin, which suffered a theft estimated at $49M on November 2, has still not set a date for resuming withdrawals (Cointelegraph, November 9).
The macro picture is more mixed. October’s nonfarm payrolls came in at 165,000 against a consensus of 65,000 according to the calendar (59,000 according to CNBC), with unemployment at 4.1% versus 4.2% expected and average hourly earnings up 0.4%. On November 6, Bitcoin swung between $74,800 and $76,400 and closed near $75,800 without a lasting reaction. Equities rebounded on November 9 (Nasdaq +2.2%, S&P 500 +1.9%, per Decrypt), and Bitcoin retested an 11-week low near $73,500 before reclaiming $75,000. On the geopolitical front, Donald Trump says the war with Iran could end «fairly soon», and oil eased accordingly: WTI fell to $85.8 and Brent to $91.56 (CNBC, November 10). Marco Rubio, however, has described stalled negotiations (CryptoPotato, November 10). In China, October’s annual CPI came in at 0.7% and PPI at 5.7% (Reuters, November 9). On the regulatory side, the OCC gave final approval to Coinbase National Trust Company on November 6, while the SEC proposed a crypto asset custody framework with a 60-day comment period opened after its Federal Register publication on October 6.
None of this settles the question on its own. ETF outflows, miner selling and post-hack distrust moderately support the bearish bias, while the equity rebound and the oil pullback soften it in the short term. The technical structure has to be read against that backdrop: a market caught between nearby resistance and a long-term moving average.
Multi-Timeframe Technical Analysis
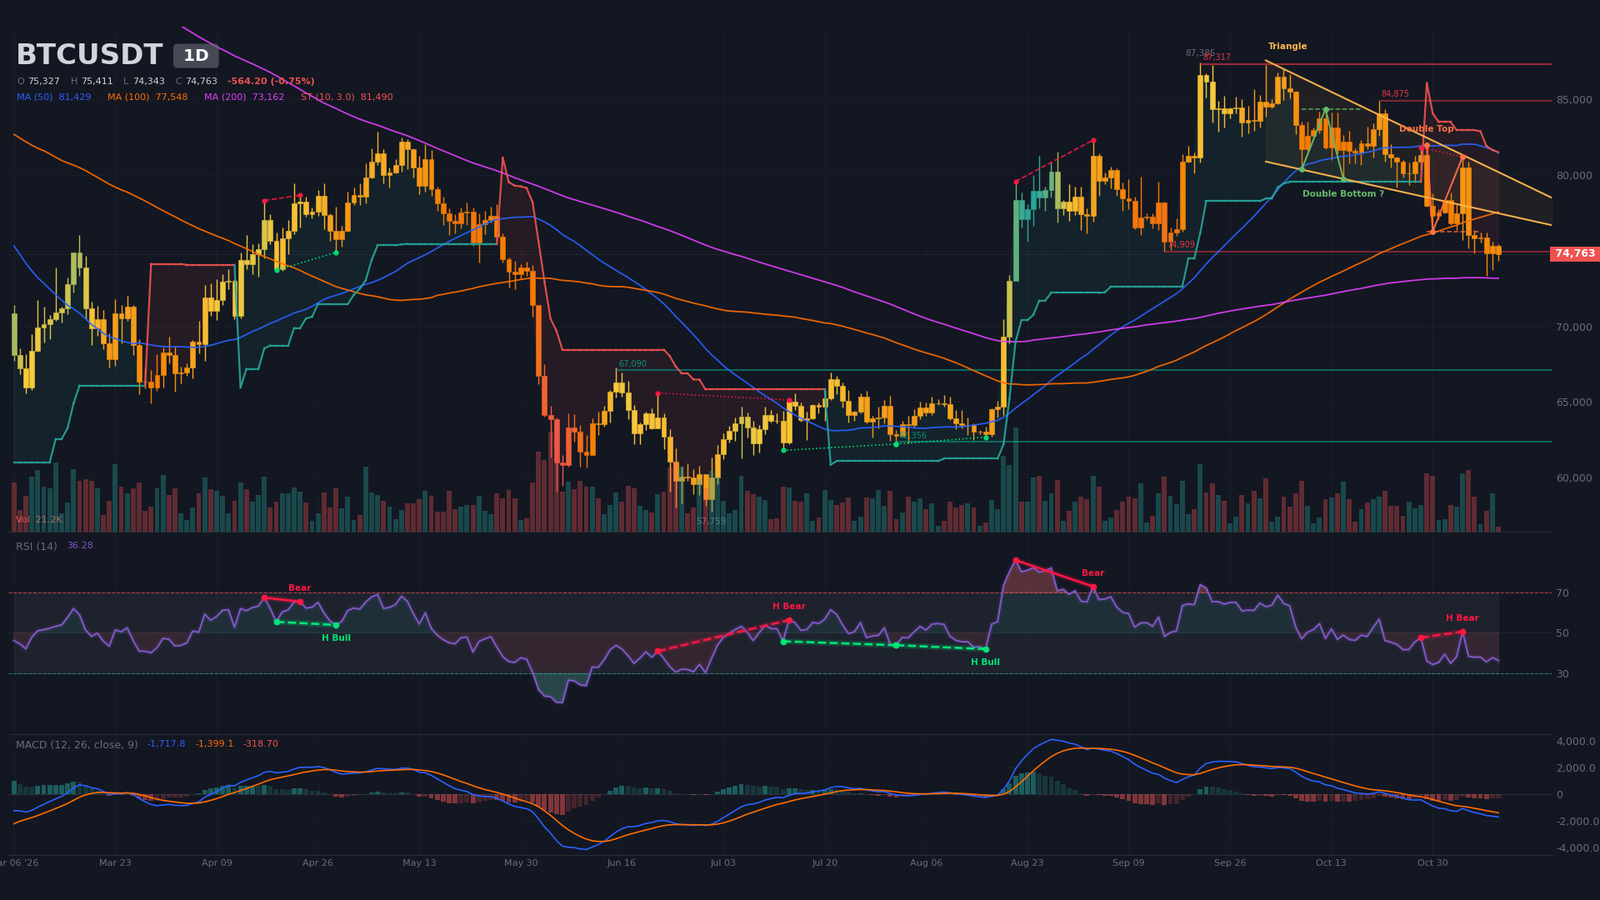
Daily Timeframe (1D): Double Top Confirmed Below the 50-Day Average
The dominant trend is bearish, with descending highs: $87,250 on October 2, $84,880 on October 21, $81,950 on October 29 and $81,190 on November 4. Lows follow the same slope, from $79,180 (October 24) to $76,270 (October 30), then $73,333 (November 8). Price trades below the 20-day average (about $78,200) and the 50-day average (about $81,400), just above the 200-day average (about $73,200). No 50/200 crossover has been detected, and the SuperTrend remains bearish at $81,490.
The dominant pattern is a confirmed double top: the neckline sits at $76,270, with a measured objective of $70,970, and price trades below that line. The detected wedge, bounded between $77,980 and $81,310, has broken to the downside. A bullish double bottom (neckline $84,340, objective $88,640) remains an unconfirmed and distant hypothesis. The RSI (relative strength index) reads about 36, a weak zone without a clear oversold signal, after failing at 51 on November 4. A hidden bearish divergence between October 28 and November 4 (price $81,800 to $81,190, RSI 48 to 51) points to continuation. The MACD sits below its signal line and below zero, with a bearish crossover dated September 29 (42 candles ago) and a negative histogram. Volume on the current candle, at 15% of its 20-period average, is provisional and not usable. Finally, the daily pivot (about $74,870) coincides with the current price.
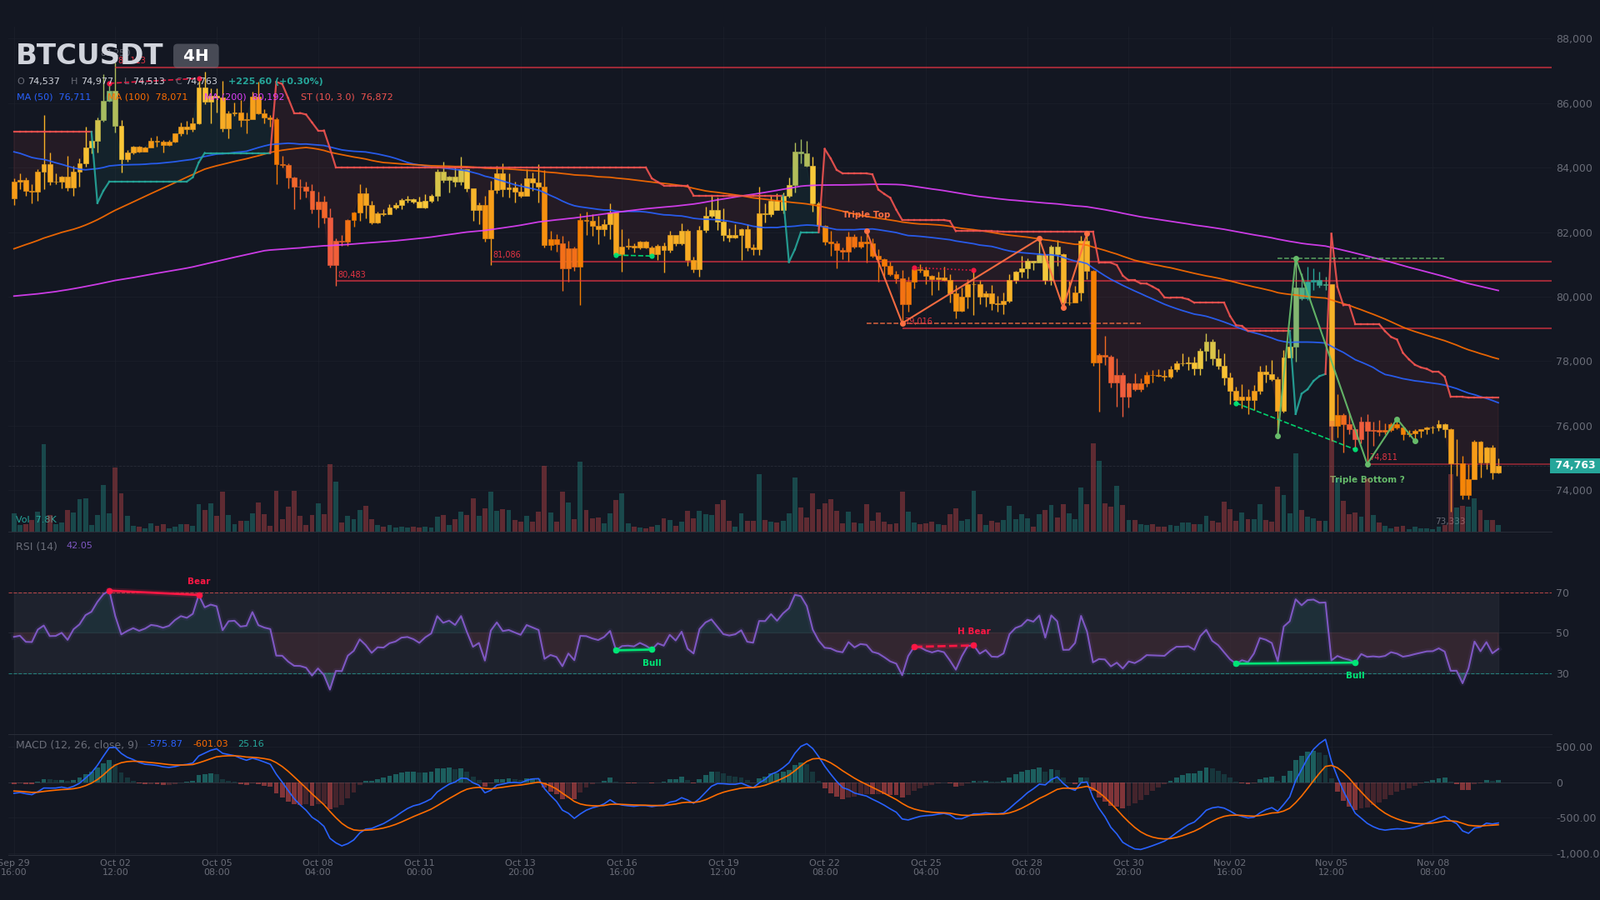
Intermediate Dynamics (4H): Weak Bullish Divergence Within a Bearish Structure
4H highs remain descending ($81,190, $76,350, $76,210, $76,170, $75,550), but the November 9 low at $73,715 sits above the November 8 low at $73,333, the first nuance in the structure. Price trades below the 20-period average (about $75,390), the 50-period average (about $76,710) and the 200-period average (about $80,190), and the SuperTrend is bearish at $76,870. The bearish triple top (neckline $79,180, objective $76,430) is confirmed, and its objective has been reached.
A regular bullish divergence appears between November 2 and November 6: price fell from $76,700 to $75,260 while the RSI held at 35. The signal is recent but weak, since the RSI now reads 42 after dropping to 25 during the flush. The 4H MACD crossed above its signal line on November 9 at 20:00, with a slightly positive histogram still below zero. A triple bottom flagged at $81,190, with an objective of $87,030, remains an unconfirmed hypothesis. Volume is at 50% of its average, with no sign of capitulation.
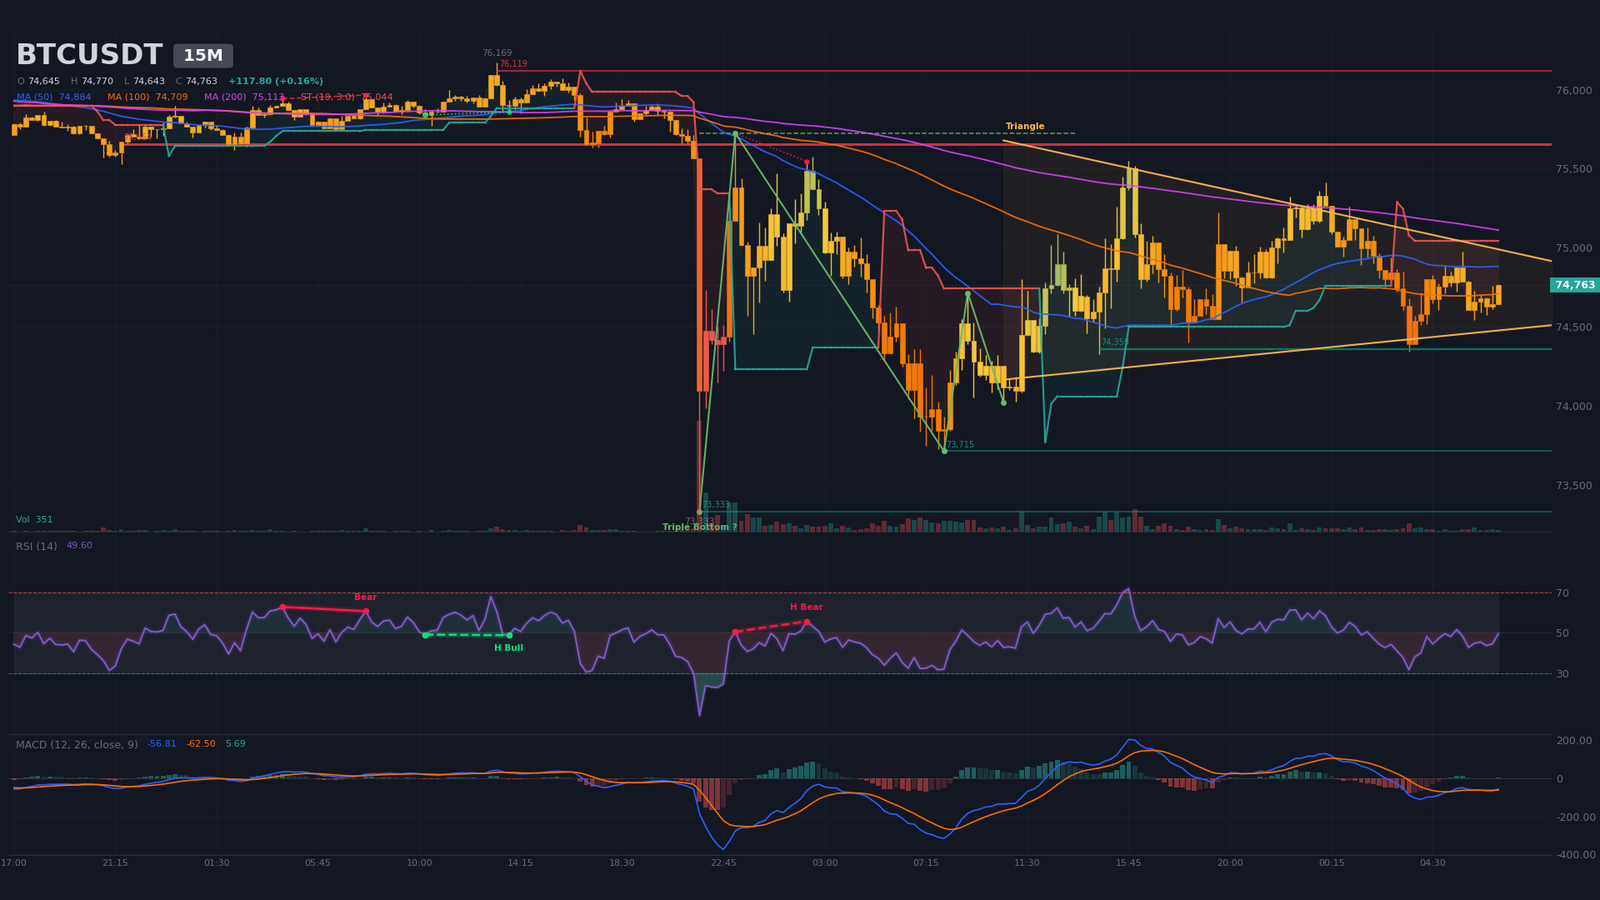
Intraday Structure (15m): Symmetrical Triangle in Compression
A symmetrical triangle began on November 9 at 10:30, with an upper boundary near $75,040 and a lower boundary near $74,460. Its apex is estimated for November 10 at 17:54, which implies a fast resolution. Support at $74,360 (3 contacts) held at 03:30 this morning, while resistance at $75,650 (12 contacts) and $76,120 bound the upper zone. Price, at $74,763, sits above the 20-period average (about $74,700) and below the 50- and 200-period averages (about $74,880 and $75,110), and the SuperTrend is bearish at $75,040. The RSI is neutral near 50, the MACD has just crossed up at 07:15 without confirmation, and volume at 50% of its average is typical of compression. A 15-minute close outside the $74,460 to $75,040 range would set the direction. An intraday triple bottom (neckline $75,720, objective $77,760) remains unconfirmed. With a 15-minute ATR of about $170, intraday stops below $170 should be ruled out.
Multi-Timeframe Synthesis
| Timeframe | Dominant trend | RSI (14) | MACD | Chart pattern |
|---|---|---|---|---|
| Daily (1D) | Bearish (correction below 50-day average) | ~36 | Bearish crossover on Sept 29, below zero | Confirmed double top (obj. $70,970) |
| 4 hours (4H) | Bearish with higher lows | ~42 | Bullish crossover on Nov 9, below zero | Regular bullish divergence (rebound hypothesis) |
| 15 minutes | Neutral (compression) | ~50 | Bullish crossover on Nov 10, unconfirmed | Symmetrical triangle |
Confluence scores 3 out of 5: the bearish bias is consistent on the daily and 4H charts, while a technical rebound remains possible on the 4H and 15m charts, but without confirmation.
Level Map: Technical Levels and Pivots
The method combines classic daily pivots, support and resistance levels ranked by number of contacts, dated swings, neckline and pattern objectives, order book walls and estimated liquidation pockets. No Fibonacci extension is drawn, since the reference impulse from $57,759 is not dated in the swings provided. The short-term central pivot sits near $74,900.
| Level | Price (USD) | Category | Technical basis |
|---|---|---|---|
| Major resistance 3 (R3) | $81,100 – $81,500 | Structural resistance | 4H resistance at $81,087, Nov 4 swing ($81,188), daily 50-day average, daily SuperTrend |
| Major resistance 2 (R2) | $78,500 – $79,200 | Resistance / liquidity | Estimated short pocket $78,463–$78,886, 4H triple top neckline ($79,179) |
| Immediate resistance (R1) | $75,650 – $76,300 | Resistance | 15m at $75,654 (12 contacts), daily R1, daily double top neckline ($76,270) |
| Central pivot (P) | $74,700 – $74,900 | Pivot | Daily pivot $74,872, daily resistance $74,909, walls at $74,710 and $74,816 |
| Immediate support (S1) | $73,700 – $74,400 | Support | 15m support $74,359 (3 contacts), Nov 9 low ($73,715), daily S1 |
| Major support 2 (S2) | $72,000 – $73,300 | Support / liquidity | Nov 8 low ($73,333), daily 200-day average (about $73,160), estimated long pockets $72,014–$73,283 |
| Major support 3 (S3) | $70,900 – $71,000 | Pattern objective | Daily double top objective ($70,969) |
Order Book and Liquidity Heatmap
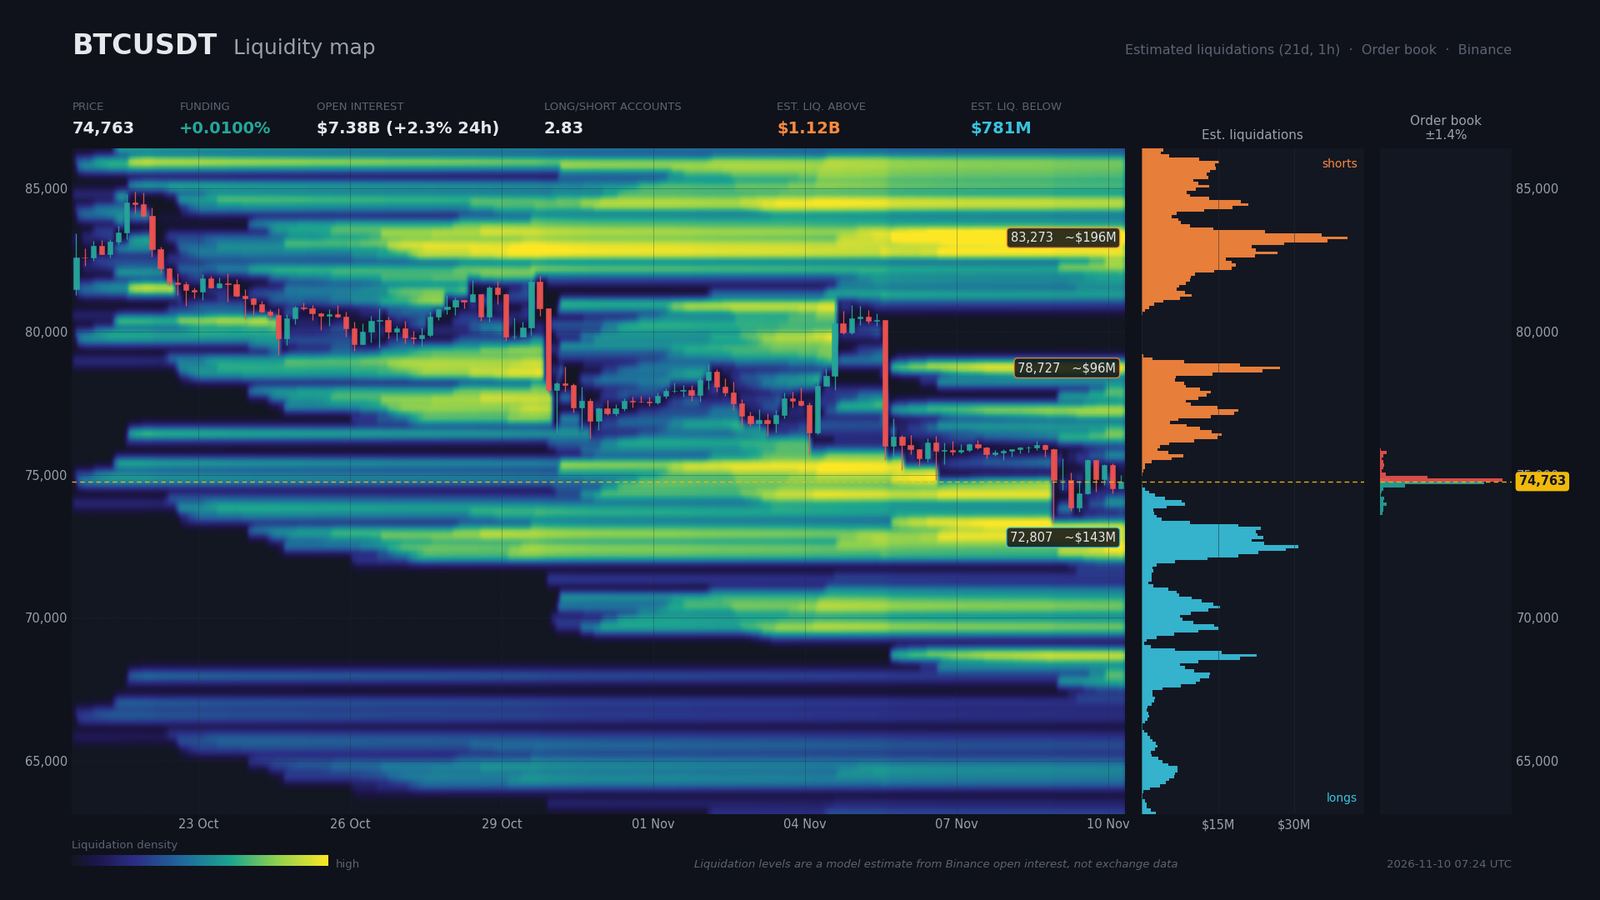
Real order book coverage is only 1.45% around the price, so the walls must be read with caution. On the sell side, $43.4M is displayed at $74,816 (+0.07%), $16.7M at $74,922, then $2.1M at $75,027 and $2.4M at $75,767. On the buy side, $37.1M sits at $74,710 (-0.07%), $8.7M at $74,604, $1.4M at $74,181 and $2.4M at $73,970. The 2% depth imbalance stands at -9.1% ($58.4M of bids against $70.1M of asks), a slight edge to sellers, although walls of this kind can be pulled before they are reached.
Estimated liquidation zones, drawn from a model based on open interest changes rather than measured data, sit on both sides. Above the price, short exposure totals roughly $96M between $78,460 and $78,890 (+5.3%), roughly $196M between $82,900 and $83,540 (+11.4%) and roughly $83M between $84,170 and $84,590, for about $1.12B in total. Below the price, long exposure weighs roughly $143M between $72,650 and $73,280 (-2.6%), roughly $130M between $72,010 and $72,540 (-3.0%) and roughly $68M between $68,530 and $68,840 (-8.1%), for about $781M in total. Funding is neutral to slightly positive at 0.01% (10.9% annualized), open interest reaches $7.38B (+2.3% over 24 hours, -3.6% over 7 days), the account long/short ratio is 2.83 and the top traders’ ratio is 2.35, with a taker buy/sell ratio of 1.04.
This clearly long positioning, combined with open interest rising over 24 hours, makes a liquidity sweep toward $72,000–$73,300 plausible, through a magnet effect. Conversely, a rebound toward $78,500 would require a strong macro catalyst, and a short squeeze is not favored while price stays below $76,300.
Calendar: Catalysts to Watch
This week’s calendar is dominated by US inflation. Recent releases, including the November 6 payrolls report, produced a mixed reaction in Bitcoin, while the BoE decision and Chinese export data left no identifiable trace. No Deribit options expiry or CME futures expiry is listed in the calendar provided.
- Tuesday, November 10, 10:00 (Zurich) — Waller speaks (FOMC): signal on the rate path ahead of the inflation print.
- Tuesday, November 10, 14:30 (Zurich) — US October CPI (core m/m consensus 0.2%, prior 0.3%; headline expected at 0.3% after 0.6%): a print above consensus would weigh on Bitcoin, a print below would support it.
- Friday, November 13, 14:30 (Zurich) — PPI core m/m (consensus 0.4%, prior 1.3%): the producer price channel will confirm or undercut the CPI scenario.
- Tuesday, November 17, 14:30 (Zurich) — retail sales ex autos (consensus 0.4%, prior 0.9%): a test of US consumer strength.
Three Scenarios for the Coming Weeks
Three paths emerge, weighted by the analyst. All of them hinge on Tuesday’s CPI, the first test of the 15m compression and of the $73,300 support.
Scenario A — Rejection Below $76,300 and Slide Toward the 200-Day Average (probability 50%)
Trigger: a hotter-than-expected CPI, with core above 0.2%, would reject the $75,650–$76,300 zone, followed by a 4H close below $73,700. The path leads to $73,300, then to the estimated long pocket at $72,000–$72,800, before the double top objective at $70,970. Execution zone: short on a rebound between $75,600 and $76,200. Invalidation: a 4H close above $77,000. The stop then represents $1,300, more than one 4H ATR ($873), with a R:R of about 2.2 toward $72,800 and 3.6 toward $70,970.
Scenario B — Liquidity Sweep Followed by a Technical Rebound (probability 30%)
Trigger: a CPI in line or below, or a de-escalation with Iran. A wick below $73,333 toward $72,500–$73,000, inside the estimated long pocket, followed by a 4H close above $74,400, would validate this scenario, with the 4H bullish divergence supporting the reading. The path leads to $74,900, then $75,650 and $76,300. Execution zone: long between $72,700 and $73,300, stop below $71,900 ($1,000, more than one 4H ATR). Invalidation: a 4H close below $71,900.
Scenario C — Bullish Invalidation (probability 20%)
Trigger: a clearly softer CPI and a continued equity rebound, with a daily close above $76,300, which would cancel the double top neckline. The path targets $78,500–$79,200, the estimated short pocket and the 4H triple top neckline, then $81,100–$81,500. Execution zone: long on a retest between $76,300 and $76,600, stop below $75,500 (about one 4H ATR). Invalidation: a 4H close back below $75,600. Above $81,500, the 4H triple bottom hypothesis, with an objective of $87,030, would become credible.
Synthesis and Conclusion
The market is in a correction after distribution: lower highs and lower lows, a confirmed double top, and a price caught between nearby resistance ($75,650–$76,300) and the daily 200-day average (about $73,200). Flows do not contradict this bias, between cumulative ETF outflows, MARA’s BTC sales and the lingering effects of the Binance hack. The estimated long pockets and the clearly long positioning favor a downside sweep before any lasting rebound, while the 4H bullish divergence remains an unconfirmed hypothesis.
The dominant technical stance is to favor selling rebounds below $76,300 and not to anticipate a reversal until a daily close above that level is secured. Reference protection sits at $77,000 for shorts and at $71,900 for rebound longs after a sweep. The critical levels to watch are $76,270, $74,900, $73,300, the $72,000–$72,800 zone and $70,970.
Sources
- HIVE, MARA Mine More Bitcoin as Mining Revenue Falls — Cointelegraph, November 10, 2026
- MARA posts $634 million Q3 net profit on bitcoin gains, sells 13,597 BTC to pay off loans — The Block, November 9, 2026
- Bitcoin in Limbo as Stocks Rebound Ahead of US Inflation Report — Decrypt, November 9, 2026
- Bitcoin, tech stocks brush off Nvidia nerves as analyst mulls $68K target — Cointelegraph, November 9, 2026
- Trump says Iran war to end ‘fairly soon,’ plays down prospects of new strikes — CNBC, November 10, 2026
- A key report for where inflation stood in October comes out Tuesday — CNBC, November 9, 2026
- 3 unexpected reasons the October jobs report was so strong — CNBC, November 9, 2026
- China’s factory-gate inflation gains momentum in October — Reuters, November 9, 2026
- CertiK Urges Crypto Exchanges to Cap Hot Wallet Holdings — Cointelegraph, November 10, 2026
- North Korea Is Minting Its Own Meme Coins to Launder Binance Hack Loot — Bitcoin Magazine, November 9, 2026
- Mercado Bitcoin begins post-hack reopening without a timeline for withdrawals — Cointelegraph, November 9, 2026
- US Spot Bitcoin ETFs Shift to Net Outflows in 2026, Totaling $415.9 Million — Bloomingbit, November 6, 2026
- Coinbase : l’OCC valide définitivement la Coinbase National Trust Company — Journal du Coin, November 10, 2026
- SEC proposes crypto asset custody framework for investment advisers and regulated funds — A&O Shearman, October 15, 2026
- Adviser and Regulated Fund Custody Rules; Crypto Custody Rules — SEC.gov, October 1, 2026
- Elizabeth Warren Vows Scrutiny of Prediction Markets and Trump Family Crypto Ventures — The Block, November 9, 2026
- XRP Faces More Downside Pressure? Binance CVD Reveals Sellers Are Still in Control — CryptoPotato, November 10, 2026
- Economic and crypto calendar (Zurich time), November 10, 2026
Disclaimer: This article is for educational and informational purposes only. It does not constitute investment advice, a recommendation to buy or sell, or an invitation to trade any financial asset. Cryptocurrency markets are extremely volatile; any investment decision should be based on your own research (DYOR) and, where appropriate, the advice of a licensed financial adviser.

