


Bitcoin trades at $75,822, 13.2% below its period high of $87,385 and just 1.4% above the $74,811 low printed on November 6. The price is coiling just above a support that has anchored the market for a week, in an orderly correction. The working read is bearish, with medium conviction and a confluence score of 3 out of 5.
The immediate driver is institutional flow. US spot bitcoin ETFs recorded $1.28B of net outflows over the week, the worst since late June, according to The Block (November 7). Cumulative 2026 flows have turned negative, at roughly $914M of net outflows, and IBIT alone accounted for $403M of withdrawals on Friday. On Thursday, November 6, outflows reached $430.2M according to Decrypt, as the Nasdaq Composite fell 5.5%. Bitcoin had cleared $80,000 on Wednesday, November 4, on short liquidations, then gave back the entire gain. ETFs hold $95.9B of BTC, or 6.3% of market capitalization, although cumulative figures differ across sources.
Macro conditions added pressure. October payrolls came in at 165,000 against 65,000 expected, with unemployment at 4.1% and wages up 0.4% month on month (Reuters and CNBC, November 6). The dollar and yields rose, and the price slipped back below $75,000 after the open on Wall Street. The Fed left rates at 3.75%–4.00% last week, yet CME FedWatch assigns a 76.8% probability to a 25-basis-point hike at the December 8–9 FOMC meeting (CNBC). JOLTS openings of 7.523 million (against 7.1 million expected), ISM services at 54.5 (against 54.8) and the University of Michigan sentiment index at 51 (against 48) completed a mixed picture, while the Bank of England lifted its rate to 4.00%, in line with consensus.
On the regulatory side, FinCEN cut MEXC off from the US financial system over alleged illicit flows of $16B. The measure only takes effect 30 days after publication in the Federal Register, which has not yet happened (Bitcoin Magazine). Russia opens retail trading in BTC, ETH and USDT on November 17, with a cap of 300,000 roubles a year per intermediary, or roughly $3,700 (Cointelegraph). The price impact of these items has not been demonstrated. What the macro and flow data do establish is a backdrop that supports the bearish technical signal, tempered by low funding and a falling open interest, which point to the absence of excess leverage.
Multi-Timeframe Technical Analysis
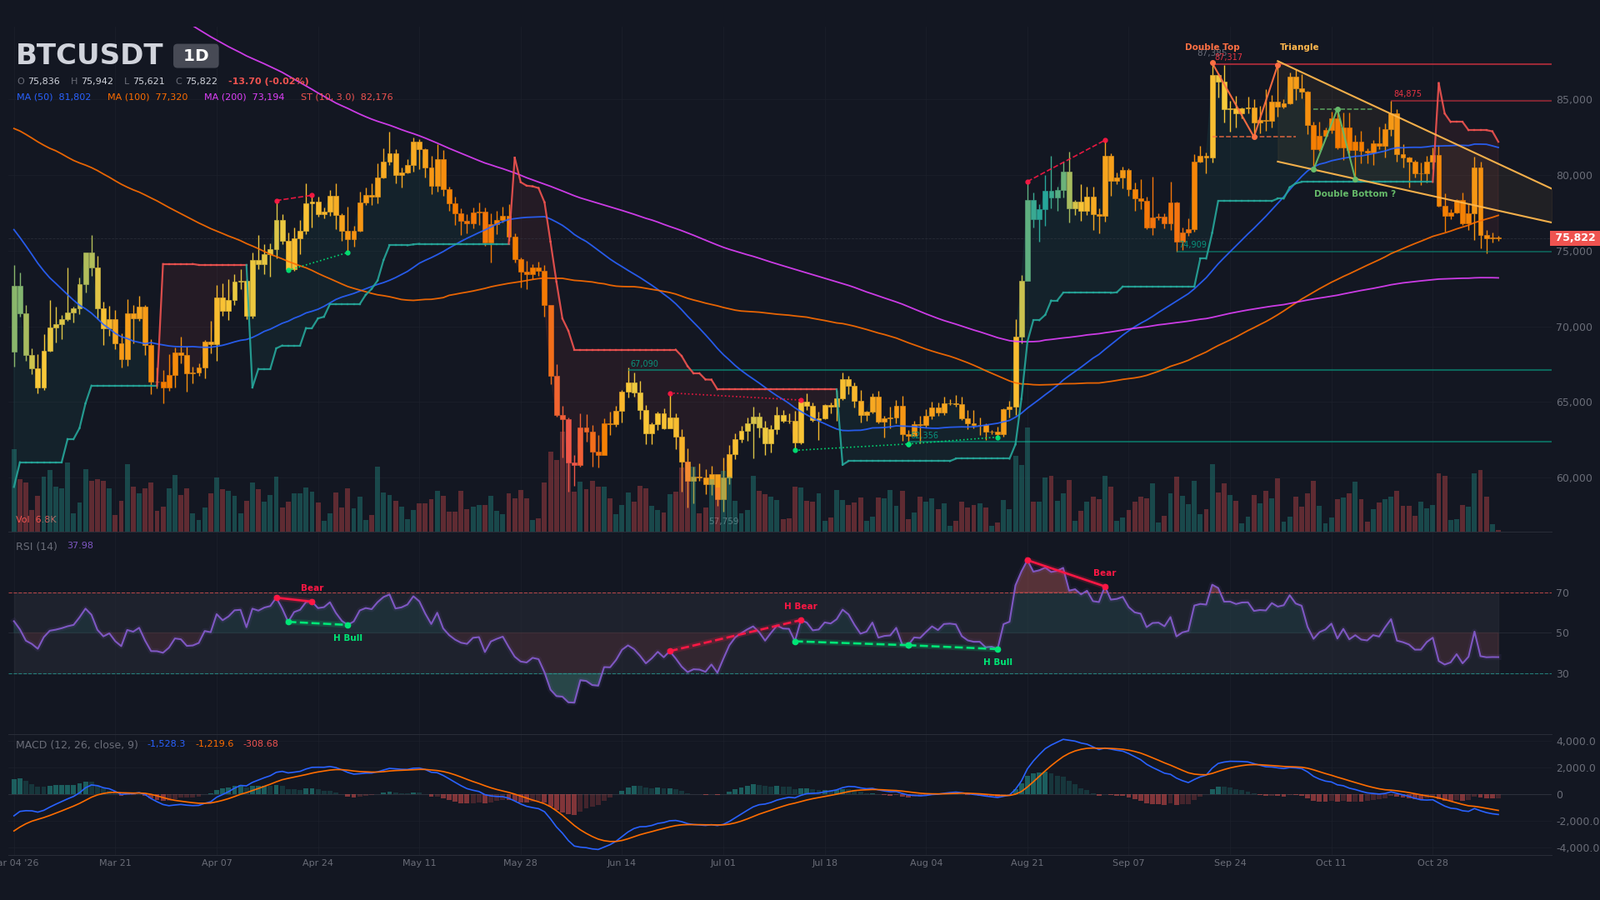
Daily Timeframe (1D): Confirmed Double Top Below the SMA50
The dominant trend is bearish. Lower highs at $87,250 on October 2, $84,340 on October 12, $81,954 on October 29 and $81,188 on November 4 are matched by lower lows at $80,345, $79,179 and $76,270, forming a descending channel. The double top, with a neckline at $82,500, is confirmed, and its $77,680 objective has already been exceeded. The wedge between $82,555 and $78,507 has broken to the downside. The bullish double bottom, with a neckline at $84,340 and an $88,640 target, is not confirmed and sits far from the current price.
Price remains below the SMA20 at $79,100 and the SMA50 at $81,800, but above the SMA200 at $73,200, the last line of defense for the long-term trend. No 50/200 crossover has been signaled. The bearish SuperTrend sits at $82,180. RSI at ~38 is neutral and close to oversold, with no recent divergence. MACD has been below zero and below its signal line since the bearish crossover on September 29, 40 candles ago, and its histogram is negative. Current-candle volume stands at 5% of its 20-period average and remains provisional. Supports sit at $74,900 (one touch) and $67,090 (two touches).
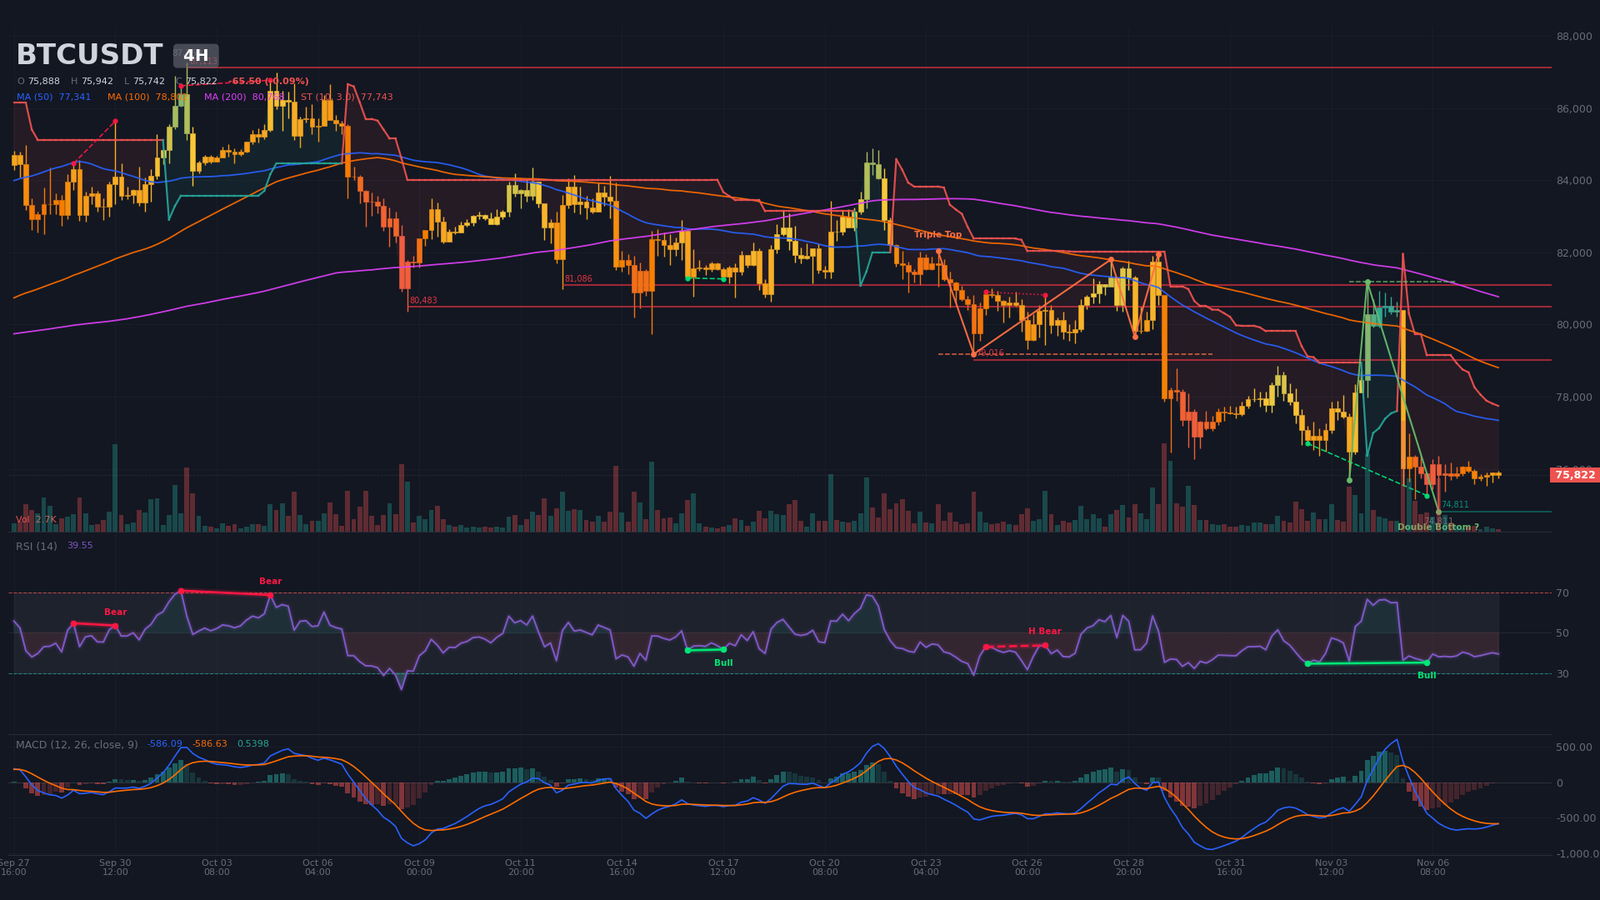
Intermediate Dynamics (4H): Triple Top Completed, Compression at the Lows
The 4H structure is even clearer. Highs at $81,954, $81,188 and $76,351 and lows at $76,270, $75,690, $75,158 and $74,811 are all declining. The triple top, with a neckline at $79,180, is confirmed, and its $76,430 objective has been filled. Price trades below the SMA20 ($76,580), the SMA50 ($77,340) and the SMA200 ($80,770), and the bearish SuperTrend stands at $77,740. A double bottom with a neckline at $81,190 and an $87,130 objective is detected but unconfirmed.
RSI at ~40 is neutral, but a regular bullish divergence appeared between November 2 and 6: price moved from $76,701 to $75,260 while RSI held at 35, a sign of seller exhaustion that still needs confirmation. MACD crossed up on November 8 at 04:00, still below zero, with a barely positive histogram, which makes it a weak signal. Resistances sit at $79,020, $80,480 and $81,090, immediate support at $74,810, and the 4H ATR is about $725.
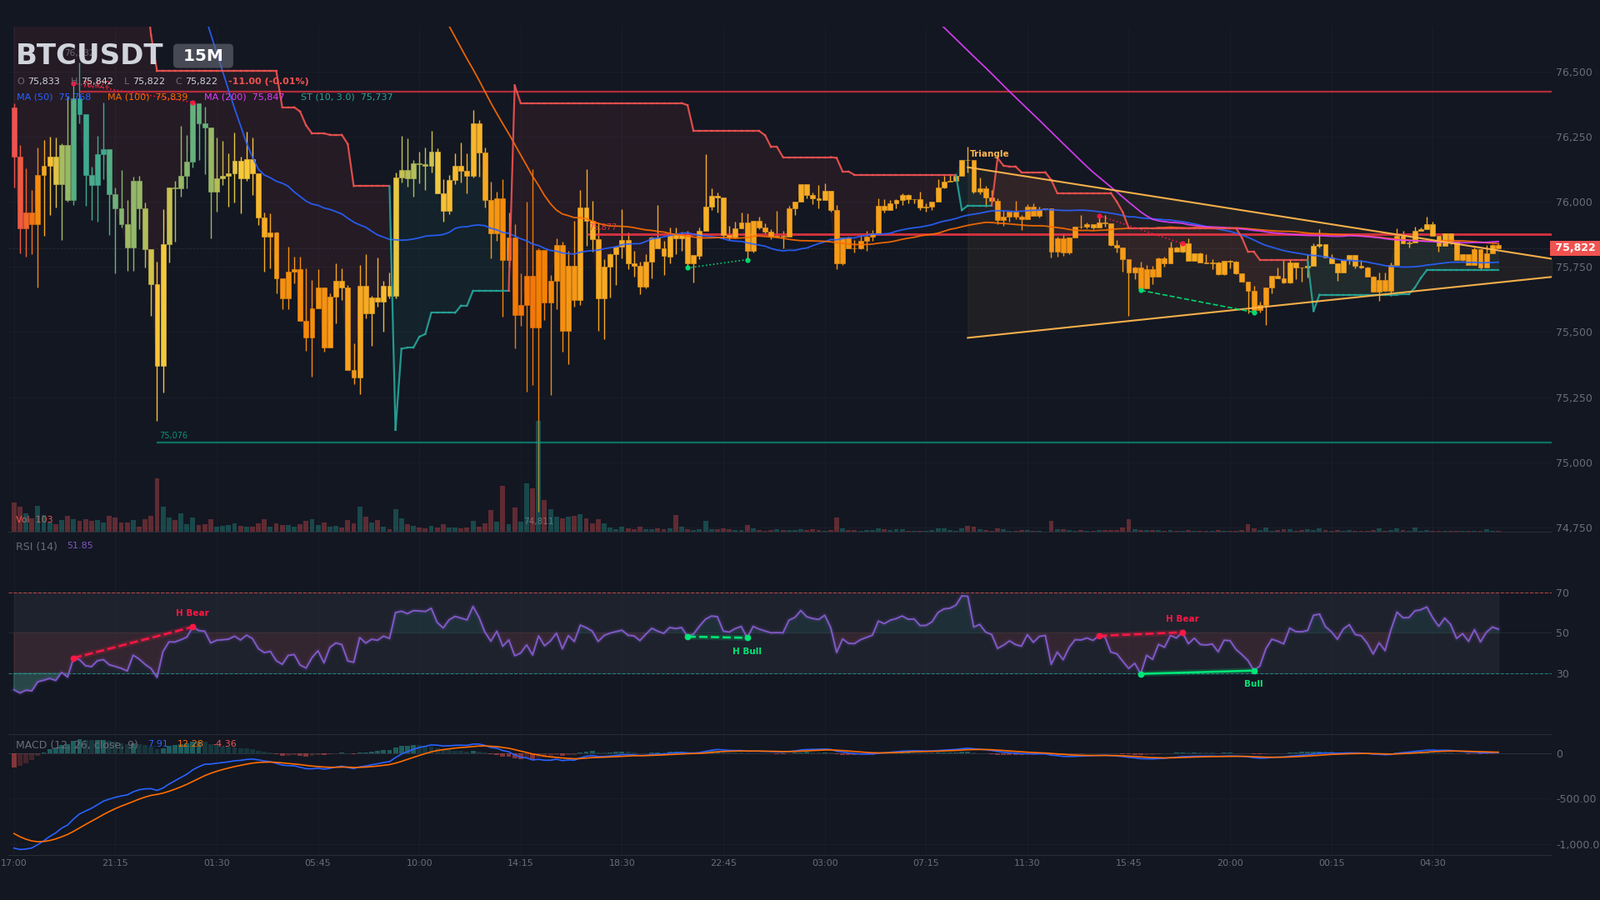
Intraday Structure (15m): Symmetrical Triangle Nearing Its Apex
The 15-minute chart is compressing. A symmetrical triangle bounds price between $75,856 and $75,662, with an apex estimated at 12:24. The $75,877 resistance, tested twelve times, acts as the lock, followed by $76,422, while support sits at $75,076 and the bullish M15 SuperTrend at $75,737. The SMA20, SMA50 and SMA200 are tangled between $75,770 and $75,850, which signals no short-term trend. RSI is near 52, and MACD, although above zero, shows a bearish crossover at 05:30 and a negative histogram. A regular bullish divergence and a hidden bearish divergence were both flagged on November 7, and volume is only 41% of its average. The apex points to an expansion of volatility: a 15m close above $75,880 opens the way to $76,420, while a close below $75,660 targets $75,080.
Multi-Timeframe Synthesis
| Timeframe | Dominant trend | RSI (14) | MACD | Chart pattern |
|---|---|---|---|---|
| Daily (1D) | Bearish (descending channel) | ~38 | Below zero, bearish crossover on September 29 | Confirmed double top |
| 4 hours (4H) | Bearish (lower lows) | ~40 | Early bullish crossover, below zero | Confirmed triple top |
| 15 minutes (15m) | Neutral (compression) | ~52 | Bearish crossover above zero | Symmetrical triangle |
Key Levels and Pivot Mapping
The map combines Daily and 4H pivots, swing points, moving averages and estimated liquidation pockets. No Fibonacci extension is retained, because the low of the reference impulse is not dated in the available swings. The short-term central pivot sits between $75,800 and $75,900, where the Daily pivot ($75,858), the 4H pivot ($75,804) and the sell wall at $75,870 converge.
| Level | Price (USD) | Category | Technical basis |
|---|---|---|---|
| Major resistance 3 (R3) | $84,300 – $84,900 | Resistance | Daily double bottom neckline ($84,340) and Daily resistance at $84,875 (October 21) |
| Major resistance 2 (R2) | $81,100 – $82,600 | Resistance | 4H resistance at $81,087, Daily SMA50 ($81,800), Daily SuperTrend ($82,176), double top neckline ($82,500) |
| Immediate resistance (R1) | $78,500 – $79,200 | Resistance | Estimated short pocket $78,472–$78,946, 4H resistance at $79,016, 4H triple top neckline ($79,179) |
| Central pivot (P) | $75,800 – $75,900 | Pivot | Daily pivot $75,858, 4H pivot $75,804, sell wall $75,870, 15m resistance $75,877 |
| Immediate support (S1) | $74,800 – $75,100 | Support | November 6 low ($74,811), Daily support $74,909, 15m support $75,076 |
| Major support 2 (S2) | $73,200 – $73,500 | Support | Daily SMA200 ($73,194), estimated long pocket $72,983–$73,456 |
| Major support 3 (S3) | $72,300 – $72,900 | Support | Estimated long pocket $72,321–$72,888 ($110M); below it, Daily support at $67,090 |
Order Book and Liquidity Heatmap
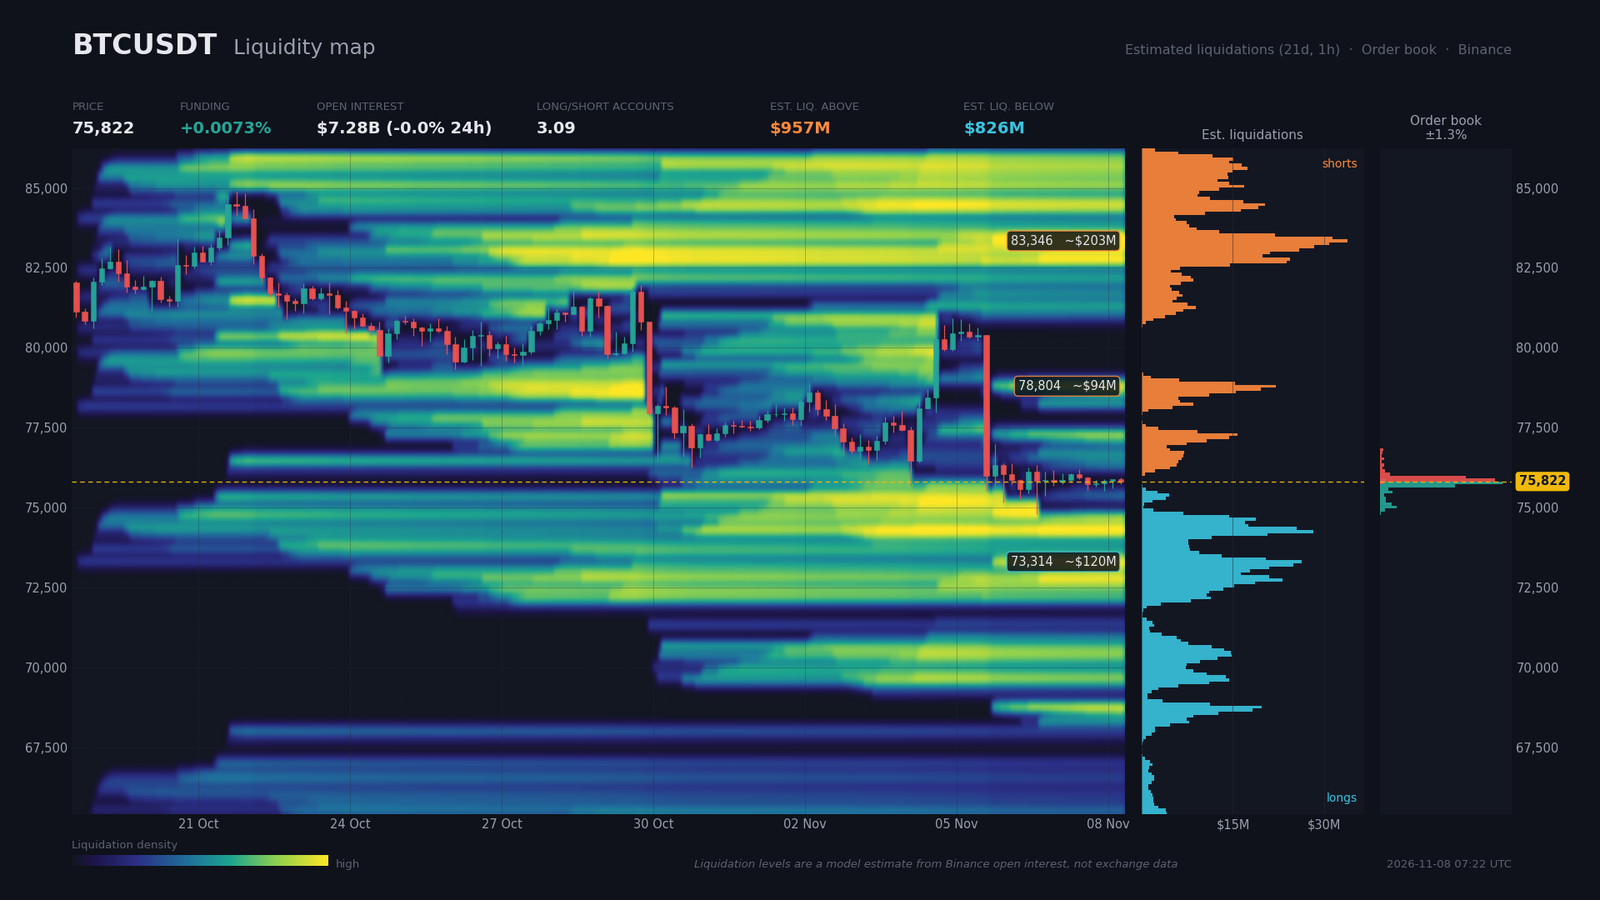
Actual order book coverage is only 1.27% around the price. Sell walls sit at $75,870 ($30.9M) and $75,964 ($23.0M), while buy walls sit at $75,775 ($33.0M) and $75,680 ($20.3M). Within ±2%, bids total $73.2M against $63.5M of asks, a 7.1% imbalance in favor of buyers, concentrated in a band of roughly $100 that matches the apex of the M15 triangle.
Liquidation zones are model estimates built on open interest, not measured data. Above the price, roughly $957M of shorts sit between $78,472 and $78,946 (about $94M), between $82,921 and $83,583 (about $203M) and between $85,287 and $85,760 (about $87M). Below it, roughly $826M of longs sit between $74,119 and $74,403 (about $90M), between $72,983 and $73,456 (about $120M) and between $72,321 and $72,888 (about $110M). Funding at 0.0073% (about 8% annualized) and open interest of $7.28B, down 4.26% over seven days, show no excess leverage. The account long/short ratio stands at 3.09 and the top-trader ratio at 1.87, while the 24-hour taker buy/sell ratio falls to 0.93: sell pressure is aggressive and retail longs remain numerous. The market is therefore exposed to a liquidity sweep toward $74,100–$74,400, then $73,000–$73,500, while a short squeeze toward $78,500–$78,900 remains possible but needs confirmation.
Calendar: Catalysts to Watch
High-impact events cluster around US inflation, which will set the tone for the week. Times are given in Zurich time.
- Tuesday, November 10, 10:00 (Zurich) — Waller (FOMC) speaks: a read on the Fed’s stance just before the inflation release.
- Tuesday, November 10, 14:30 (Zurich) — US CPI: core m/m expected at 0.2% (prior 0.3%), with the CPI index level expected at 337.023 against 330.654 previously. A hot print would reinforce the case for a December hike; a soft one would weaken it.
- Friday, November 13, 14:30 (Zurich) — core PPI: 0.4% (prior 1.3%), a test of rate expectations.
- Tuesday, November 17 — retail crypto trading opens in Russia, a new regulated access point for BTC, ETH and USDT with no direct effect on the price expected in the short term.
Three Scenarios for the Coming Weeks
The three scenarios cover the coming weeks and are ranked around the November 10 CPI release; their probabilities total 100%.
Scenario A — Rejection Below $76,400 and Slide Toward the 200-Day SMA (probability 55%)
The central case, at 55%, assumes a hotter-than-expected CPI or fresh ETF outflows. The trigger is a rejection on the 15m and 4H between $75,900 and $76,420, followed by a 4H close below $74,800. The path leads first to $74,400, then to the Daily SMA200 and the estimated long pocket at $73,200–$73,500, and finally to $72,300–$72,900. The $77,000 stop implies $900 of risk, more than one 4H ATR; the risk-reward ratio is about 1.9 on the first target and 3.3 on the second. Execution zone: sell on a retest of $75,900–$76,400, typical entry near $76,100. Invalidation: a 4H close above $77,000, just below the 4H SMA50 at $77,340.
Scenario B — Short Squeeze Toward $78,500–$79,000 (probability 30%)
This scenario requires a CPI below consensus (0.2% for core), which would reduce the odds of a December hike. The trigger is a 15m then 4H close above $76,420, with confirmation of the 4H bullish divergence. Targets sit at $78,470–$78,950, inside the estimated short pocket, then at $79,020, the 4H resistance. Execution zone: buy on a retest of $76,400–$76,500. Invalidation: a 4H close below $75,700, which puts the stop roughly $750 from entry.
Scenario C — Invalidation of the Bearish Bias (probability 15%)
The trigger would be a 4H close above $79,200, the triple top neckline. The path runs to $81,100, then $81,800 (Daily SMA50) and $82,500 (Daily double top neckline), with the 4H double bottom hypothesis (objective $87,130) still to be confirmed. Execution zone: buy only after a confirmed break above $79,200. Invalidation: a return below $78,500 on a 4H close.
Synthesis and Conclusion
The phase is an orderly correction below the Daily double top, with volatility compressing at the $74,800–$74,900 support. ETF flows, the heaviest since June, confirm weak short-term institutional demand. Low funding and the 4H and 15m bullish divergences, however, argue against mass capitulation and only leave room for an unconfirmed technical bounce. With a confluence score of 3 out of 5, the bearish bias remains the reference read.
The dominant technical strategy is to favor selling rebounds below $76,400 for as long as the 4H does not close above $77,000, the protective level. A bounce purchase is justified only after a 4H close above $76,420. Key levels to watch are $74,800–$74,900, $75,800–$75,900, $76,420 then $77,000–$77,350, $78,500–$79,200 and $73,200–$73,500. The US CPI release on November 10 at 14:30 remains the event that will decide.
Sources
- Bitcoin ETFs flip negative for 2026 after $1.28 billion outflow week, worst since June — The Block, November 7, 2026
- Bitcoin ETFs Bleed $430 Million as Tech Rout Tests Wall Street Buyers — Decrypt, November 6, 2026
- Bitcoin price dips under $75K as crypto markets miss tech-stock rebound — Cointelegraph, November 6, 2026
- US job growth surges in October; unemployment rate falls to 4.1% — Reuters, November 6, 2026
- U.S. economy added 165,000 jobs in October, way more than expected — CNBC, November 6, 2026
- FinCEN Cuts Off MEXC From U.S. Financial System Over Alleged $16B Illicit Flows — Bitcoin Magazine, November 6, 2026
- Elliptic says Binance hackers swap stolen tokens for $124M in bitcoin — The Block, November 6, 2026
- Russia finalizes crypto trading rules ahead of Nov. 17 rollout — Cointelegraph, November 6, 2026
- Trump administration moves closer to allowing crypto in 401(k) retirement plans — The Block, November 6, 2026
- Bitcoin Under $76,000 After $430M ETF Outflows. Has It Bottomed? — Ground News, November 8, 2026
- US Spot Bitcoin ETFs Shift to Net Outflows in 2026, Totaling $415.9 Million — Bloomingbit, November 6, 2026
Disclaimer: This article is for educational and informational purposes only. It does not constitute investment advice, a recommendation to buy or sell, or an invitation to trade any financial asset. Cryptocurrency markets are extremely volatile; any investment decision should be based on your own research (DYOR) and, where appropriate, the advice of a licensed financial adviser.

