


Bitcoin trades at $75,600 on Friday, November 6, about 13.5% below the period high of $87,385 reached on September 21 and less than 1% above the November 5 low of $75,158. After the previous session’s shock, price has entered a phase of compression.
Equities remain the dominant driver. The Nasdaq lost 5.5% on Thursday, the S&P 500 fell 4.4% and the Dow dropped more than 1,800 points, or 3.4%, their worst sessions since April 2025 (CNBC, November 5). Bitcoin shed roughly 6% and erased its post-election gains, while $1.03B of positions were liquidated (The Block, November 5). Total crypto market capitalization lost $140B in four hours, down toward $2.53T (Crypto Briefing). The correlation with technology stocks is clear.
On the macro side, the two-year Treasury yield fell 10.4 basis points to 4.48%, its lowest level since September 9, as investors fled to safety (MarketWatch, November 5). The consensus for nonfarm payrolls (NFP) is 59,000 jobs according to Dow Jones, against a prior reading of 29,000. JOLTS openings of 7.523M (versus 7.1M expected) and the ISM manufacturing PMI at 52.4 were solid, yet bitcoin, which had reached $81,190 on November 4, fell back. The Democratic sweep of Congress complicates the industry’s Washington strategy, and the SEC custody proposal stays open for comment until December 7, 2026 (Seward & Kissel, October 16).
For technical reading, the framework is clear: bearish patterns are confirmed on the higher timeframes, but today’s jobs print may decide whether the floor holds.
Multi-Timeframe Technical Analysis
Daily Timeframe (1D): confirmed double top and broken wedge
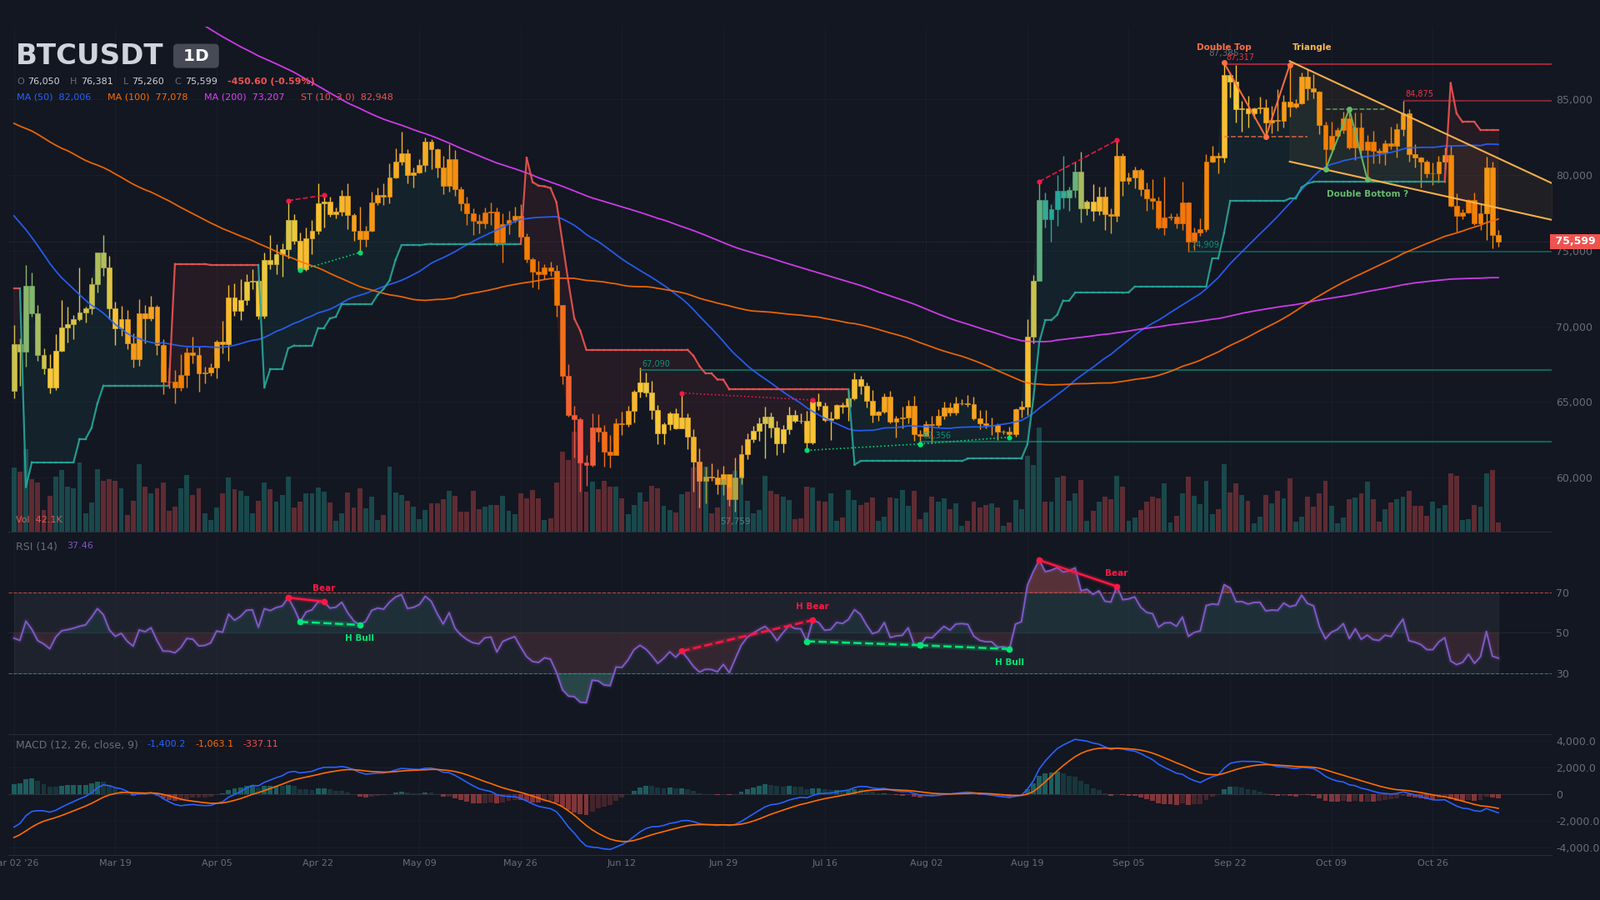
On the daily chart, the trend is bearish and the market is in a distribution phase followed by a correction. Peaks keep declining: $87,385 on September 21, $84,875 on October 21, then $81,954 on October 29, while RSI slid from 74 to 36 across those three highs. Price lost the lower boundary of the October wedge at $78,500 on October 29. The double top is confirmed, with a neckline at $82,500 and a target of $77,680, already reached.
Price sits below the 20-day ($79,700), 50-day ($82,000) and 100-day ($77,100) moving averages but holds above the 200-day at $73,200, the last structural bulwark. The SuperTrend remains bearish at $82,950. A bullish double bottom, with a neckline at $84,340, has been detected but is not confirmed, so it stays a distant scenario.
RSI at ~37 is neutral and close to oversold, with no recent divergence. MACD remains below its signal line and below zero since the bearish crossover of September 29. Volume on the current candle, at 31% of the 20-period average, is provisional; the sessions of November 4 and 5, near 250,000 units, carry more weight.
Intermediate Dynamics (4H): confirmed triple top and aborted double bottom
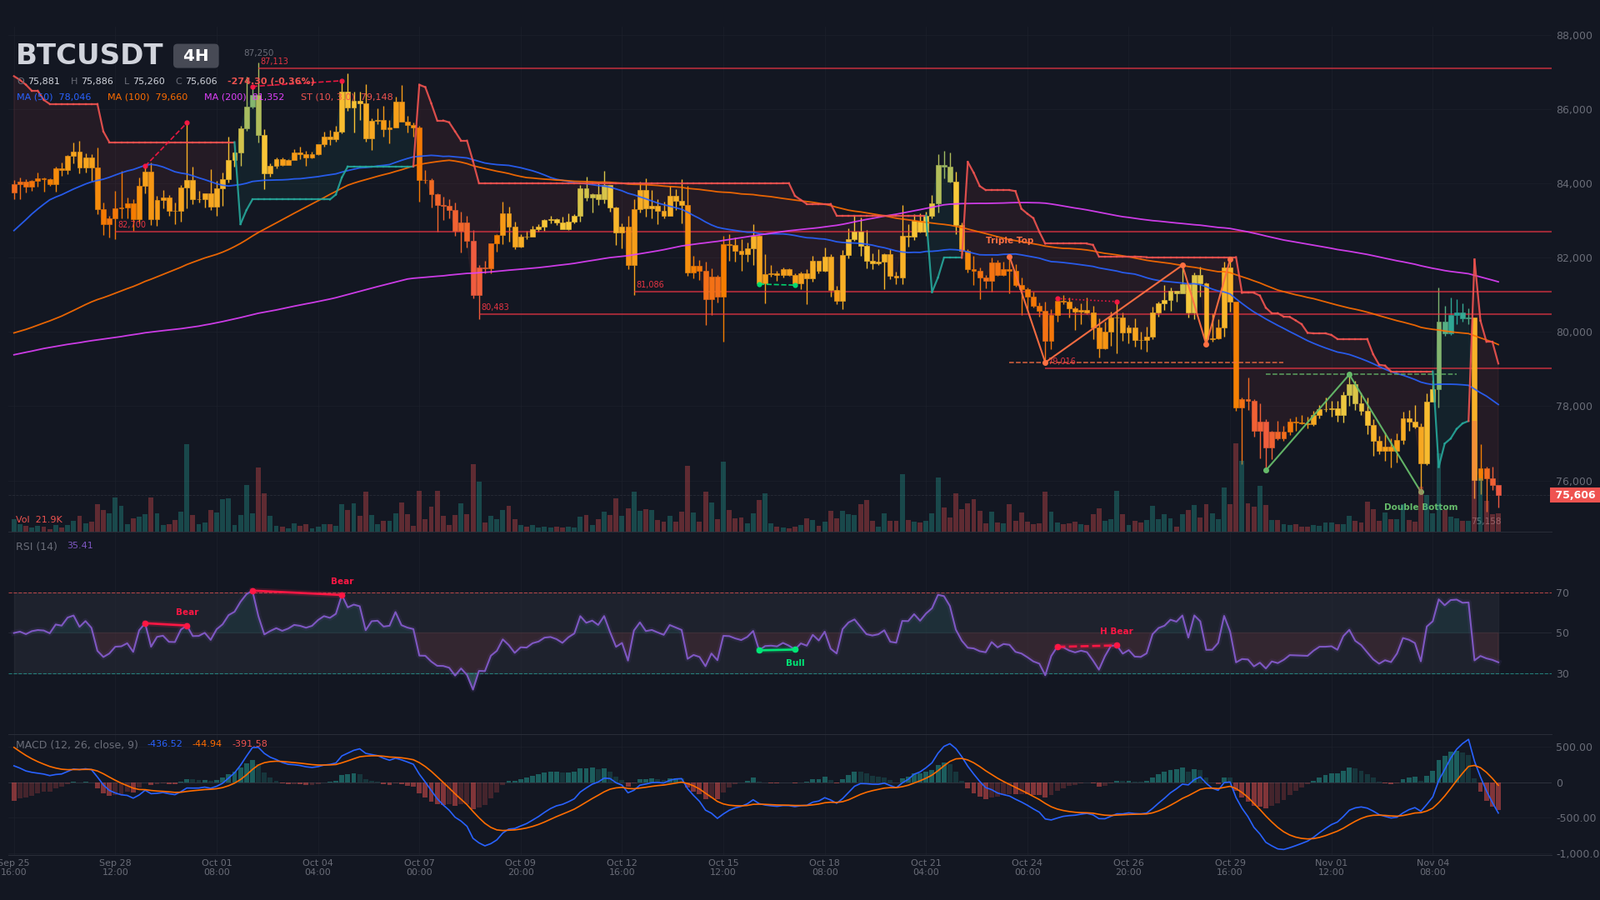
The 4-hour chart confirms the daily picture. The triple top is validated, with a neckline at $79,180 and a target of $76,430, also already exceeded. The double bottom that appeared to be building a base, with a neckline at $78,850, failed after the $81,188 peak of November 4 and the drop of November 5, which printed 128,347 units of volume at the 12:00 candle. The analyst reads this as a bull trap.
The 20-period ($77,900), 50-period ($78,050) and 200-period ($81,350) averages all sit above price, and the SuperTrend is bearish at $79,150. MACD crossed lower on November 5 at 16:00, below zero. RSI, at ~35, was near ~66 only three candles earlier, which underlines the speed of the decline. H4 resistances are stacked at $79,020, $80,480, $81,090 and $82,700. Volume has fallen to 66% of its 20-period average, a sign that selling pressure is easing. The level to watch remains the November 5 low at $75,160 on the M15, just below the H4 low of $75,690 from November 4.
Intraday Structure (15m): symmetrical triangle in compression
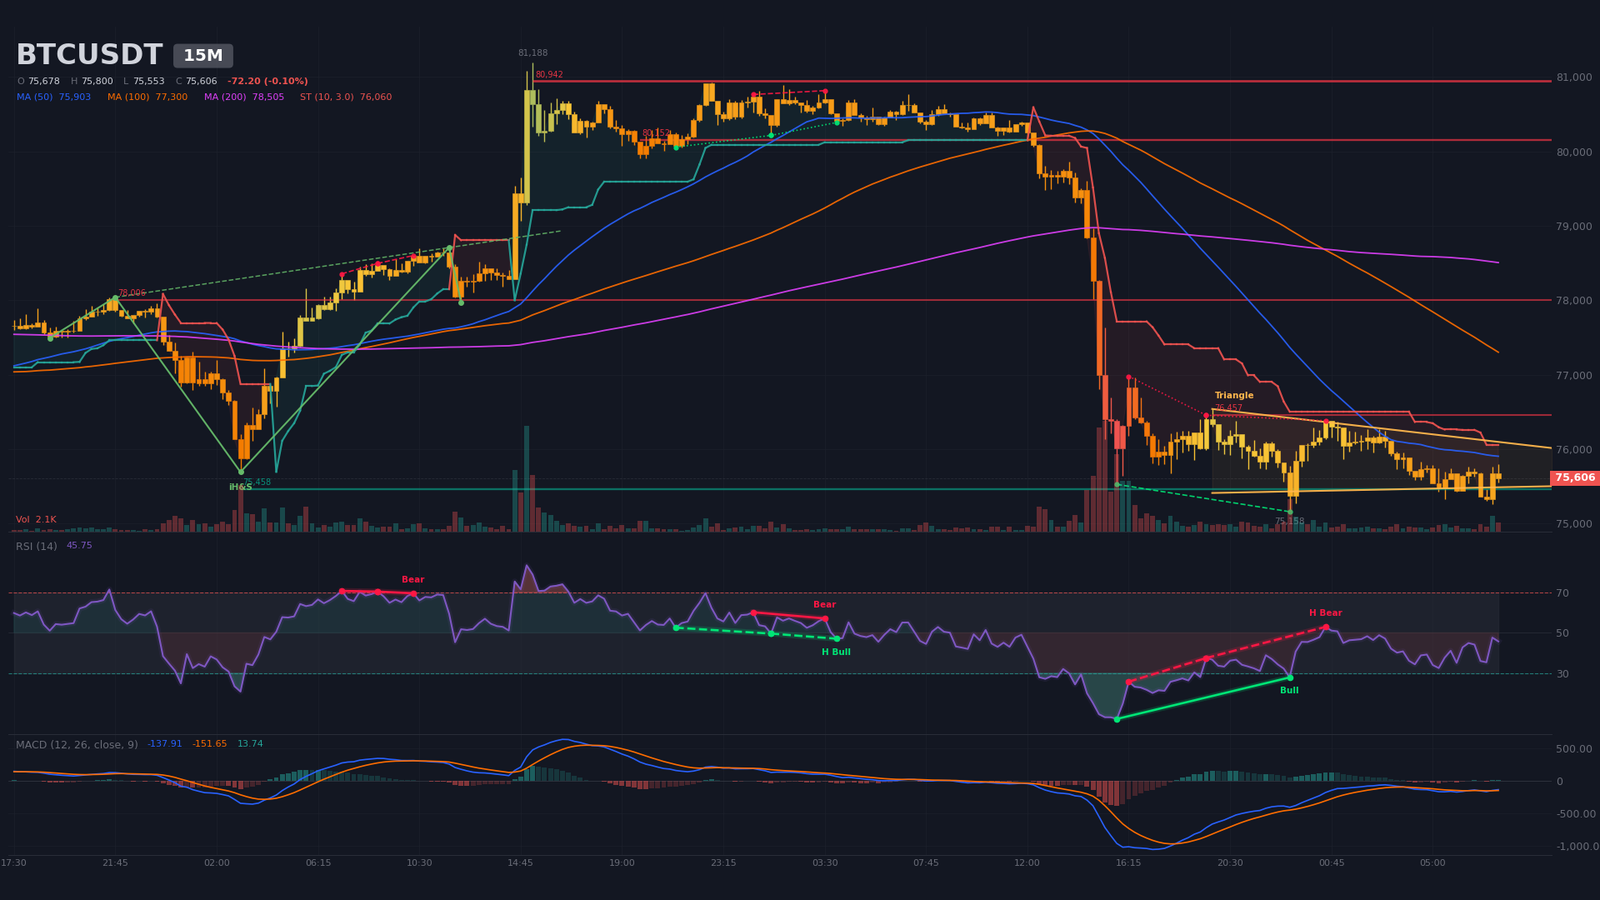
On the 15-minute chart, a symmetrical triangle contains price between $75,470 at the lower boundary and $76,180 at the upper, with an apex estimated for November 6 around 21:50. Support at $75,460 has three touches. Price trades below the 20-period ($75,660), 50-period ($75,900) and 200-period ($78,500) averages, and RSI at ~46 is neutral.
MACD crossed higher at 07:30, below zero, with a slightly positive histogram. A regular bullish divergence between 15:45 and 23:00 on November 5, with price moving from $75,525 to $75,158, signals weaker selling pressure. The latest candle’s volume reaches 169% of its average. A bearish trigger would be a 15-minute close below $75,460, targeting $74,150 to $74,950; a bullish trigger would be a close above $76,460.
Multi-Timeframe Synthesis
| Timeframe | Dominant trend | RSI (14) | MACD | Chart pattern |
|---|---|---|---|---|
| Daily (1D) | Bearish, below 20 and 50 SMA | ~37 | Below signal and zero since 09/29 | Confirmed double top |
| 4 hours (4H) | Bearish | ~35 | Bearish crossover on 11/05, below zero | Confirmed triple top, aborted double bottom |
| 15 minutes (15m) | Neutral, compressing | ~46 | Bullish crossover on 11/06 at 07:30 | Symmetrical triangle |
Level Mapping: Technical Levels and Pivots
The map combines classic daily and M15 pivots, detected supports and resistances, moving averages, neckline levels and estimated liquidation pockets. No clean reference impulse was retained for Fibonacci extensions. The short-term central pivot sits between $75,450 and $75,600.
| Level | Price (USD) | Category | Technical basis |
|---|---|---|---|
| Major resistance 3 (R3) | $82,500 – $83,200 | Resistance | Daily double top neckline, estimated short pocket, Daily SuperTrend at $82,950 |
| Major resistance 2 (R2) | $78,000 – $79,200 | Resistance | H4 triple top neckline ($79,180), H4 resistance at $79,020 |
| Immediate resistance (R1) | $76,200 – $76,500 | Resistance | M15 triangle upper boundary ($76,180), M15 resistance at $76,460 |
| Central pivot (P) | $75,450 – $75,600 | Pivot | M15 pivot at $75,565, M15 support with three touches, bid wall at $75,561 |
| Immediate support (S1) | $74,150 – $74,950 | Support | Daily support at $74,909, estimated long pockets |
| Major support 2 (S2) | $73,200 – $73,850 | Support | Daily 200 SMA ($73,207), Daily pivot S1 at $73,843 |
| Major support 3 (S3) | $67,000 – $67,500 | Support | Daily support at $67,090 with two touches since June 15 |
Order Book and Liquidity Heatmap
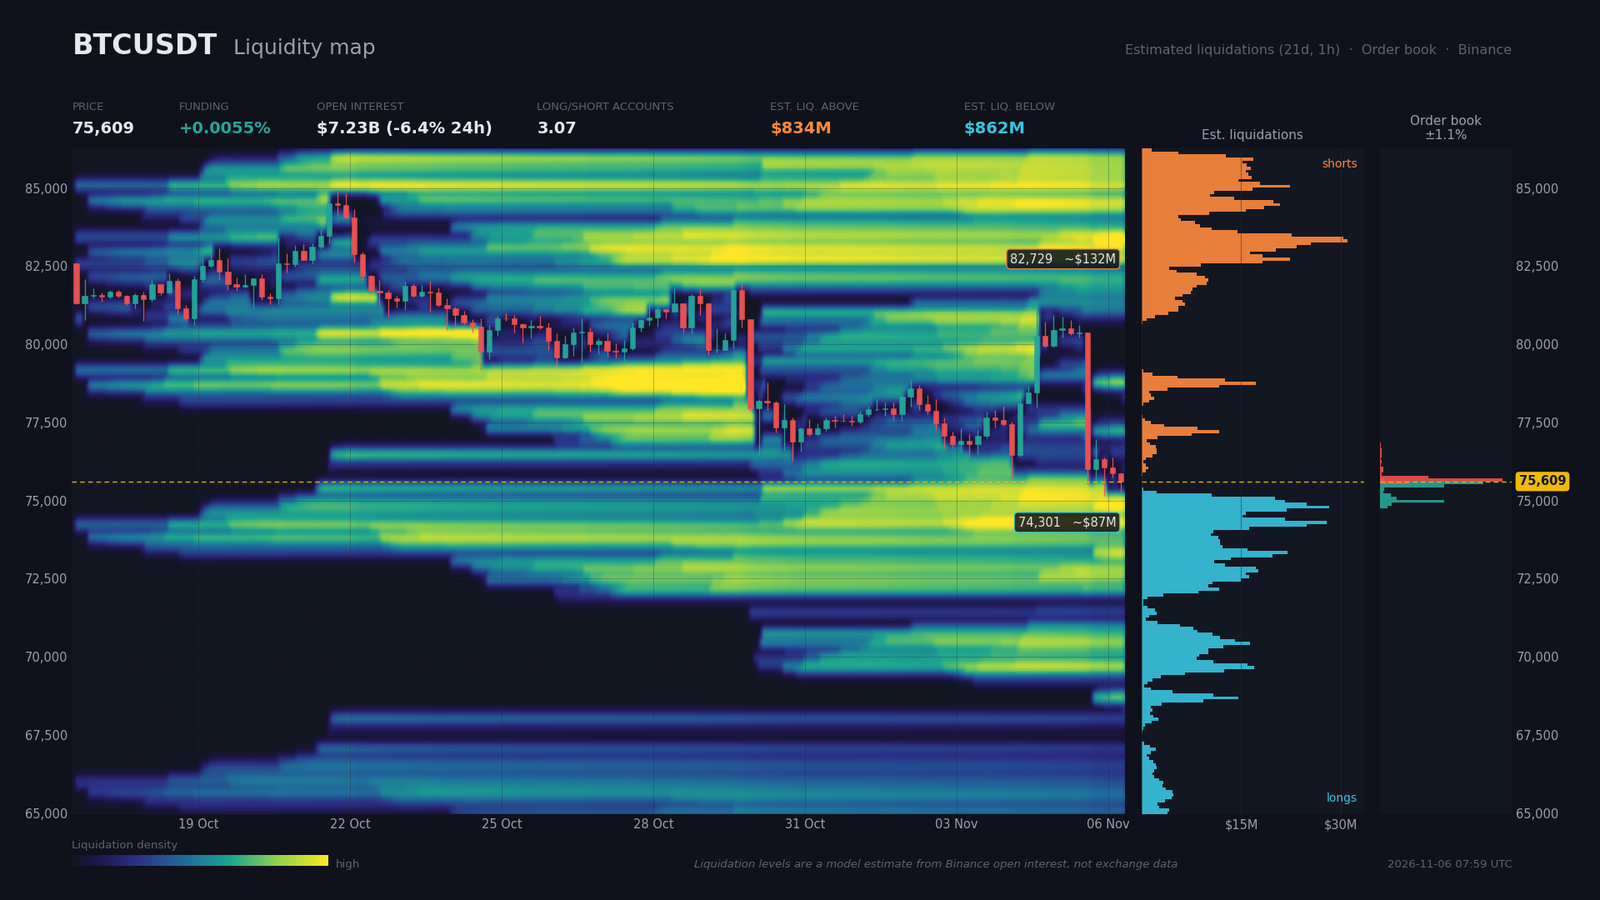
Order book coverage is only 1.09% around price, so the walls described sit very close to the market. On the sell side, $41.9M is offered at $75,660 and $16.6M at $75,750. On the buy side, $35.6M rests at $75,560, $21.8M at $75,460 and $22.0M at $74,980. Within a 2% band, bids total $98.8M against $73.6M of asks, a 14.6% imbalance in favor of buyers. Protection is real but thin.
Estimated liquidation zones, which come from a model rather than measured data, are asymmetric. Below price, longs cluster at $74,740 to $74,930 ($67.8M), $74,160 to $74,450 ($86.6M) and $73,190 to $73,380 ($57.3M). Above, shorts sit at $82,580 to $83,170 ($131.9M, roughly 9.4% above the market), $83,260 to $83,550 ($102.9M) and $84,230 to $84,620 ($86.1M). The estimated total is $862M below price against $834M above. Liquidity below is closer, making it the most probable short-term magnet, while a squeeze toward $82,600 requires a prior break of R2.
Derivatives confirm this read. Funding is at 0.0055%, about 6% annualized, which is neutral. Open interest stands at $7.23B, down 6.36% over 24 hours, pointing to deleveraging after the liquidations. The account long/short ratio is 3.07 and the top trader ratio 2.17, while the taker buy/sell ratio of 0.96 shows a slightly selling flow. The risk is another flush of longs below $74,900, potentially a liquidity sweep before any recovery.
Calendar: Catalysts to Watch
The next ten days hold the releases most likely to push price out of its current range. Today’s payrolls and the U.S. inflation print on November 10 are the two major events.
- Fri, Nov 6, 14:30 (Zurich) — NFP (consensus 59,000 per Dow Jones, 65,000 on the calendar; prior 29,000), unemployment seen at 4.2%, average hourly earnings (0.3% versus 0.1%): a strong surprise lifts yields and pressures risk, while a weak print supports lower yields but confirms economic fragility.
- Fri, Nov 6, 16:00 (Zurich) — UoM consumer sentiment (consensus 48, prior 46.3): a gauge of household risk appetite.
- Fri, Nov 6, 17:00 (Zurich) — remarks from Bank of Japan Governor Ueda: yen volatility risk after the Nikkei sell-off.
- Mon, Nov 9, 02:30 (Zurich) — Chinese inflation (consensus 0.8%, prior 0.9%); Tue, Nov 10, 04:00 (Zurich) — Chinese trade data (export consensus 33%, prior 36.3%).
- Tue, Nov 10, 14:30 (Zurich) — U.S. core CPI, m/m (consensus 0.2%, prior 0.3%): the release most likely to reprice expectations for monetary policy.
- Thu, Nov 12 — UK GDP at 08:00 (prior 0.4%) and U.S. jobless claims at 14:30. No Deribit options expiry is listed in this period.
Three Scenarios for the Coming Weeks
These three scenarios cover the next ten days and follow directly from the M15 compression and the reaction to payrolls. The analyst’s probabilities total 100%.
Scenario A — Rejection below $76,500 and long sweep (probability 50%)
Trigger: an M15 close below $75,460, or a rejection of the $76,200 to $76,500 zone after payrolls. The path targets $74,900 first, the Daily support and long pocket, then $74,150, and finally $73,200 to $73,850, the Daily 200 SMA area. Execution zone: sell on a retest of $76,200 to $76,500. Invalidation: H4 close above $77,500, a $1,200 risk that exceeds the H4 ATR14 of $1,136. Reward-to-risk (R:R) is about 1.8 toward $74,150 and 2.3 toward $73,500.
Scenario B — Relief rally within the structure (probability 30%)
Trigger: an M15 close above $76,460 after a reassuring jobs report or a drop in yields, supported by the M15 bullish divergence and H4 RSI near 35. The path leads to $78,000, then $79,000 to $79,200, the H4 triple top neckline, where a rejection remains likely. Execution zone: buy between $75,450 and $75,700, between M15 support and the $75,560 bid wall. Invalidation: H4 close below $74,900, with the stop placed more than one H4 ATR ($1,136) below entry and therefore raised to that level.
Scenario C — Bullish reversal and bias invalidation (probability 20%)
Trigger: an H4 close above $79,200, for example after payrolls well below consensus that reinforce easing expectations. The path leads to $80,500 to $81,100, then the estimated short pocket at $82,580 to $83,170, with the Daily neckline at $84,340 as the upper limit. Execution zone: buy on a retest of $78,000 to $79,200. Invalidation: an H4 close back below $77,500, which would cancel the reversal.
Synthesis and Conclusion
Bitcoin is in a correction phase after distribution. The daily double top and the H4 triple top are confirmed, their targets are met, and price is now compressing above the daily 200 SMA. Leverage is retreating in derivatives, with open interest down 6.4% over 24 hours and neutral funding, consistent with a partly completed flush. The bias stays bearish, with moderate conviction and a confluence score of 4/5.
The dominant technical strategy is to sell rallies toward $76,200 to $76,500, with protection above $77,500. Buyers regain the advantage only above $79,200, a threshold that would challenge the bearish bias. Position size should stay small around payrolls, and the $74,150 to $74,950 floor is the line to watch.
Sources
- IREN’s bitcoin mining revenue drops 58% as firm plans full exit by year-end — The Block, 11/06/2026
- Core Scientific to quit Bitcoin mining by year-end as AI business surges — Cointelegraph, 11/06/2026
- American Bitcoin’s $126M profit masks mining pressure as rivals turn to AI — Cointelegraph, 11/05/2026
- Bitcoin erases post-election gains as Wall Street selloff triggers over $1 billion in crypto liquidations — The Block, 11/05/2026
- Stock futures mixed after Nasdaq correction; Japan’s Nikkei 225 enters bear market — CNBC, 11/05/2026
- The October jobs report is out Friday. Here’s everything to expect — CNBC, 11/05/2026
- Traders flock to Treasury market for safety as tech-led stock selloff deepens — MarketWatch, 11/05/2026
- Crypto market sheds $140 billion in four hours — Crypto Briefing, 11/05/2026
- Democratic sweep of Congress forces crypto industry to rethink Washington strategy — The Block, 11/04/2026
- Crypto ally French Hill wins reelection but set to lose House chair — Cointelegraph, 11/05/2026
- SEC Proposes Custody Rule Updates and Crypto Custody Framework — Seward & Kissel LLP, 10/16/2026
- Bitcoin Price Trades Near $76,000 as Nasdaq Tumbles into Correction — Bitcoin Magazine, 11/05/2026
Disclaimer: This article is for educational and informational purposes only. It does not constitute investment advice, a recommendation to buy or sell, or an invitation to trade any financial asset. Cryptocurrency markets are extremely volatile; any investment decision should be based on your own research (DYOR) and, where appropriate, the advice of a licensed financial adviser.

