


Multi-Timeframe Technical Analysis
Daily Timeframe (1D): confirmed double top under a compression wedge
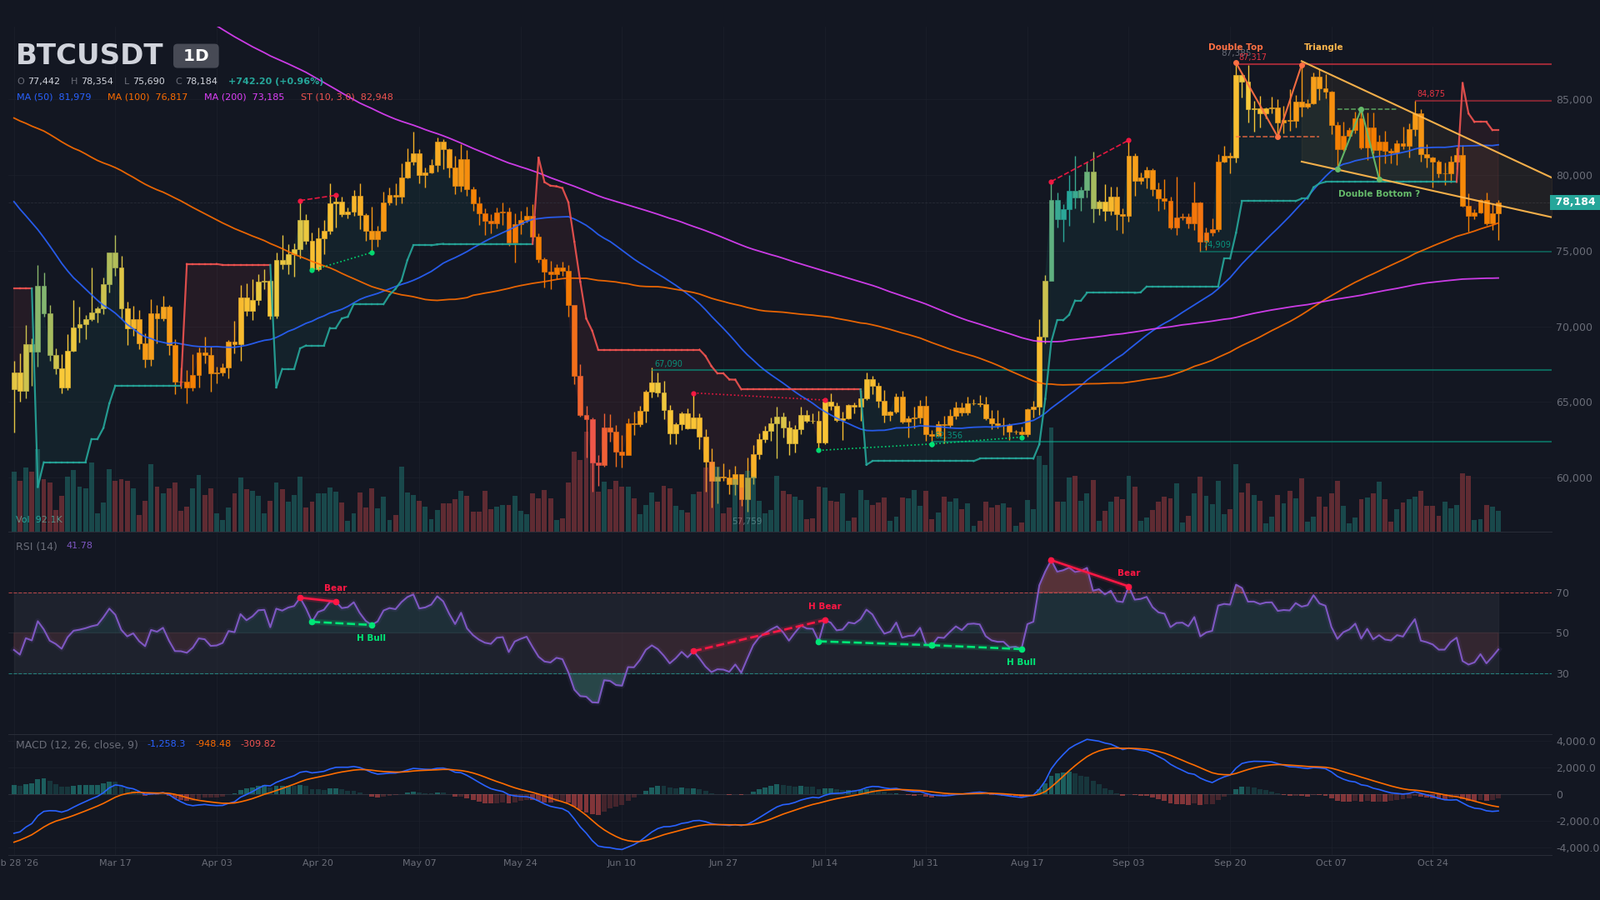
On the daily chart, the trend remains bearish. Peaks are shrinking, from $87,385 (September 21) to $84,875 (October 21) and $81,954 (October 29), and the lows follow the same path: $80,345 (October 8), $79,179 (October 24), then $76,270 (October 30). The SuperTrend stays bearish near $82,950. Price sits below the 20-period simple moving average (SMA 20, $80,170) and the SMA 50 ($81,980), but above the SMA 100 ($76,820) and the SMA 200 ($73,190). There has been no recent 50/200 crossover.
The dominant pattern is a confirmed double top, with a neckline at $82,500 and a target of $77,680. That target has been reached and even exceeded by the wick to $75,690. A compression wedge with an upper boundary near $82,550, a lower boundary near $78,510 and an estimated apex on December 10 frames the price. The market trades at or below the lower boundary, which still needs a daily close to confirm. A bullish double bottom, with a neckline at $84,340 and a target of $88,640, remains a distant hypothesis and is not validated.
The indicators support the bias. The RSI (relative strength index, 14 periods) sits near 42, having climbed out of the 34-36 zone without any recent divergence. Its low on October 30 (34) came with a lower price, so momentum confirms the decline rather than contradicting it. The MACD (moving average convergence-divergence) remains below its signal line and below zero since the bearish crossover on September 29, 36 candles ago, with a negative histogram. Volume on the current candle is at 72% of its 20-period average, provisionally, after spikes on October 29 and 30.
Intermediate Dynamics (4H): confirmed triple top and tactical rebound
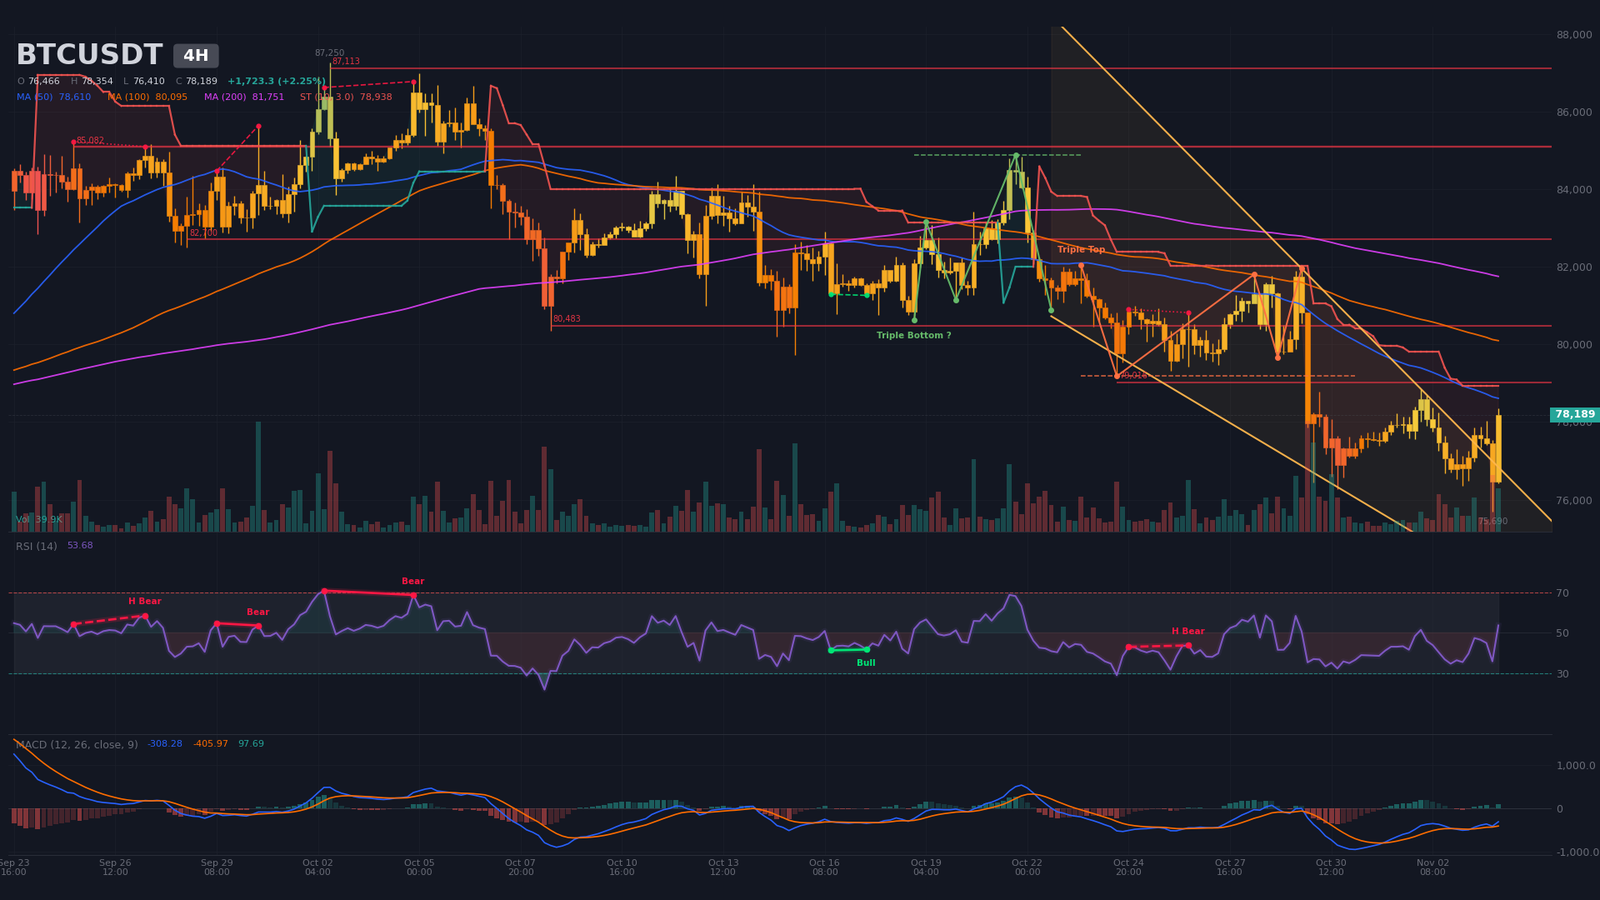
The 4-hour chart nuances the daily picture in the short term. Price has moved back above the SMA 20 ($77,580) but stays below the SMA 50 ($78,610) and the SMA 200 ($81,750). The SuperTrend remains bearish near $78,940. A triple top is confirmed, with a neckline at $79,180 and a target of $76,430. A converging wedge, running from roughly $75,040 to $78,850, has an estimated apex on November 12, so resolution is close. Detected resistances sit at $79,020, $80,480, $82,700 and $85,080, with the first one showing three contacts.
The RSI has recovered from 36 to near 54. The MACD crossed upward on November 3 at 12:00 but remains below zero, with a positive histogram: this is a rebound, not a reversal. A recent hidden bearish divergence, seen on October 24 and 26, points in the direction of the trend. The 00:00 candle swept the lows with a wick to $75,690 before rising toward $78,350. Current volume, provisional, runs at 236% of its average, which suggests active buying below $76,000. A 4-hour close above $79,200 would be needed to confirm the move.
Intraday Structure (15m): V-shaped rebound and rising lows
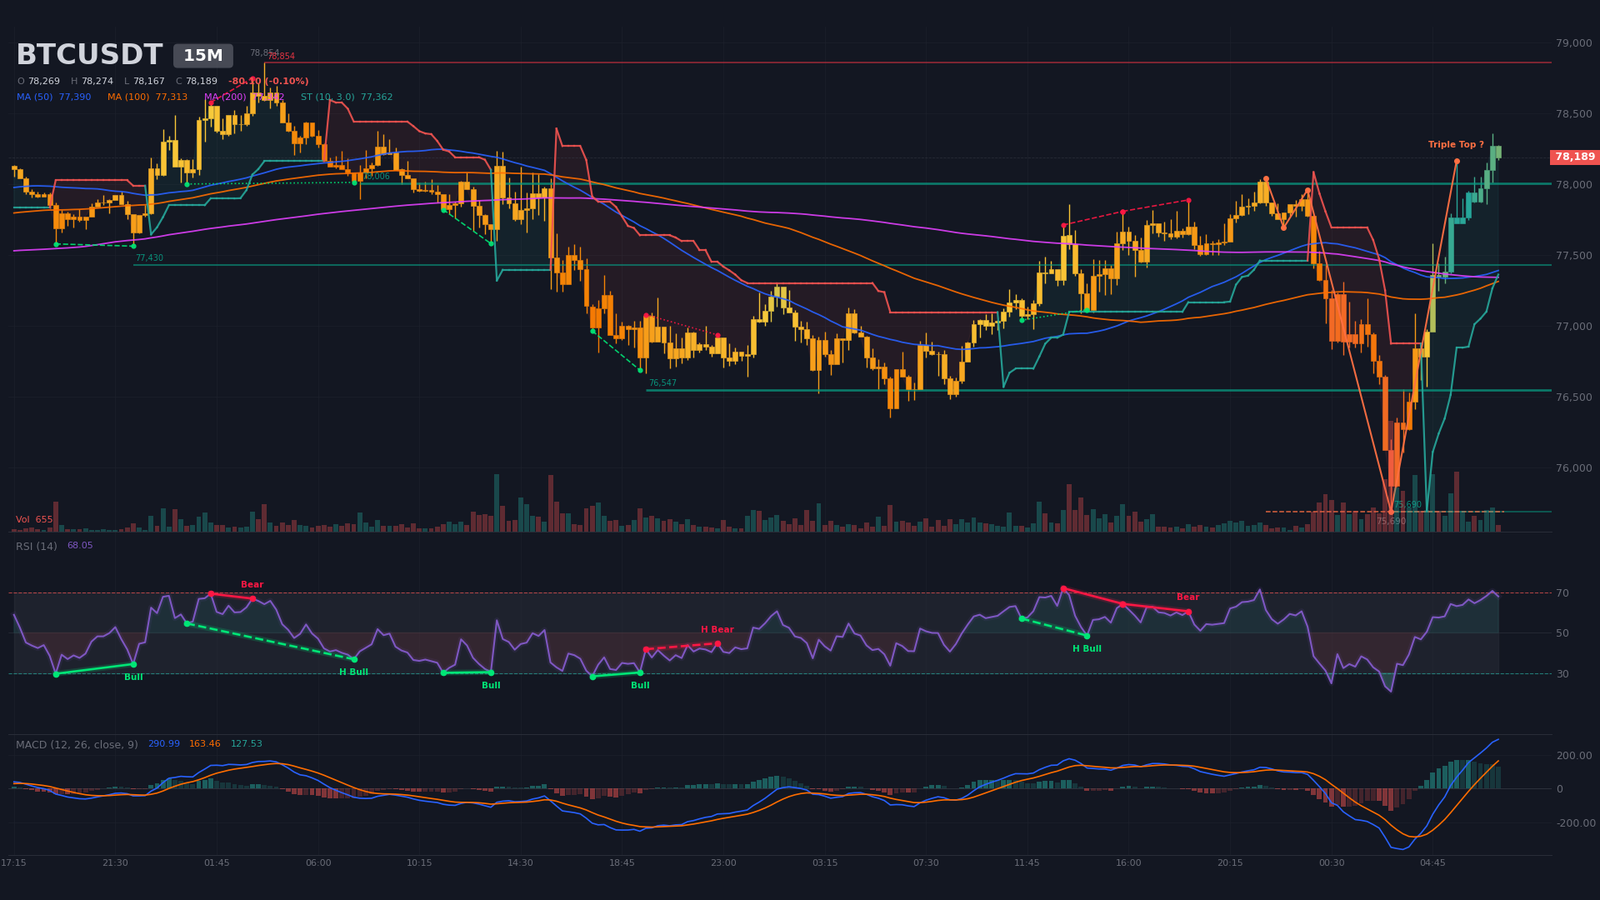
The intraday structure is in a bullish expansion since the 03:00 low at $75,690. Price trades above the 15-minute SMA 20, 50 and 200, all clustered between $77,270 and $77,390; their bullish crossover at 06:30 carries little information because the averages are converging. The SuperTrend is bullish at $77,360, and the MACD is bullish above zero since the 04:15 crossover. The RSI, near 68, is already stretched. A regular bearish divergence, observed between 15:45 and 18:30 on November 3, preceded the overnight drop, and current volume is weak at 19% of its average.
The boundaries of the structure are clear: support at $78,000 (four contacts), then $77,430 and $76,550; resistance at $78,850, the November 2 high. An unconfirmed 15-minute triple top, with a neckline at $75,690 and a target of $73,330, remains a hypothesis. The 15-minute ATR (average true range) is about $290, and the close invalidation level is a 15-minute close below $77,400.
Multi-Timeframe Summary
| Timeframe | Dominant trend | RSI (14) | MACD | Chart pattern |
|---|---|---|---|---|
| Daily (1D) | Bearish (lower highs) | ~42 | Bearish crossover on 09/29, below zero | Confirmed double top + wedge |
| 4 hours (4H) | Bearish (tactical rebound) | ~54 | Bullish crossover on 11/03, below zero | Confirmed triple top |
| 15 minutes (15m) | Bullish (V-shaped rebound) | ~68 | Bullish, above zero | Rising lows below $78,850 |
Technical Levels and Pivot Map
The map combines daily and 4-hour pivots, swing points, detected supports and resistances, wedge boundaries and estimated liquidation pockets. Fibonacci extensions are not retained, since the date of the period low at $57,759 is not provided. The short-term central pivot sits near $77,300, on the daily pivot.
| Level | Price (USD) | Category | Technical basis |
|---|---|---|---|
| Major resistance 3 (R3) | $81,900 to $82,950 | Structural | October 29 swing high ($81,954), daily SMA 50, daily SuperTrend, double top neckline ($82,500) |
| Major resistance 2 (R2) | $79,800 to $80,500 | Liquidity | Estimated short pocket $79,793 to $80,003, 4H resistance $80,483, daily SMA 20 |
| Immediate resistance (R1) | $78,850 to $79,200 | Intraday | November 2 15m high, upper boundary of the 4H wedge, 4H resistance $79,016, triple top neckline |
| Central pivot (P) | $77,300 to $78,000 | Pivot | Daily pivot ($77,278), 15m support $78,006, 15m SMA near $77,350 |
| Immediate support (S1) | $76,270 to $76,550 | Intraday | October 30 swing low ($76,270), 15m support $76,547, daily S1 pivot |
| Major support 2 (S2) | $75,300 to $75,700 | Liquidity | November 4 low ($75,690), daily S2 pivot, estimated long pocket $75,316 to $75,386 |
| Major support 3 (S3) | $74,100 to $74,900 | Structural | Daily support $74,909, estimated long pocket $74,126 to $74,406 |
Order Book and Liquidity Heatmap
Real order book coverage is only 1.07% around the price, so the book illuminates the very short term alone. Sell walls stand at $78,220 ($26.7M), $78,290 ($35.0M), $78,500 ($5.4M) and $78,780 ($6.8M). On the buy side, bids sit at $78,150 ($31.8M), $78,080 ($30.6M) and $78,010 ($2.5M), all within 0.15% of the price. Within 2%, bids total $70.7M against $85.6M of asks, a modest 9.5% imbalance tilted toward sellers. The price is trapped between two $30M walls about 0.1% apart, a intraday equilibrium point rather than durable support.
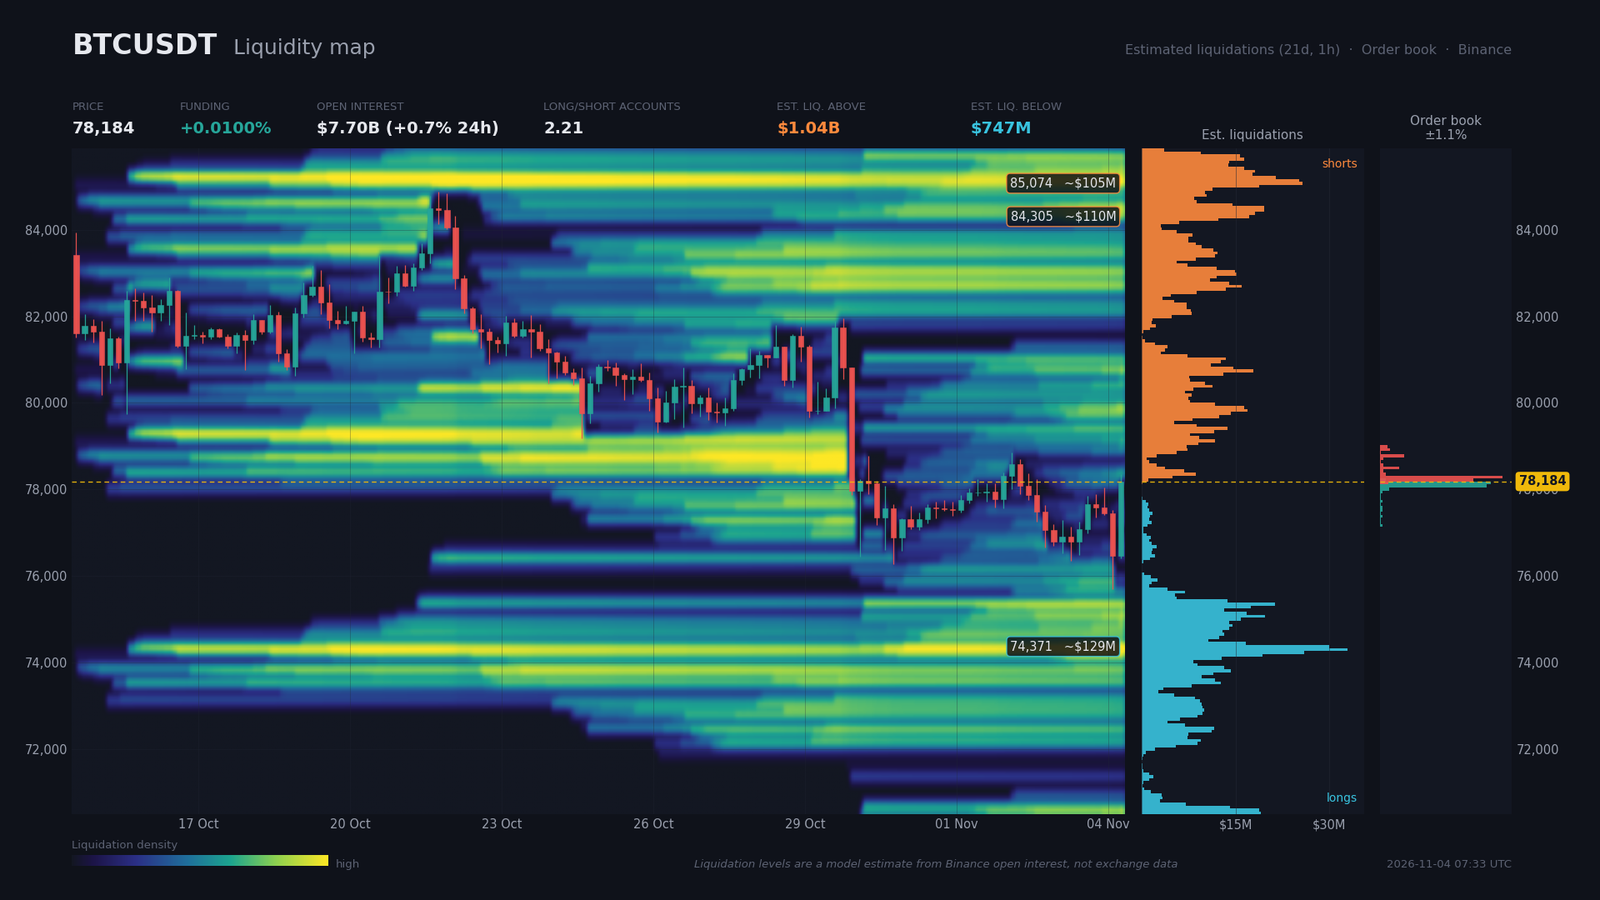
Estimated liquidation zones, produced by a model rather than measured directly, are heavier above (about $1.04B) than below (about $747M). Above: $79,800 to $80,000 ($54M), $84,200 to $84,620 ($110M) and $84,970 to $85,250 ($105M). Below: $75,320 to $75,390 ($42M), $74,130 to $74,410 ($129M) and $73,710 to $73,920 ($47M). These markers remain estimates.
Funding is low at 0.01% (about 10.9% annualized). Open interest reaches $7.70B, up 0.65% over 24 hours and down 0.96% over seven days, with no clear reset of leverage. The account long/short ratio is 2.2 (1.9 for large traders), and the taker buy/sell ratio is 1.006. The retail long dominance keeps a downside sweep risk toward $75,300 to $74,400 alive. Mechanically, the $79,800 to $80,000 pocket is the nearest upside magnet, and a short squeeze toward that zone is the most readable short-term scenario.
Calendar: Catalysts to Watch
The week of November 4 concentrates the high-impact releases, in this order.
- Wednesday, November 4, 11:00 (Zurich) — euro area flash core inflation (consensus 2.5%, previous 2.5%): whether it confirms or rejects the bet on an ECB tightening.
- Wednesday, November 4, 16:00 (Zurich) — ISM services (consensus 54.8, previous 54.9): a preliminary test of US momentum.
- Thursday, November 5, 13:00 (Zurich) — Bank of England (consensus 4.00%, previous 3.75%): a hike is already expected, so any surprise would come from the tone.
- Friday, November 6, 14:30 (Zurich) — NFP (consensus 65,000, previous 29,000; hourly earnings expected at +0.3% versus +0.1%, unemployment steady at 4.2%): the release most likely to pull Bitcoin out of its structure.
Three Scenarios for the Coming Weeks
The probabilities below come from the analyst and total 100%. They reflect a reading by levels rather than a directional forecast, over a short horizon set by the 4H wedge, whose apex is estimated for November 12.
Scenario A — Rebound rejected below $79,000 to $80,500 (probability 50%)
The trigger is a failed 4-hour close above $79,200, following the ISM services release on November 4 and, above all, the NFP on November 6. The path leads toward $76,430, the 4H triple top target, then $75,300 to $75,700 and $74,100 to $74,900. Execution zone: sell between $78,900 and $79,400, stop at $80,600 (above $80,483, more than one 4H ATR of about $900), for an R:R of about 1.8 toward $76,430. Invalidation: 4-hour close above $80,500.
Scenario B — Short squeeze, then a return to range (probability 30%)
The trigger is a 4-hour close above $79,200 without breaking $80,500. Price would go after the estimated short pocket at $79,800 to $80,000 ($54M), then $80,480, before returning toward $77,300 to $78,000, the pivot and the 4H wedge apex zone on November 12. Catalyst: Bank of England on November 5 at 13:00. Execution zone: tactical buy on a dip between $77,400 and $78,000, stop at $76,400 (about one 4H ATR below the zone). Invalidation: 4-hour close below $76,300.
Scenario C — Bullish invalidation (probability 20%)
The trigger is a daily close above $82,950, which coincides with the SuperTrend and the upper boundary of the wedge. The path leads toward $84,340 to $85,100, the double bottom neckline and a zone where an estimated $215M of short pockets cluster, then toward $88,640 if the double bottom validates, a hypothesis not confirmed at this stage. Possible catalyst: an NFP well below consensus with lower yields, to be confirmed. Execution zone: retest between $82,500 and $82,900, stop at $80,400 (about one daily ATR below the zone). Invalidation: daily close below $82,500.
Conclusion and Synthesis
The phase is an orderly correction within a distribution: the daily and 4H charts remain governed by confirmed bearish patterns, while the 15-minute rebound stems from a sweep of the $75,690 low and is not confirmed above $79,200. Flows neither refute nor validate the move: ETF data is not documented, open interest is stable and funding is neutral. The market remains sensitive to hacks and to US politics, whose Senate outcome shapes the future of the CLARITY Act.
The dominant technical strategy is to favor rejections below $79,000 to $80,500 rather than chasing the rebound into thin air. The protection level is $80,500 on the 4H chart, then $82,950 on the daily for the broader bias. Because liquidation pockets are estimates, they serve as reference points, not certainties. Critical levels to watch:
- $82,950 (daily SuperTrend): exit from the bearish bias
- $79,200 (4H triple top neckline): validation of the rebound
- $77,300 to $78,000 (pivot): intraday equilibrium
- $76,270 (October 30 swing low): short-term support
- $74,900 (daily support): next line of defense
Sources
- Bitcoin Slips as Democratic Sweep Bets Threaten Crypto Agenda — Bloomberg, 11/04/2026
- Democrats claim control of the US Senate — Cointelegraph, 11/04/2026
- Former Sen. Sherrod Brown defeats Jon Husted — The Block, 11/04/2026
- Treasury yields fall as investors crowd into bonds for safety amid election stock sell-off — CNBC, 11/03-04/2026
- Job openings posted big September gain — CNBC, 11/03/2026
- Bitcoin price defends $76K lows — Cointelegraph, 11/03/2026
- Bitcoin Price Trades Near $77,500 as Midterm Voting Begins — Bitcoin Magazine, 11/03/2026
- Binance Says $6.34 Billion Hack Began With Fake Job Interview — Bitcoin Magazine, 11/03/2026
- Brazil’s Biggest Bitcoin Exchange Says It Will Refund Users After a $40 Million Hack — Decrypt, 11/03/2026
- France : Crédit Mutuel Arkéa visé par un vol crypto de 133 millions $ — Journal du Coin, 11/04/2026
- Tether Holds 150,000 Bitcoin, CEO Says — Decrypt, 11/03/2026
- ECB keeps rates unchanged but points to mounting inflation risk — Reuters, 10/29/2026 (date not confirmed)
- Economic and crypto calendar (Zurich time) — provided calendar, November 4, 2026
Disclaimer: This article is for educational and informational purposes only. It does not constitute investment advice, a recommendation to buy or sell, or an invitation to trade any financial asset. Cryptocurrency markets are extremely volatile; any investment decision should be based on your own research (DYOR) and, where appropriate, the advice of a licensed financial adviser.

