


Bitcoin trades at $78,080 on November 2, roughly 10.6% below its recent high of $87,385 set on September 21. The major low of $76,270, printed on October 30 as the Binance hack dominated headlines, sits only about 2.4% under the market. The asset is in an orderly correction after distribution, consolidating beneath lower highs while it digests the shock.
The dominant event remains the Binance breach. On October 29, hackers that the FBI links to TraderTraitor (Lazarus) drained roughly $6.3B from the exchange’s hot wallets, according to The Block and Cointelegraph, while Decrypt cites $6.4B. Withdrawals reopened over the weekend, with the Bitcoin network first (Cointelegraph, November 1). Binance logged $3.64B in net outflows in nine and a half hours (The Block, November 1) and $5.8B over 24 hours according to Journal du Coin (November 2). U.S. spot bitcoin ETFs shed $643M on October 30, their worst session since June 25, and $202.6M over the week (The Block, SoSoValue). Laevitas puts that at less than 1% of $98.14B in assets, a day of de-risking rather than capitulation. Ether ETFs lost $155.9M that day and $1.61B over October, their worst month since launch (BeInCrypto). THORChain halted swaps on ten networks, RUNE is down 19%, and Binance is due to publish its proof of reserves on Tuesday, a short-term confidence test.
On the macro side, core PCE came in at +0.3% on October 29, in line with consensus (Investing.com). Advance U.S. GDP printed at 3.4% against 3.2% expected and 2.2% previously, yet the day’s bitcoin weakness coincided with the Binance news rather than this figure. The ECB held its deposit rate at 2.5% and the Bank of Japan kept its policy rate at 1.25%, both as expected. SOFR stayed between 3.92% and 3.95% from October 23 to 29, under financing conditions described as calm (CryptoSlate, November 2). According to CNBC (November 1), investors now see AI risk as a bigger concern than geopolitical risk, a view BlackRock also reports. The U.S. midterm elections on November 3 add uncertainty. On regulation, the SEC proposed a crypto custody framework on October 1, with comments open until December 7 (Seward & Kissel).
For the technical reading that follows, this backdrop supports the daily bearish bias without confirming an acceleration: ETF outflows and distrust of platforms weigh, but the analysts quoted rule out capitulation.
Multi-Timeframe Technical Analysis
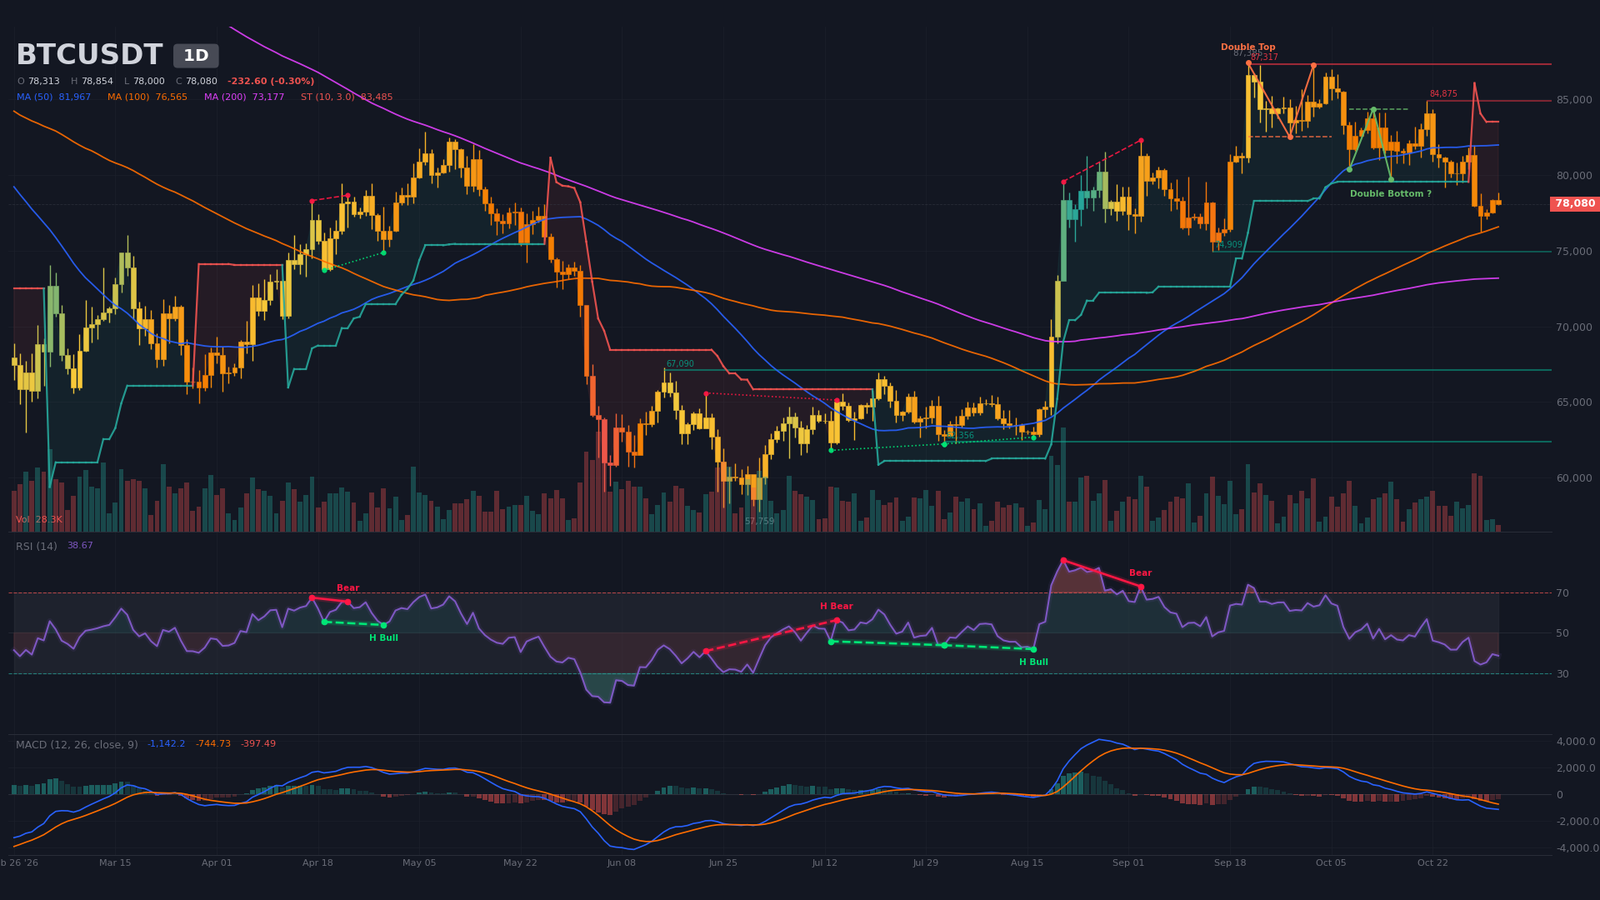
Daily Timeframe (1D): Double Top Confirmed Below $82,500
The daily phase is a correction after distribution, framed by a series of lower highs ($87,385 on September 21, $84,875 on October 21, $81,954 on October 29) and lower lows ($80,345 on October 8, $79,179 on October 24, $76,270 on October 30). Price sits below the 20-period simple moving average (SMA20, ~$80,640) and the SMA50 (~$81,970), but remains above the SMA200 (~$73,180). No 50/200 crossover is flagged, and the SuperTrend is bearish at $83,490.
The algorithm confirms a double top with a neckline at $82,500 and a target at $77,680, which has already been approached. A double bottom with a $84,340 neckline and an $88,640 target remains an unconfirmed hypothesis. The RSI (relative strength index) is at ~39, a neutral reading, after bouncing from a low near 34. The regular bearish divergence from August 21 to September 3 (RSI ~86, then ~73) preceded the correction. MACD has stayed below its signal line and below zero since the bearish crossover of September 29, with a clearly negative histogram. Volume on the current candle, at 21% of its 20-period average, is provisional.
Next supports sit at $74,900 (one touch), then $67,090 and $62,360 (two touches each). The SMA100 is at ~$76,560.
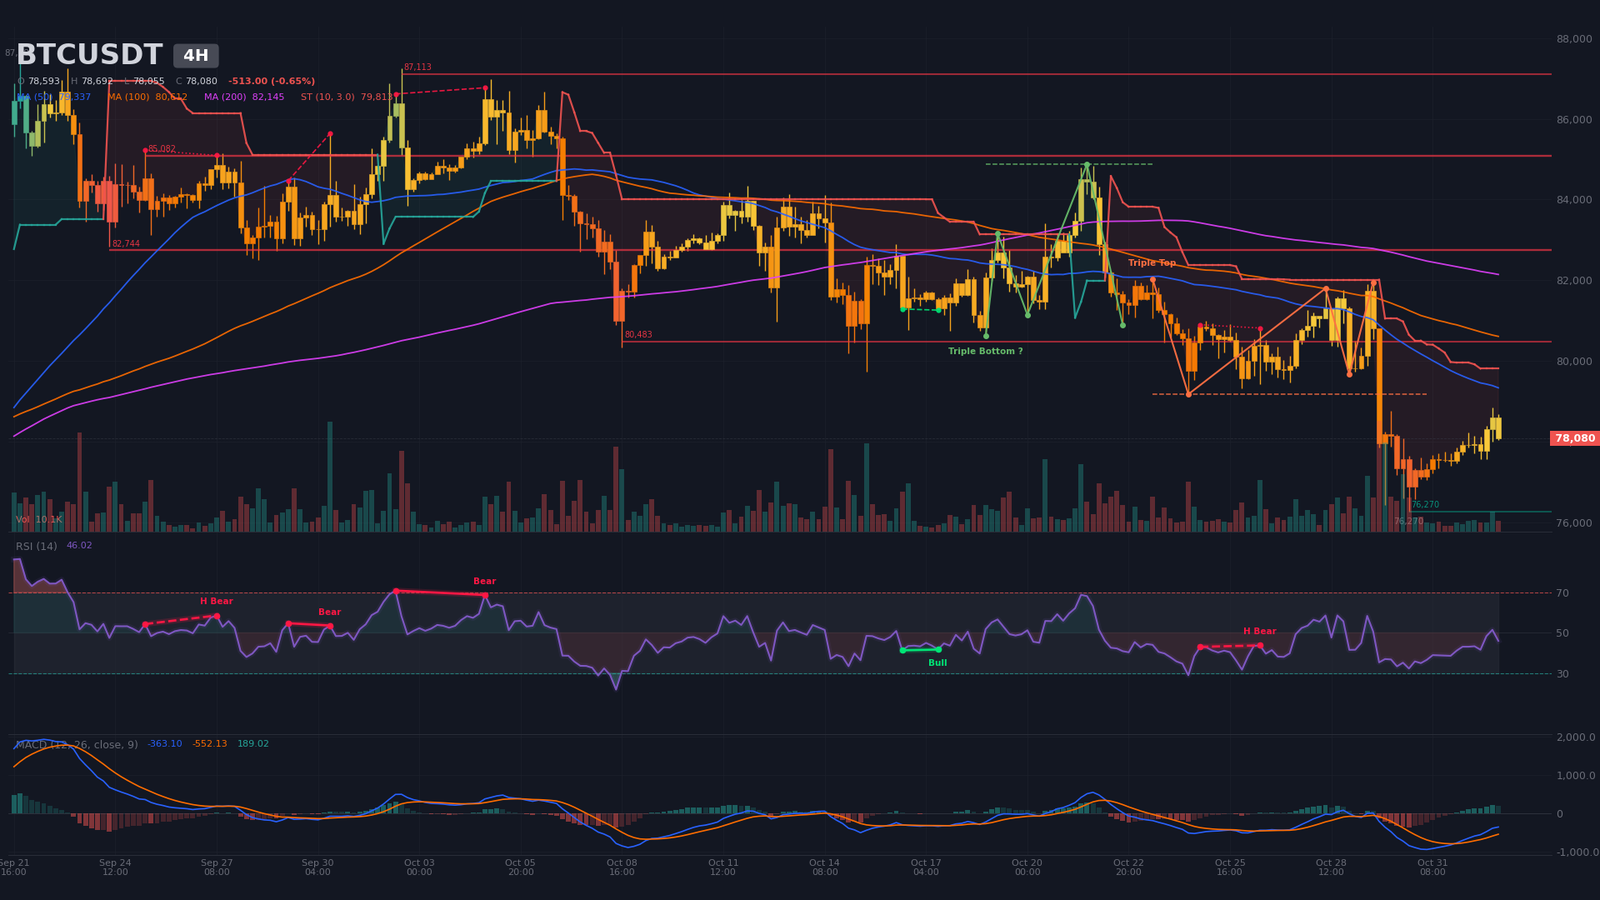
Intermediate Dynamics (4H): Triple Top Confirmed, Corrective Rebound
On the four-hour chart, the triple top is confirmed, with a neckline at $79,180 and a target at $76,430. The actual floor at $76,270, printed on October 30, delivered that target to within a few dozen dollars. At $78,080, price is above the SMA20 (~$77,720) but below the SMA50 (~$79,340) and the SMA200 (~$82,150). The SuperTrend remains bearish at $79,810. Resistance sits at $80,480 (two touches), $82,740 and $85,080 (three touches each). The last swing high, at $78,231 on November 1, stays well below the $81,954 peak of October 29, which keeps the downtrend intact.
The RSI has risen to ~46, and MACD crossed higher on November 1 with a positive histogram, yet it remains below zero. The signal points to a technical rebound rather than a reversal. Volume is at 43% of its average. A hidden bearish divergence (a continuation signal), seen between October 24 and 26, is still flagged as recent. The four-hour chart therefore tempers the daily view without invalidating it.
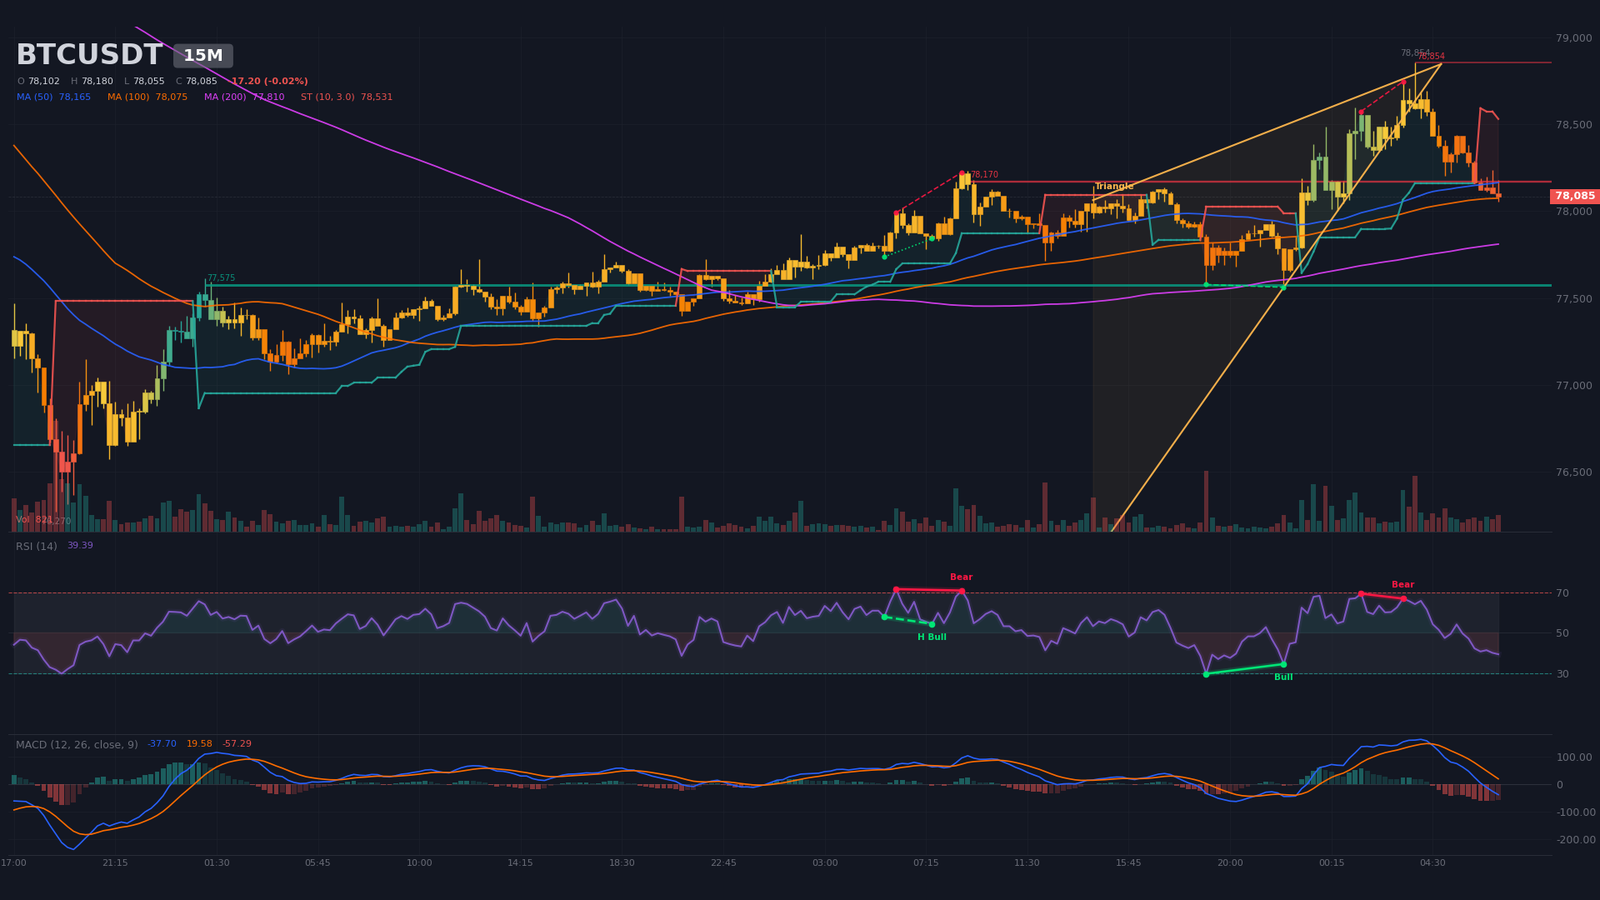
Intraday Structure (15m): Wedge Broken to the Downside, Range $77,575 to $78,850
On the 15-minute chart, the wedge, with boundaries at $78,790 and $78,630 and an estimated apex around 04:45, has been broken to the downside. Price trades below its SMA20 (~$78,375) and SMA50 (~$78,165), above the SMA200 (~$77,810), and the SuperTrend is bearish at $78,530. MACD crossed lower at 04:30 with a negative histogram, RSI sits near 39, and a regular bearish divergence between 01:30 and 03:15 (RSI ~69, then ~67) preceded the drop. Volume is normal, at 96% of average.
Intraday boundaries are support at $77,575 (eleven touches) and resistance at $78,170 (three touches), with the morning high at $78,854. A bearish trigger would be a 15-minute close below $77,575, a bullish one a close above $78,850.
Multi-Timeframe Summary
| Timeframe | Dominant Trend | RSI (14) | MACD | Chart Pattern |
|---|---|---|---|---|
| Daily (1D) | Bearish (correction) | ~39 | Bearish crossover on Sep 29, below zero | Confirmed double top |
| 4 hours (4H) | Bearish (corrective rebound) | ~46 | Bullish crossover on Nov 1, below zero | Confirmed triple top |
| 15 minutes | Neutral to bearish (range) | ~39 | Bearish crossover on Nov 2 | Wedge broken to the downside |
Key Level Map: Pivots and Technical Levels
The method combines classic pivots, detected support and resistance, moving averages, chart-pattern targets and estimated liquidation pockets. No Fibonacci extension is used, since the reference low cannot be dated reliably. The short-term central pivot sits between $78,050 and $78,500, drawn from the daily, 15-minute and 4-hour pivots.
| Level | Price (USD) | Category | Technical Basis |
|---|---|---|---|
| Major Resistance 3 (R3) | $82,500 – $83,500 | Resistance | Daily double top neckline ($82,500), 4H resistance ($82,740), daily SuperTrend ($83,490), estimated short pocket $82,840 – $83,130 |
| Major Resistance 2 (R2) | $79,800 – $80,500 | Resistance | 4H SuperTrend ($79,810), 4H resistance ($80,480), daily SMA20 (~$80,640) |
| Immediate Resistance (R1) | $78,850 – $79,200 | Resistance | 15m high of Nov 2 ($78,854), 4H triple top neckline ($79,180), sell walls ~$78,900 – $78,970 |
| Central Pivot (P) | $78,050 – $78,500 | Pivot | Daily pivot $78,054, 15m $78,146, 4H $78,482 |
| Immediate Support (S1) | $77,500 – $77,700 | Support | 15m support ($77,575, eleven touches), double top target ($77,680), 4H S2 ($77,630) |
| Major Support 2 (S2) | $76,250 – $76,450 | Support | October 30 low ($76,270), 4H triple top target ($76,430) |
| Major Support 3 (S3) | $74,100 – $74,900 | Support | Daily support ($74,910), estimated long pocket $74,110 – $74,460 |
Order Book and Liquidity Heatmap
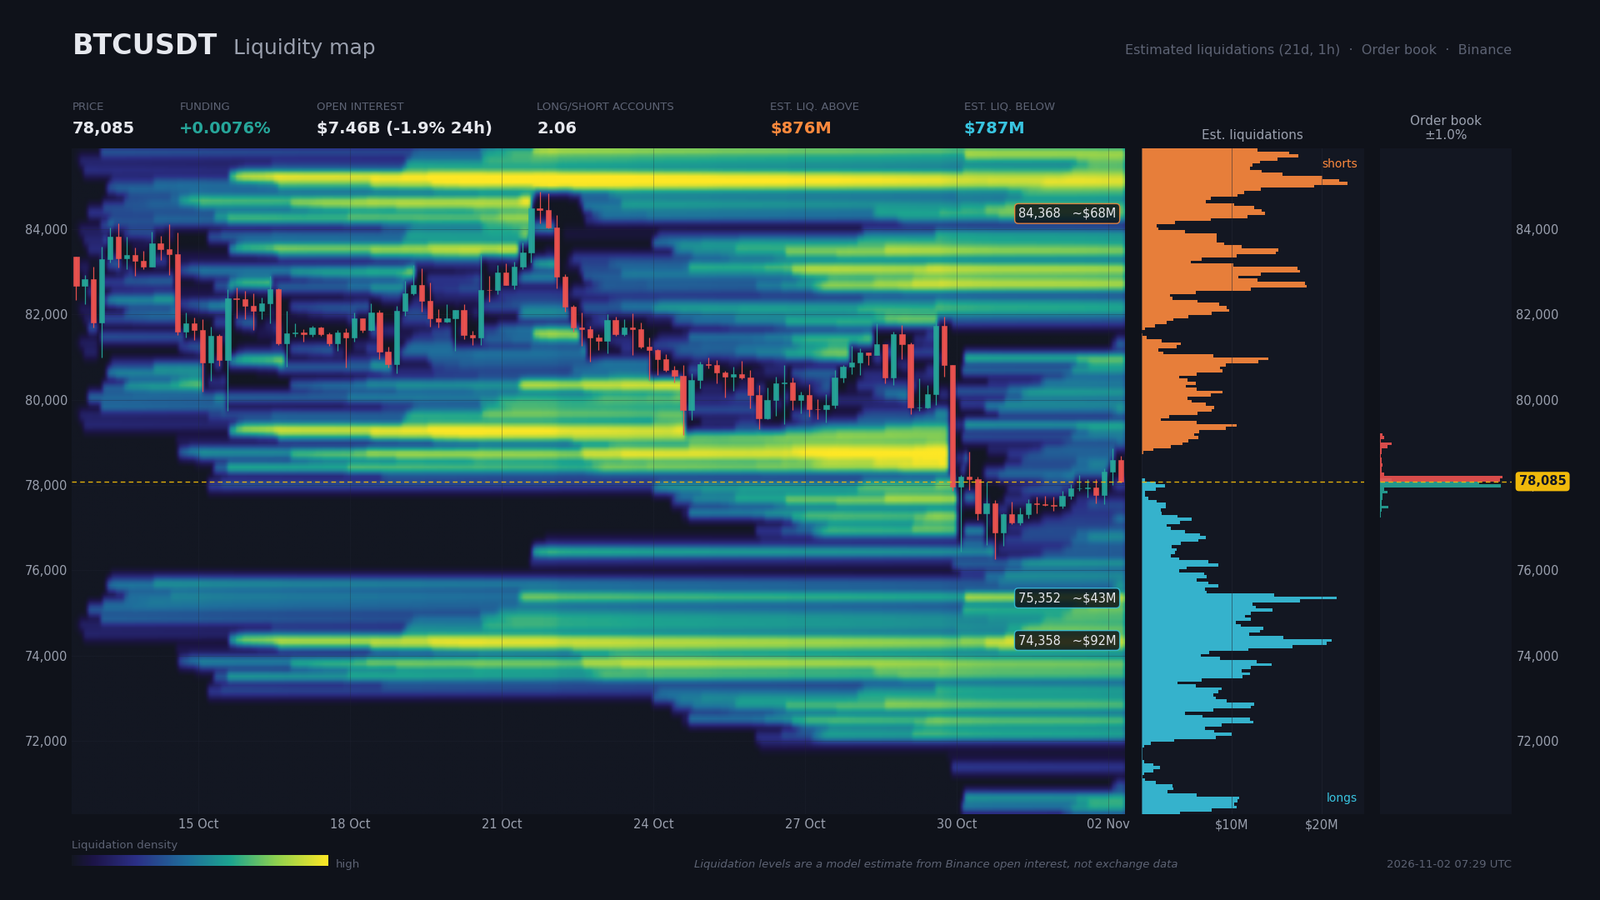
Binance publishes only the top of its order book: coverage reaches just 1.01% around the price, and the ±2% imbalance is -3.9% (bids $66.3M, asks $71.7M). Sell walls stand at $78,120 ($30.4M) and $78,190 ($31.0M), then $78,900 and $78,970 ($1.8M and $3.0M). Buy walls sit at $78,050 ($25.1M) and $77,980 ($30.8M), then $77,840 and $77,480. This tight symmetry points to a market on hold, without a clear directional conviction.
The liquidation pockets, estimated by a model built on open interest rather than measured, break down as follows. Above the price, shorts cluster between $82,840 and $83,130 (~$68M), $84,260 and $84,620 (~$68M) and $85,470 and $85,890 (~$98M); the model totals $876M overhead, of which the three main pockets account for about $234M. Below the price, longs sit between $75,320 and $75,390 (~$43M), $74,110 and $74,460 (~$92M) and $73,750 and $73,900 (~$35M), for a modeled total of $787M. Funding is slightly positive at 0.0076% (about 8.3% annualized). Open interest stands at $7.46B, down 1.9% over 24 hours and 1.0% over seven days, a sign of mild deleveraging. The account-based long/short ratio is 2.06, against 1.73 for large traders, and the taker buy/sell ratio is 1.03: retail is clearly buying, which mechanically exposes longs to a sweep toward $75,350 and $74,360. A squeeze toward $83,100 remains possible, but muted funding leaves little fuel on the upside. The risk is therefore a liquidity sweep in both directions before a clear move.
Calendar: Catalysts to Watch
Several releases in the coming days could revive volatility. Times are given in Zurich time.
- Monday, November 2, 16:00 (Zurich) — ISM manufacturing PMI (consensus 54.6, previous 54.5): a read on U.S. industrial activity that weighs on risk appetite ahead of the vote.
- Tuesday, November 3, time not specified — publication of Binance’s proof of reserves: a direct confidence test for the exchange and its outflows.
- Tuesday, November 3, 01:00 and 16:16 (Zurich) — U.S. midterm elections and Congress: political volatility with an uncertain effect.
- Thursday, November 5, 13:00 (Zurich) — Bank of England decision (consensus 4.00% against 3.75% previously), which suggests an expected hike: tighter policy would weigh on risk assets.
- Friday, November 6, 14:30 (Zurich) — U.S. employment report: unemployment consensus 4.2% (previous 4.2%), hourly wages +0.3% (previous +0.1%), with payrolls expected at 75,000 according to CNBC. The key event, the most likely to push price out of the $76,300 to $80,500 range.
Three Scenarios for the Coming Weeks
The three scenarios below cover the next few weeks. The probabilities are the analyst’s own and total 100%.
Scenario A — Rejection Below $79,200 and Resumption of the Decline (probability 45%)
Trigger: a failure below the $78,850 to $79,200 zone, followed by a 15-minute close under $77,575, against the backdrop of Binance’s proof of reserves on November 3 and U.S. payrolls on November 6. The path would first target the October 30 low at $76,300, then the long pocket at $75,350, and finally $74,400, near the daily support at $74,910. The stop sits above $80,500, more than 2 ATR on the 4-hour chart (~$729) (average true range, a volatility gauge), for an R:R of roughly 1.6 toward $76,300 and 2.8 toward $74,400. Execution zone: sell the rebound between $78,600 and $79,200. Invalidation: a 4-hour close above $80,500.
Scenario B — Short Squeeze and Rejection (probability 35%)
Trigger: a 15-minute close above $78,850, then a 4-hour close above $79,180, following the ISM on November 2 and the elections on November 3. The path would lead to $80,480, then to the short pocket between $82,840 and $83,130; a rejection below $83,500 would then restore the bearish bias. The stop sits at about $1,400, beyond one 4-hour ATR, for an R:R of roughly 1.9 toward $80,480. Execution zone: buy the dip between $77,600 and $78,000. Invalidation: a 4-hour close below $76,270.
Scenario C — Bullish Invalidation (probability 20%)
Trigger: a daily close above $84,340, the neckline of the double bottom (an unconfirmed hypothesis), helped by political sentiment or a macro surprise such as the November 6 payrolls. The path would run through $84,875, then $87,320, before the $88,640 target. Execution zone: follow-through after a daily close and a retest of $83,500. Invalidation: a daily close back below $80,500.
Summary and Conclusion
The current phase is an orderly correction without capitulation: low volume, calm funding and slightly falling open interest. Flows confirm caution, between ETF outflows, Binance withdrawals and the sell pressure the hackers have announced, without invalidating the bearish structure. They do not fully validate it either, since the analysts quoted describe a sentiment shock rather than a trend reversal. With both bearish patterns close to their objectives, expect choppy moves rather than a clean acceleration.
The dominant technical strategy is to sell rallies below $79,200, with protection above $80,500 on the 4-hour chart. Any long position remains tactical and should be invalidated below $76,270. Critical levels to watch are $79,180 (4H triple top neckline), $77,575 (15m support with eleven touches), $76,270 (October 30 low), $80,480 (4H resistance) and $83,490 (daily SuperTrend).
Sources
- BTCPay Server Identifies Attack Vector After Bitcoin Wallet Theft Reports — Cointelegraph, 02/11/2026
- Spot bitcoin ETFs see largest daily outflows in four months following record Binance hack — The Block, 02/11/2026
- THORChain Bug Halts Swaps Across 10 Networks — Cointelegraph, 02/11/2026
- Bitcoin ETF Investors Head for the Exits After Record Binance Hack — Decrypt, 01/11/2026
- $3.6B flees Binance on reopen, THORChain co-founder opposes coin freeze: Hodler’s Digest — Cointelegraph, 02/11/2026
- Binance says phase one of withdrawals opens after $6.3B hack — Cointelegraph, 01/11/2026
- Bitcoin held up better than expected after Binance hack, Strive CEO says — Cointelegraph, 31/10/2026
- Treasury dealers’ financing burden can outlast their bond holdings, Fed study finds — CryptoSlate, 02/11/2026
- Everything changed for the oil, AI and bond trades over the past month — CNBC, 01/11/2026
- Here are 3 big things we’re watching in the stock market in the week ahead — CNBC, 01/11/2026
- ETH, XRP, SOL calmes, RUNE à l’arrêt – Le point altcoins — Journal du Coin, 02/11/2026
- Ethereum ETFs Log Their Worst Month for Flows Since 2024 Launch — BeInCrypto, 02/11/2026
- SEC Proposes Custody Rule Updates and Crypto Custody Framework — Seward & Kissel LLP, 16/10/2026
- United States Core PCE Price Index MoM — Investing.com, date non précisée
- Robinhood Q3: Revenue Hits $1.42B as Crypto Income Falls 55% — CryptoPotato, 01/11/2026
- Calendrier économique et crypto (heure de Zurich), données fournies
Disclaimer: This article is for educational and informational purposes only. It does not constitute investment advice, a recommendation to buy or sell, or an invitation to trade any financial asset. Cryptocurrency markets are extremely volatile; any investment decision should be based on your own research (DYOR) and, where appropriate, the advice of a licensed financial adviser.

