


Bitcoin is trading below the $80,000 mark after a liquidation purge triggered by the Binance hack. On October 30, 2026, the price sits at $78,440, roughly 10% below the period high of $87,385 printed on September 21, after an intraday low of $76,444 during the morning liquidation. The overall bias remains bearish with moderate conviction: the distribution phase that opened at the September top is not over, even if the market is digesting a one-off security shock.
The dominant driver is the Binance hack. According to the exchange, the impact reaches $6.3B, of which about $3B is frozen, and deposits and withdrawals have been suspended with a resumption promised within 48 hours (Bitcoin Magazine, October 29). TRM Labs, Chainalysis and ZachXBT attribute the attack to the North Korea-linked group TraderTraitor (Cointelegraph, October 30). According to CoinGlass, as reported by The Block (October 29), liquidations reached $1.55B over 24 hours, including $1.34B of long positions, while BNB lost 7.1%. Analysts at Laevitas and ViaBTC describe the reaction as “contained.” On the chart, the H4 close of October 29 and the candle at 00:00 on October 30 both show volume far above average, the signature of a leverage purge rather than high-conviction selling.
On the macro side, the Fed held its policy rate in the 3.75% to 4% range on October 28, with two dissenters, Cook and Hammack, favoring a hike (CNBC, October 28). The decision matched consensus, but the restrictive message weighs on risk assets. On October 29, core PCE printed at 0.3%, in line with consensus and the prior reading, while the advance US GDP reading surprised at 3.4% against 3.2% expected. Personal income disappointed at 0.5% versus 0.6% expected, and weekly jobless claims fell to 194,000 against 199,000 forecast. Such solid growth sustains the high-rate scenario: Bitfinex (October 26) still put the probability of a December Fed hike at 72%, and Fidelity’s Timmer (October 30) warned of wider spreads if earnings fail to keep pace. In Europe, the ECB left its deposit rate at 2.5% on October 29, and the Bank of Japan held at 1.25% on October 30 by an 8-1 vote, a decision CNBC describes as a “hawkish hold.”
This backdrop frames the technical reading that follows. The Binance supply shock is one-off, but restrictive macro and the $81,000 to $82,500 supply zone, where Bitfinex places 874,000 BTC of acquisition cost, cap any rebound. On the flow side, Strategy holds 848,517 BTC and points to $30B of “digital credit” capacity; this is capacity, not an announced program (Cointelegraph, October 30). On regulation, the SEC proposed on October 1 a custody framework for crypto assets held by investment advisers and funds, with comments open until December 7. No usable on-chain data is available at this stage.
Multi-Timeframe Technical Analysis
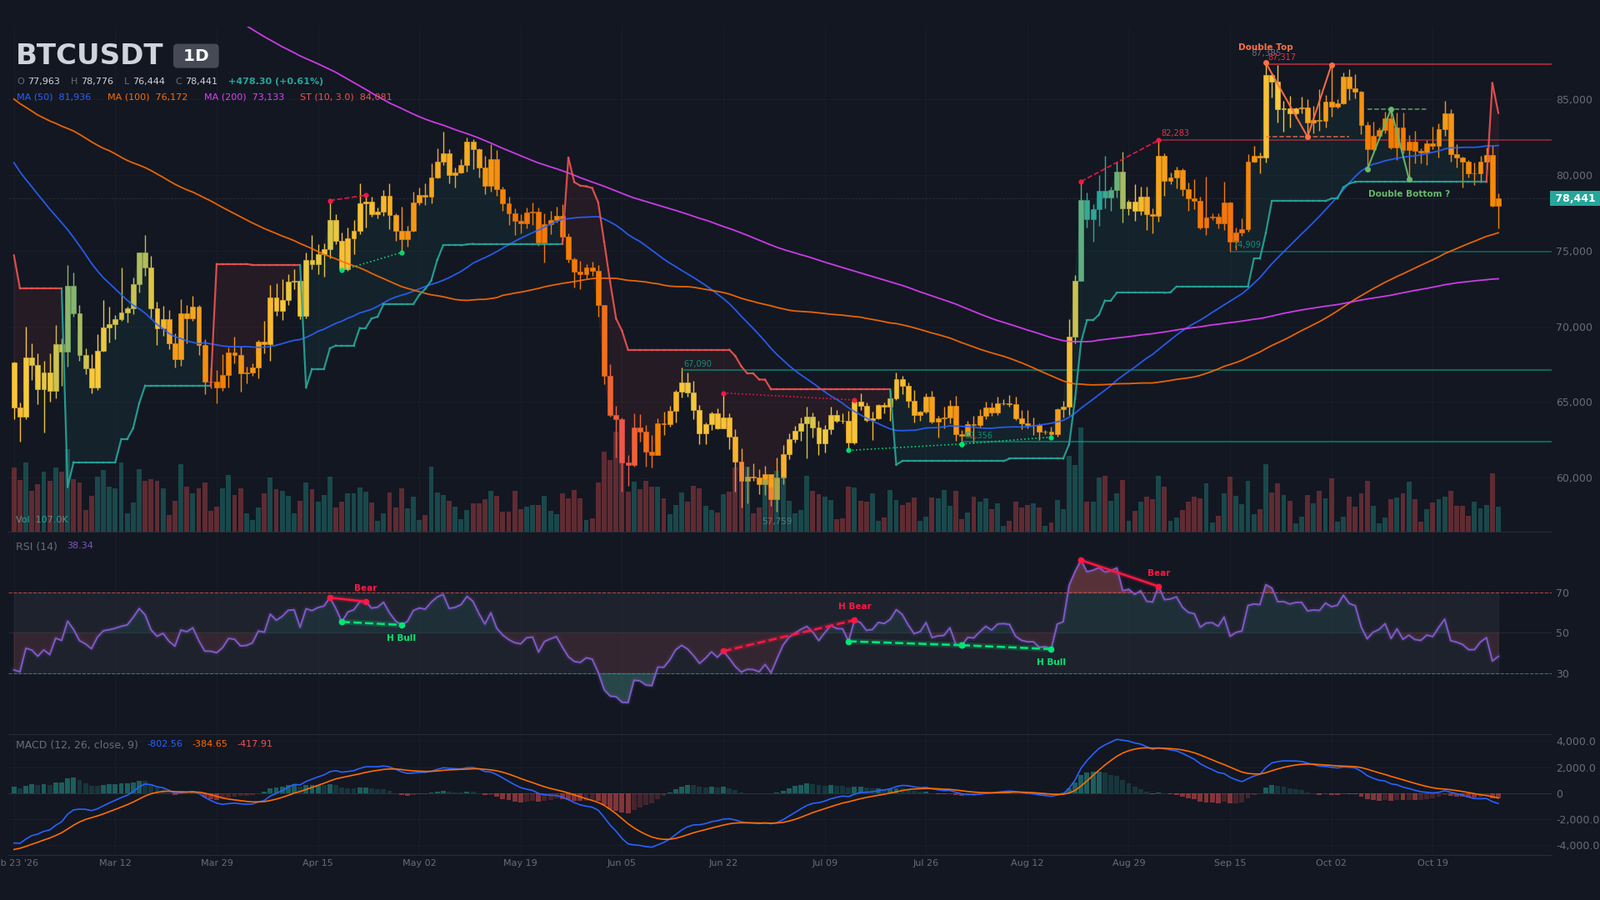
Daily Timeframe (1D): Confirmed Double Top, Target Reached
The dominant trend remains bearish over the medium term. After the September 21 peak at $87,385, the market moved from distribution into correction: the price trades below its SMA 20 (≈ $81,440) and SMA 50 (≈ $81,940), but remains above its SMA 200 (≈ $73,130). No 50/200 crossover has been detected, and the SuperTrend remains bearish at $84,080.
The dominant pattern is a confirmed double top, with a neckline at $82,500 and a projected target of $77,680. Price has reached and exceeded that objective, bottoming at $76,444, which makes a technical rebound plausible. On the other side, a bullish double bottom is flagged but not confirmed: its neckline sits at $84,340, for a target of $88,640. Until $84,340 is broken, it remains a hypothesis. The regular bearish divergence from August 21 to September 3, with price rising from $79,560 to $82,280 while RSI fell from 86 to 73, preceded the current correction.
Momentum confirms the weakness without signaling an extreme. The RSI (14) sits near 38, neutral but close to oversold territory after a low near 36 the previous day. The MACD remains below its signal line and below zero since the bearish crossover of September 29, 31 candles ago, with a deepening negative histogram. Volume on the current candle stands at 84% of the 20-period average, but the candle is incomplete, so no conclusion can be drawn yet.
Intermediate Dynamics (4H): Confirmed Double Top and Capitulation Purge
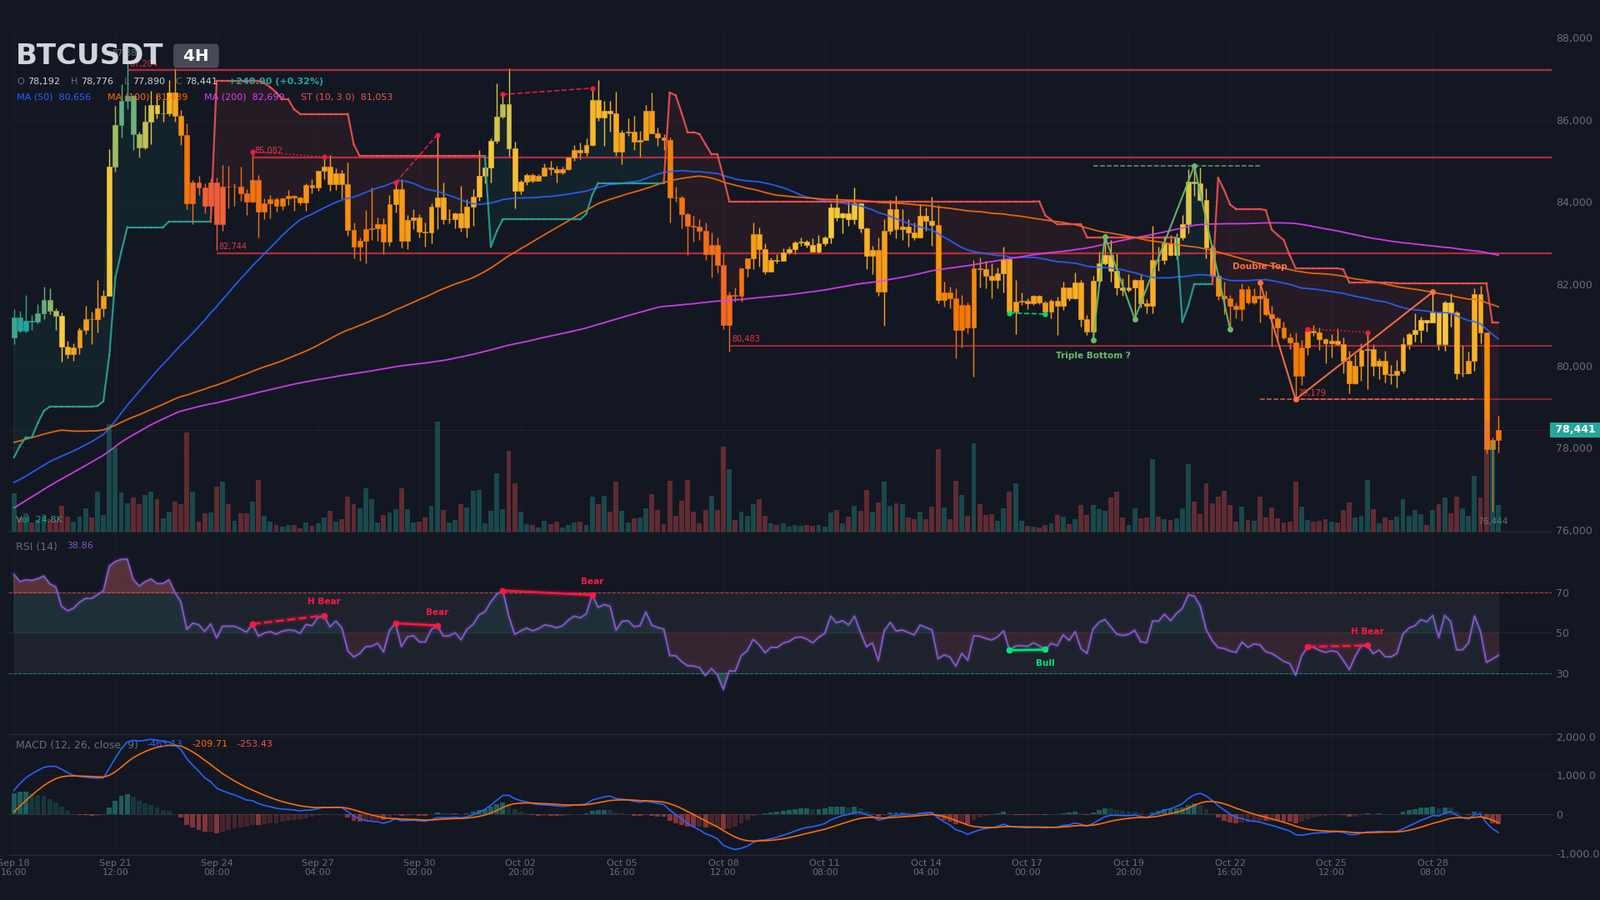
The H4 structure is descending. Highs on October 28 and 29, between $81,800 and $81,950, are capped below the $82,700 zone, and the $76,444 low has swept most of the recent lows. Price trades below its SMA 20 (≈ $80,270), SMA 50 (≈ $80,660) and SMA 200 (≈ $82,700). The SuperTrend is bearish at about $81,050. The MACD crossed down on October 29 at 20:00, below zero, with a negative histogram, and RSI sits near 39.
The bearish double top is confirmed, with a neckline at $79,180 and a target at $76,440, which the day’s low nearly matched to the dollar. A bullish triple bottom, with a neckline at $84,880 and a target at $88,860, is not confirmed. A hidden bearish divergence, a continuation signal, is flagged between October 24 and 26. Detected resistances stack at $79,180, $80,480 (2 contacts), $82,740 (3 contacts) and $85,080. Volume on the current candle is at 88% of average, and the ATR (14) is around $1,100, a useful yardstick for sizing a stop.
Intraday Structure (15m): V-Shaped Rebound and Completed Head and Shoulders
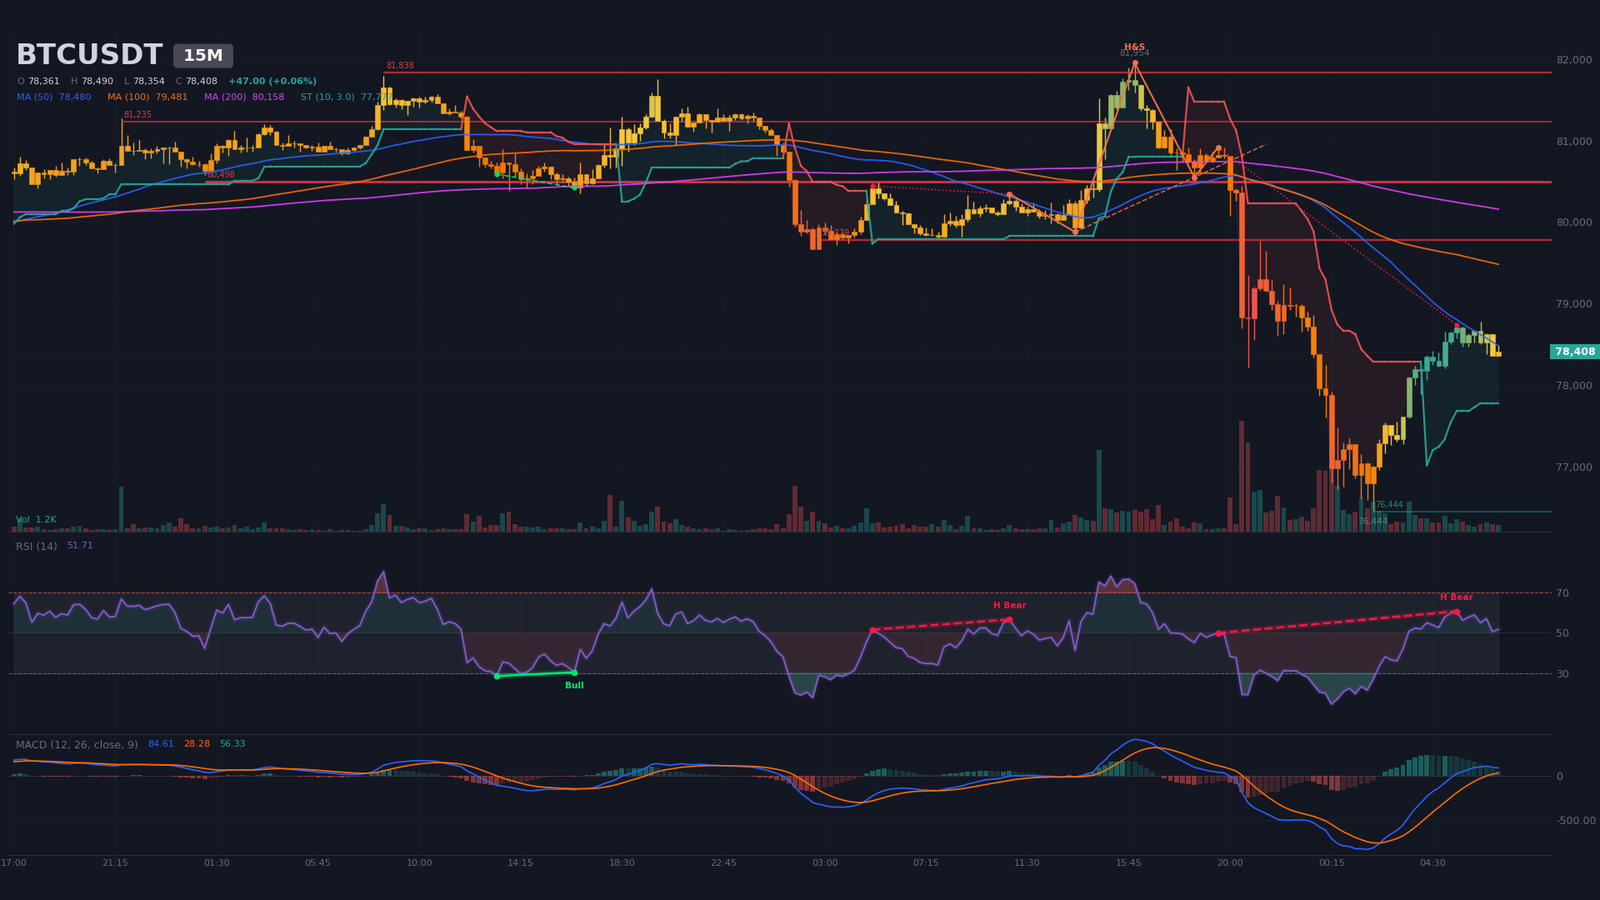
On the 15-minute chart, the rebound takes a V shape. After the $76,444 low at 02:00, the lows climb, to $78,205 at 05:00 and $78,467 at 05:45, while highs keep stalling below $78,780 at 06:30. The compression therefore sits between $78,200 and $78,780. The MACD crossed up at 02:30, above zero, and RSI is near 52. Price trades above its SMA 20 (≈ $78,240) but below its SMA 50 (≈ $78,480) and SMA 200 (≈ $80,160). The SuperTrend is bullish at about $77,780. Volume is only 55% of average, a sign of a poorly supported bounce.
A bearish head and shoulders is confirmed, with a neckline at $80,550. Its target of $78,945 sits above the current price, so the pattern has already played out and no longer offers a clean objective. Immediate resistances are $79,780, $80,500 (6 contacts) and $81,240, while support is $76,444. A hidden bearish divergence is flagged between October 29 and 30. The M15 ATR (14) is close to $300.
Multi-Timeframe Synthesis
| Timeframe | Dominant trend | RSI (14) | MACD | Chart pattern |
|---|---|---|---|---|
| Daily (1D) | Bearish (correction below SMA 20 and SMA 50) | ~38 | Bearish crossover on 09/29, below zero | Confirmed double top (target reached) |
| 4 hours (4H) | Bearish | ~39 | Bearish crossover on 10/29, below zero | Confirmed double top |
| 15 minutes (15m) | Rebound and compression | ~52 | Bullish crossover on 10/30, above zero | $78,200 to $78,780 compression after completed head and shoulders |
Level Mapping: Technical Levels and Pivots
The map combines classic daily and H4 pivots, detected resistances and supports, pattern targets and estimated liquidation pockets. Fibonacci extensions are not used, as the reference impulse cannot be isolated in the available swings. The short-term central pivot is the daily pivot at $79,260: while price stays below it, selling pressure dominates, and a return above it would open the $79,800 to $80,550 zone.
| Level | Price (USD) | Category | Technical basis |
|---|---|---|---|
| Major resistance 3 (R3) | $84,100 to $85,100 | Resistance | Daily SuperTrend $84,080, double bottom neckline $84,340, H4 triple bottom $84,875, estimated short pocket $84,970 to $85,100 |
| Major resistance 2 (R2) | $82,300 to $83,150 | Resistance | Daily resistance $82,283, H4 $82,744 (3 contacts), double top neckline $82,500, estimated short pockets $82,530 to $83,140 |
| Immediate resistance (R1) | $79,800 to $80,550 | Resistance | M15 $79,779 and $80,498 (6 contacts), H4 $80,483, head and shoulders neckline $80,550 |
| Central pivot (P) | $78,900 to $79,300 | Pivot | Daily pivot $79,262, H4 neckline $79,179, head and shoulders target $78,945 |
| Immediate support (S1) | $76,400 to $77,000 | Support | October 30 low at $76,444, H4 double top target $76,440, daily S1 $76,569, H4 S1 $77,010 |
| Major support 2 (S2) | $74,900 to $75,450 | Support | Daily support $74,909, daily S2 $75,176, estimated long pocket $75,300 to $75,430 |
| Major support 3 (S3) | $73,100 to $74,420 | Support | Estimated long pockets $74,150 to $74,420 and $73,470 to $73,680, daily SMA 200 $73,133 |
Order Book and Liquidity Heatmap
Order book coverage stands at only 1.21% around the price, which limits the reading to the immediate vicinity. Sell walls sit at $78,440 ($73.9M, 0.04% above price), $78,510 ($24M) and $78,580 ($5.7M), facing buy walls at $78,370 ($27.4M) and $78,310 ($30.5M). Within 2%, bids total $73.4M against $108.7M of asks, a 19.4% imbalance in favor of sellers.
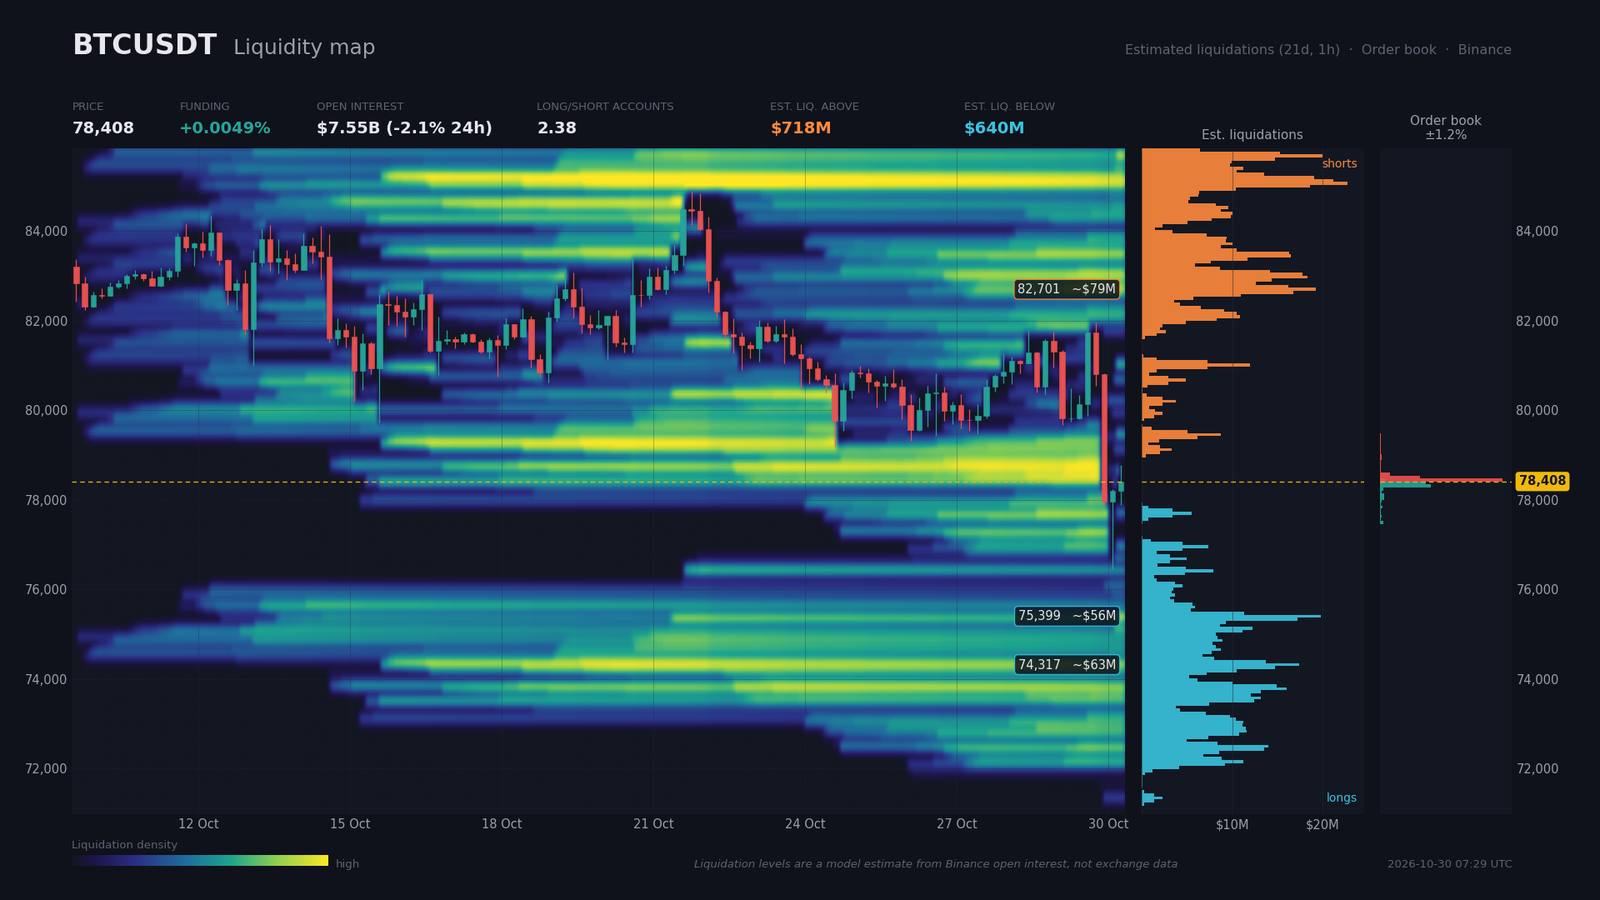
Estimated liquidation zones, derived from a model rather than measured data, are almost symmetrical. Above the price, shorts cluster between $82,530 and $82,870 (≈ $79M, 5.5% above price), between $82,940 and $83,140 (≈ $63M) and between $84,970 and $85,100 (≈ $54M), for an estimated total of $718M. Below, longs sit between $75,300 and $75,430 (≈ $56M, 3.8% below price), between $74,150 and $74,420 (≈ $63M, 5.2% below price) and between $73,470 and $73,680 (≈ $45M), for an estimated total of $640M.
Funding is low at 0.0049% per period, or 5.3% annualized. Open interest reaches $7.55B, down 2.1% over 24 hours and 2.55% over seven days, so deleveraging remains moderate. The long/short ratio stands at 2.38 across accounts and 1.75 among top traders, while the taker buy/sell ratio of 0.935 points to selling pressure. Long dominance therefore remains fuel for a decline, since longs still sit below the price. A short squeeze toward the $82,500 to $83,150 pocket remains possible, but it would first require reclaiming $80,550, a prior liquidity sweep.
Calendar: Catalysts to Watch
The event most likely to pull price out of its structure is the combination of the monthly Deribit expiry at 09:00 and the CME futures settlement at 16:00 today. It will be followed by the ISM and JOLTs data from November 2 to 4, then by the reopening of Binance withdrawals, announced within 48 hours.
- Friday, October 30, 09:00 (Zurich): monthly BTC/ETH options expiry on Deribit (consensus not applicable). Stakes: volatility risk and “pinning” around strikes.
- Friday, October 30, 16:00 (Zurich): monthly CME futures settlement. Stakes: possible basis dislocation and institutional repositioning.
- Saturday, October 31, 02:30 (Zurich): China manufacturing PMI (consensus 50; previous 50.1). Stakes: Asian risk appetite.
- Monday, November 2, 15:00 (Zurich): ISM manufacturing employment (previous 52.7). Stakes: read on US economic strength and the rate path.
- Tuesday, November 3, 01:00 and 16:00 (Zurich): US midterm elections, followed by JOLTs (previous 7.079). Stakes: political volatility and labor market signals.
- Wednesday, November 4, 15:00 (Zurich): ISM services (previous 54.9). Stakes: confirmation or rejection of the high-rate scenario.
Three Scenarios for the Coming Weeks
The three scenarios below describe possible paths from a common starting point. The probabilities, set by the analyst, total 100%, and each should be read against the levels and catalysts outlined above.
Scenario A — Rejection Below $79,800 to $80,550 and Retest of Lows (probability 45%)
The most likely scenario extends the bearish logic. The trigger is a failed rebound below the M15 resistance at $79,780, followed by a fresh H4 close below $77,000. The catalyst is the volatility around the Deribit expiry and the October 30 CME settlement, then the ISM and JOLTs releases. The path leads first to $76,570 (daily S1), then to the estimated long pocket between $75,300 and $75,400, and finally to $74,900. Execution zone: sell rallies between $79,400 and $80,000. Invalidation: H4 close above $80,920 (October 29 swings), roughly a $1,100 stop. R:R ≈ 2.5 on the first target.
Scenario B — Rebound Range and Liquidity Sweep (probability 35%)
This scenario assumes the $76,400 to $77,000 zone holds, followed by a sweep of the $79,780 and $80,500 resistances. The trigger is therefore a defense of the low, without a single macro catalyst. The path targets $78,900, then $79,800, with a possible extension toward $80,500: a liquidation rebound rather than a trend reversal. Execution zone: buy between $76,600 and $77,000. Invalidation: H4 close below $75,600. R:R ≈ 1.8 toward $79,800.
Scenario C — Invalidation of the Bearish Structure (probability 20%)
This scenario requires an H4 close above $82,750, a level tested three times, with a reclaim of the $82,500 double top neckline neutralizing the pattern. A squeeze fueled by the reopening of Binance withdrawals and a softer reading of US data could be the engine. The path leads to $83,000, an estimated short zone, then to $84,340 to $84,880, where the neckline of the bullish patterns sits, and finally to $85,070. Execution zone: retest between $82,300 and $82,750. Invalidation: H4 close below $81,200, roughly a $1,300 stop. R:R ≈ 1.7 toward $84,900.
Summary and Conclusion
The market is exiting a distribution phase that began at the September 21 peak of $87,385, and is going through a leverage purge triggered by the Binance hack. The targets of both double tops, $77,680 on the daily and $76,440 on the H4, have been reached, which favors a rebound. However, rebound volume on M15 is weak at 55% of average, open interest remains elevated at $7.55B, the order book leans toward sellers and macro stays restrictive. Until $79,800 to $80,550 is reclaimed, the rebound remains just a rebound, and nothing yet confirms a reversal. Estimated liquidation pockets are nearly symmetrical, with $718M above and $640M below, leaving the direction open.
The dominant technical strategy is to sell rebounds toward $79,400 to $80,000 while price stays below $80,550, with protection above $80,920 on an H4 close. An H4 close above $82,750 would force a renunciation of the bearish bias. Critical levels remain $76,400 to $77,000 (day’s low and immediate support), $79,800 to $80,550 (key resistance and head and shoulders neckline), $82,300 to $83,150 (bullish pivot and estimated short pockets), $74,900 to $75,450 (major support and estimated long pocket) and $73,100 (daily SMA 200).
Sources
- Strategy Eyes More Bitcoin Buys With $30B Credit Capacity — Cointelegraph, October 30, 2026
- Bitcoin slides below $77,000, BNB drops amid Binance hack — The Block, October 30, 2026
- Binance Halts Withdrawals, Confirms Hack Of $6.3 Billion — Bitcoin Magazine, October 29, 2026
- Live Updates: Binance Losses Estimated at $6.3B amid Major Crypto Hack — Cointelegraph, October 29, 2026
- North Korea linked to $6.3B Binance hack by crypto investigators — Cointelegraph, October 30, 2026
- BOJ holds rates as underlying inflation aligns with 2% target for first time since 2013 — CNBC, October 30, 2026
- Fed meeting recap: Warsh says central bank will host fewer rate-setting meetings — CNBC, October 28, 2026
- Bitcoin Tests Key Support as Fed Decision Looms — Bitfinex blog, October 26, 2026
- SEC Proposal Would Address How Investment Advisers and Funds Can Custody Crypto Assets — SEC.gov, October 1, 2026 (search-engine date, not confirmed)
- Fidelity’s Timmer Warns Rising Rates Can Hurt Stocks Unless Earnings Keep Pace — BeInCrypto, October 30, 2026
- Hack historique de Binance : Elon Musk prédit le même coup aux IA — Journal du Coin, October 30, 2026
Disclaimer: This article is for educational and informational purposes only. It does not constitute investment advice, a recommendation to buy or sell, or an invitation to trade any financial asset. Cryptocurrency markets are extremely volatile; any investment decision should be based on your own research (DYOR) and, where appropriate, the advice of a licensed financial adviser.

