


At the end of October, Bitcoin trades at $80,900, about 7.4% below the recent high of $87,385 set on September 21. The period low of $57,759 lies far behind, a gain of roughly 40% from that base, but the market is now consolidating. Price sits below the daily 20- and 50-period moving averages (SMA20 and SMA50, near $81,900), below the neckline of a confirmed double top at $82,500, and above a $79,200–$79,500 floor tested three times in four days.
The immediate driver is derivatives positioning, which remains cautious. Funding is slightly positive at 0.0065%, or roughly 7% annualized, and open interest stands at $7.77B (up 0.26% over 24 hours, down 1.25% over seven days). According to CoinDesk (October 27), liquidations fell 13% to $133M and the taker ratio is nearly balanced. Options point to protective demand: the $72,000 put expiring December 25 is the most traded contract, and 25-delta skews remain positive across all expiries (CoinDesk, October 27).
ETF flows and macro data weigh more heavily. US spot ETFs recorded $487M of outflows on October 7, the worst session since June 25 (CoinDesk, October 8), and more than $1B of outflows accumulated in October across Bitcoin and Ether (CryptoTicker, October 10). The Fed, which raised rates by 25 bp in September, is expected to hold in the 3.75–4% range, with roughly a 90–92% probability according to CME FedWatch (CNBC, October 27). A signal of further hikes under Kevin Warsh remains possible, while the 10-year yield sits at 4.99% and the 2-year at 4.74%.
Recent releases were mixed. On October 23, Japanese core inflation came in at 2.1%, in line with consensus, with no notable reaction, while UK retail sales fell 0.4% against a consensus of -0.1%. On October 27, US core durable goods rose 1.8% against a consensus of 1.5% (prior 0.1%); Bitcoin slipped back below $80,000 the same day (CoinDesk, October 27), without a demonstrated correlation.
This backdrop partly neutralizes the technical signal. The reading that follows is therefore one of structure rather than direction: the bias is neutral with a slight bearish tilt below $82,500, conviction is low, and confluence scores 2 out of 5.
Multi-Timeframe Technical Analysis
Daily Timeframe (1D): Consolidation Below a Confirmed Double Top
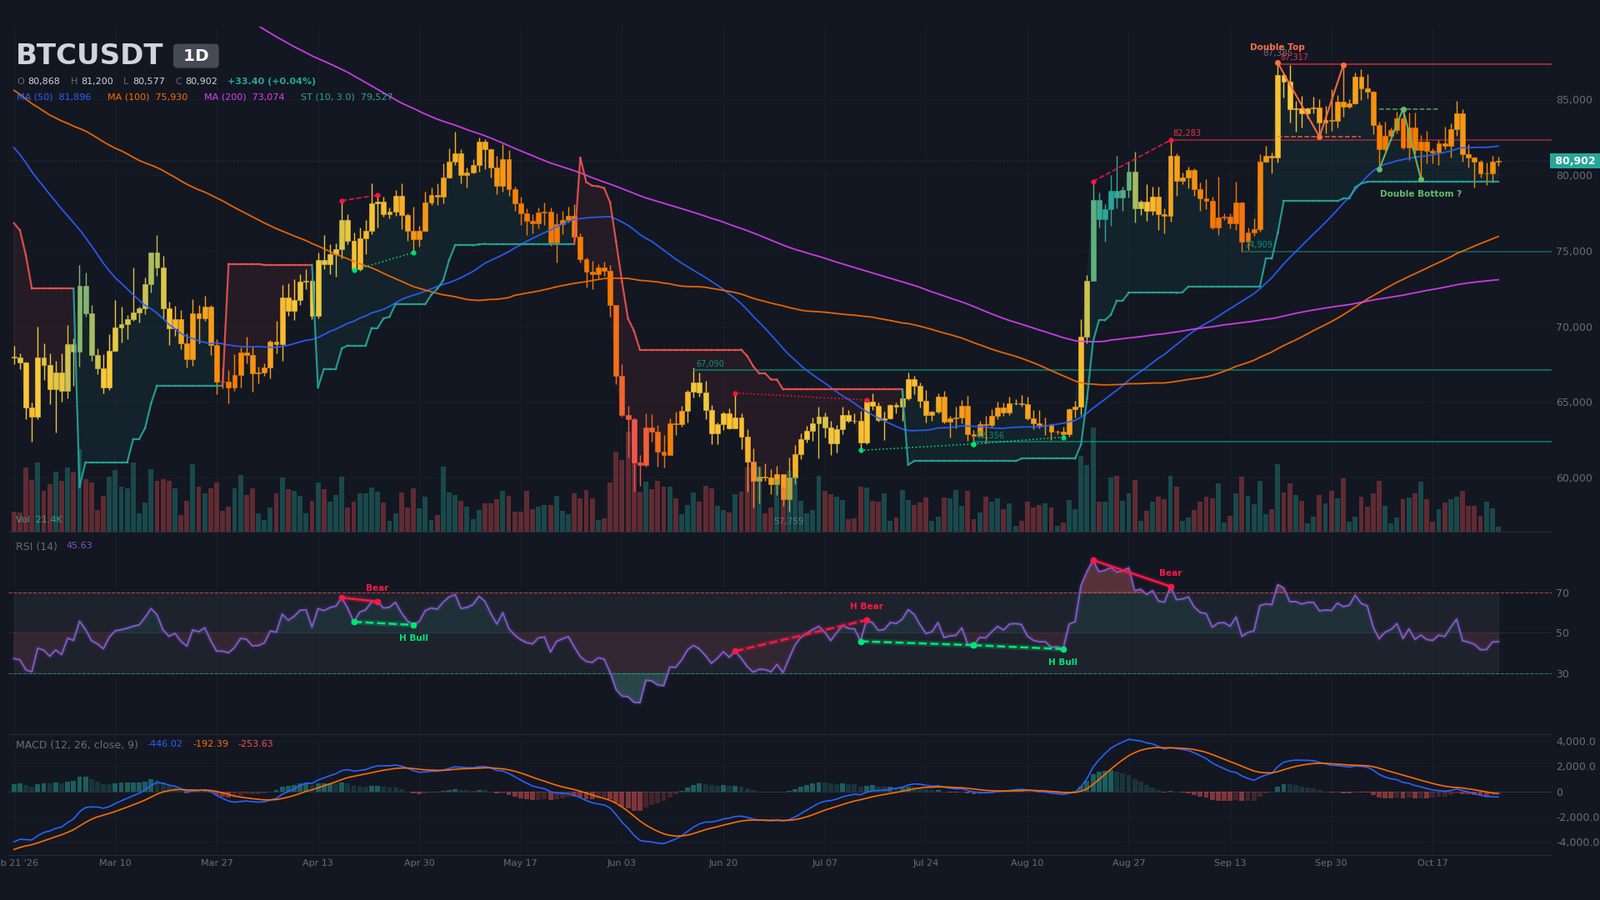
On the daily chart, the phase follows the August–September impulse. Rallies are losing steam, with peaks at $84,340 on October 12 and $84,875 on October 21, while lows drift toward $79,200. Price remains well above the SMA200 (near $73,100), with no recent 50/200 crossover, and the SuperTrend stays bullish at $79,530.
The detector flags a confirmed bearish double top, formed by the September 21 and October 2 highs, with a neckline at $82,500 and a target at $77,680. A bullish double bottom, with a neckline at $84,340 and a target at $88,640, remains an unconfirmed hypothesis. With price below $82,500, the first scenario takes precedence. A regular bearish divergence between August 21 and September 3, with RSI falling from 86 to 73 while price rose from $79,560 to $82,280, is older and adds no active signal.
The RSI (relative strength index) sits near 46, a neutral zone. The MACD remains below its signal line and below zero since the bearish crossover of September 29, with a negative histogram. The volume of the current candle, at 17% of its average, is too partial to interpret. The ATR14 (average true range) is about $1,930, or 2.4%, which sets the scale of daily moves.
Intermediate Dynamics (4H): Compression on a Contested Neckline
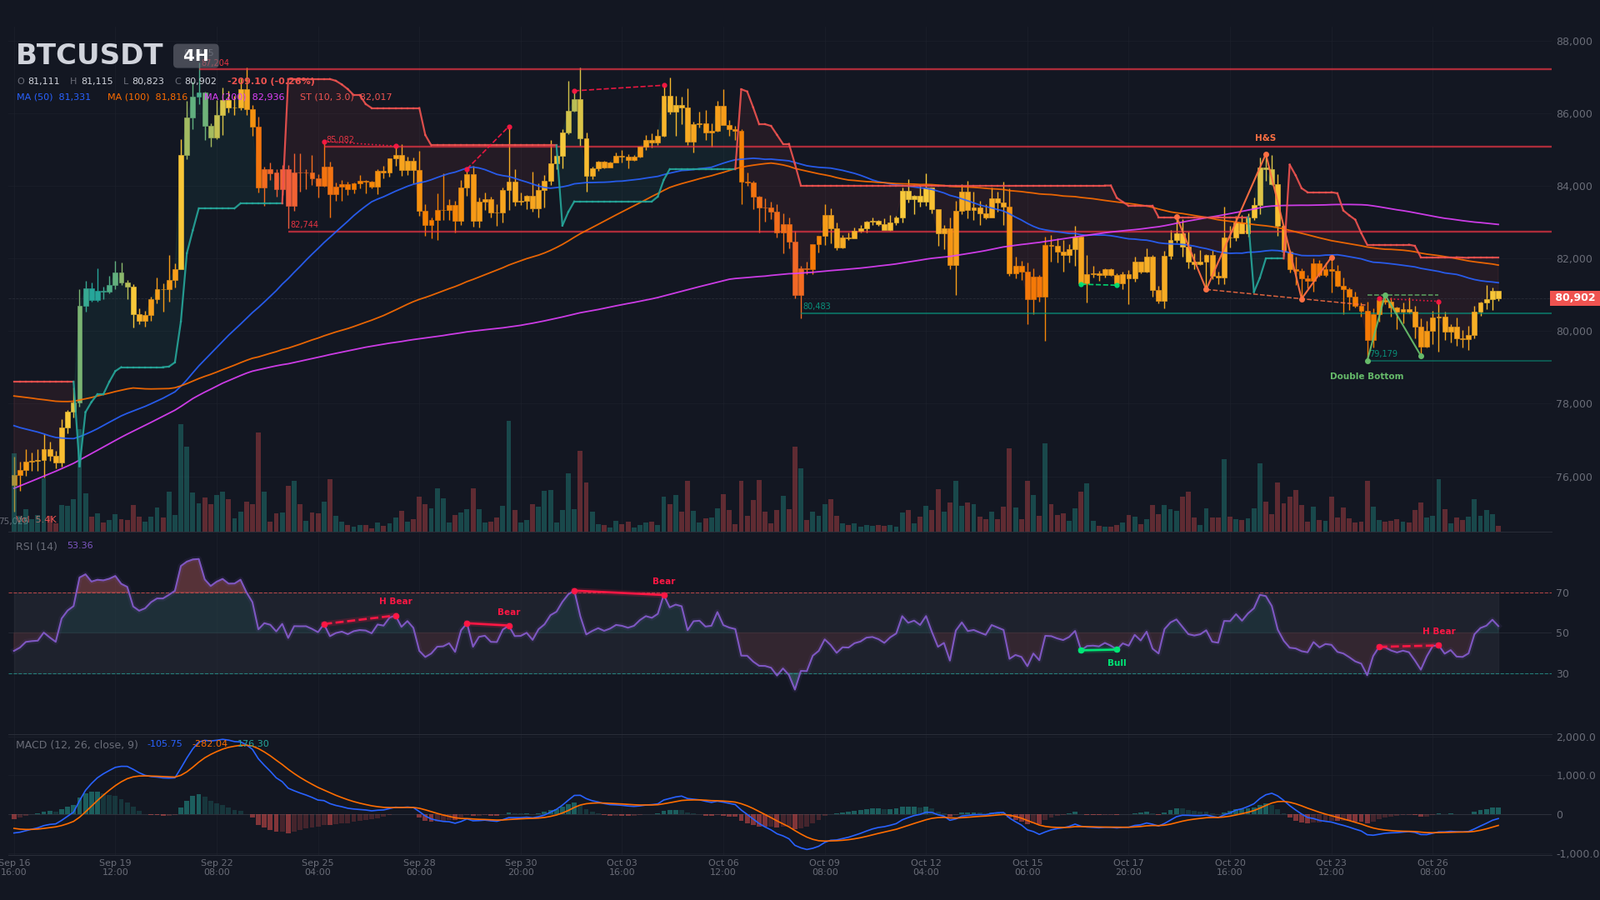
The 4-hour chart nuances the daily picture. Lows have been rising since October 26 ($79,320, $79,430, $79,470), and the MACD crossed bullish that day, with a positive histogram still below zero. RSI is near 53. Price is above the SMA20 (near $80,370) but below the SMA50 (near $81,330) and SMA200 (near $82,940), and the bearish 4H SuperTrend sits at $82,020.
Two confirmed patterns contradict each other. A double bottom (neckline $81,000, target $82,750) faces a bearish head and shoulders (neckline $80,890, target $76,920). Price hugs both lines, a sign of equilibrium rather than direction, and a hidden bearish continuation divergence is flagged between October 24 and 26. Supports sit at $80,480 (two contacts) and then $79,180; resistances at $82,740, $85,080 and $87,200 carry three contacts each. Volume is at 33% of its average and the ATR14 near $690.
Intraday Structure (15m): A Compression Wedge Ahead of the Fed
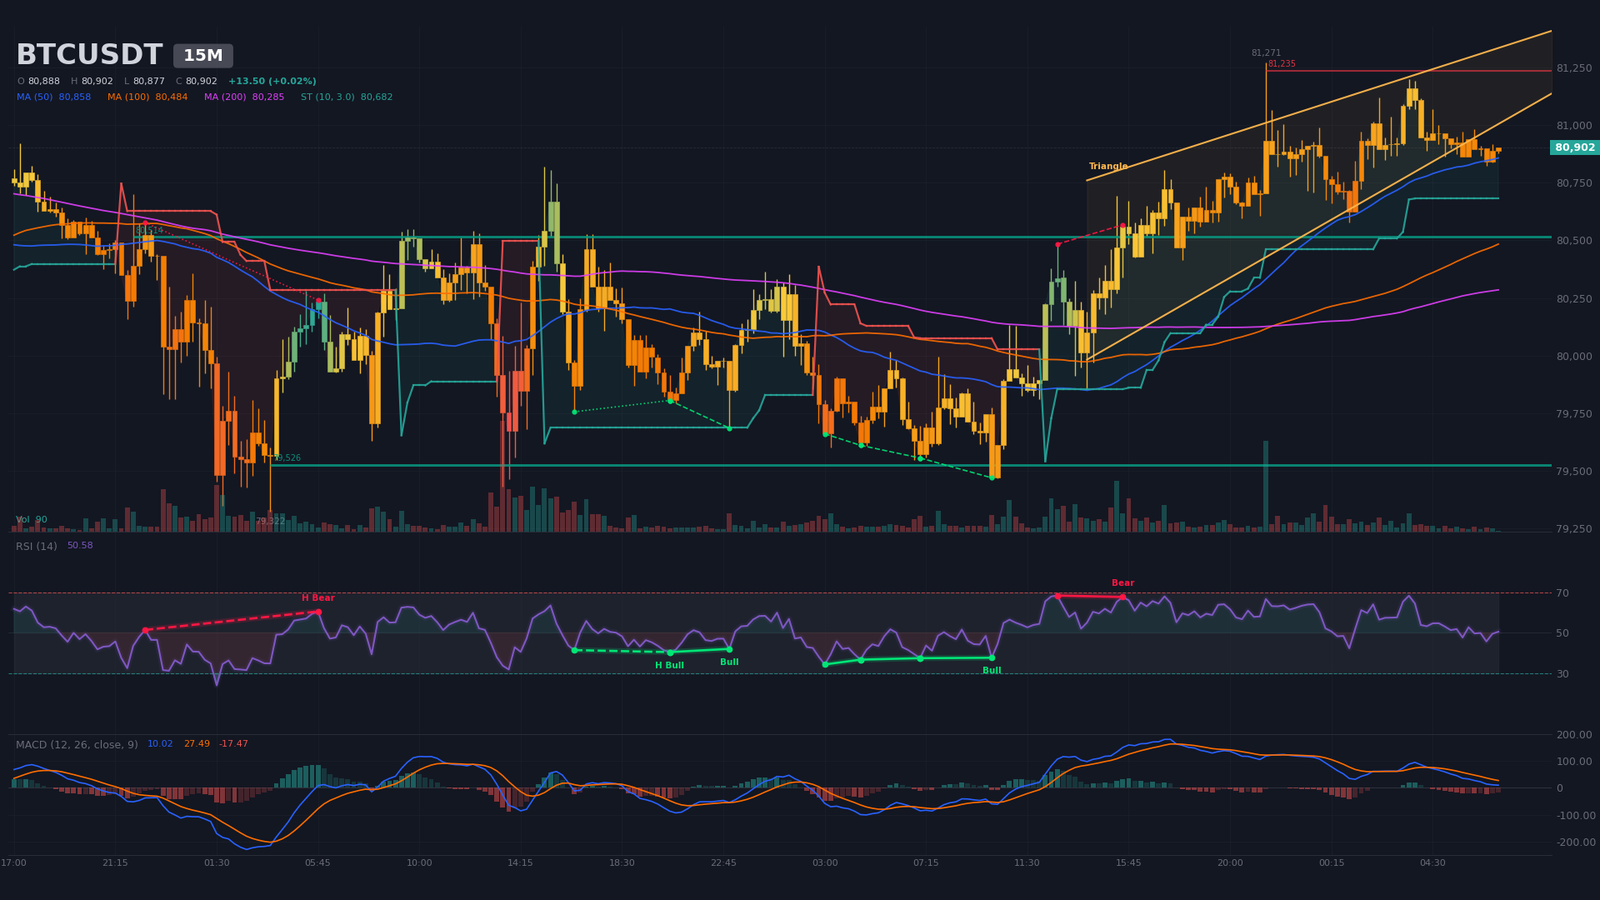
The 15-minute chart shows a compression wedge since October 27, with an upper boundary near $81,260 and a lower boundary near $80,870. The apex is estimated at the end of the day on October 28, just before the Fed decision. Price hugs the lower boundary, the M15 SuperTrend is bullish at $80,680, and the SMA20, SMA50 and SMA200 are squeezed between $80,285 and $80,950. The MACD, still above zero, crossed bearish with a contracting negative histogram. RSI is near 51 and volume at 15% of average. Supports are at $80,510 (eight contacts) and $79,530 (seven contacts), with resistance at $81,235. With an M15 ATR near $105, traders should wait for a close outside the wedge before acting.
Multi-Timeframe Synthesis
| Timeframe | Dominant Trend | RSI (14) | MACD | Chart Pattern |
|---|---|---|---|---|
| Daily (1D) | Consolidation with a bearish tilt | ~46 | Bearish crossover on Sept. 29, below zero | Confirmed double top |
| 4 hours (4H) | Range with rising lows | ~53 | Bullish crossover on Oct. 26, below zero | Double bottom vs. head and shoulders, both confirmed |
| 15 minutes | Neutral compression | ~51 | Bearish crossover on Oct. 28, contracting | Compression wedge |
Key Price Levels and Pivots
Levels draw on classic daily pivots, detected supports and resistances, pattern targets and estimated liquidation pockets. No Fibonacci extension is retained, since no clear reference impulse can be identified. The central short-term pivot sits between $80,500 and $80,900; resistance at $84,900–$85,300 (October 21 swing, estimated short pockets) and support at $74,900 remain secondary reference points.
| Level | Price (USD) | Category | Technical Basis |
|---|---|---|---|
| Major resistance 3 (R3) | $87,200 – $87,400 | Resistance | September 21 swing high ($87,385), daily resistance with 2 contacts, H4 at $87,204 |
| Major resistance 2 (R2) | $82,300 – $82,750 | Resistance | Double top neckline ($82,500), H4 resistance with 3 contacts ($82,744), estimated short pocket $82,580–$82,755 |
| Immediate resistance (R1) | $81,200 – $81,900 | Resistance | M15 resistance ($81,235), daily R1 ($81,603), daily SMA20 and SMA50 |
| Central pivot (P) | $80,500 – $80,900 | Pivot | Daily P ($80,536), H4 head and shoulders neckline ($80,889), H4 support ($80,483), M15 pivot ($80,881) |
| Immediate support (S1) | $79,200 – $79,800 | Support | Daily S1 ($79,801), daily SuperTrend ($79,527), October 24 low ($79,179), estimated long pocket $79,048–$79,181 |
| Major support 2 (S2) | $78,400 – $78,900 | Support | Estimated long pocket $78,387–$78,828 (~$160M), daily S2 ($78,733) |
| Major support 3 (S3) | $76,900 – $77,700 | Support | Double top target ($77,683), H4 head and shoulders target ($76,919) |
Order Book and Liquidity Heatmap
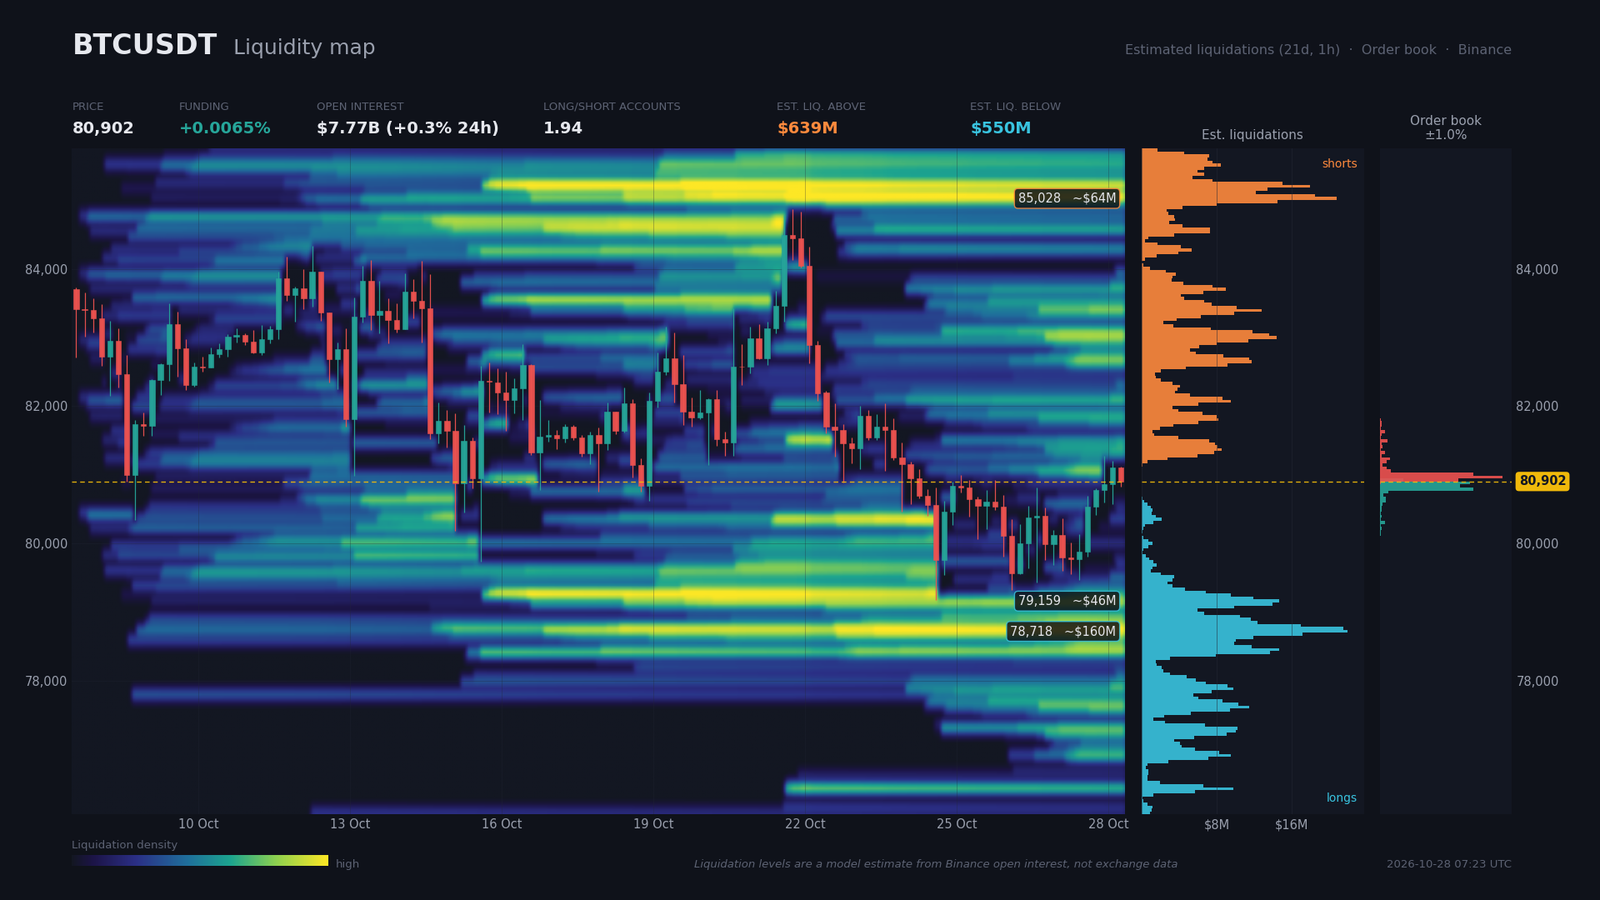
The order book covers only about 1% around the price, which limits the reading. Sell walls sit at $80,924 ($16.6M), $80,968 ($25.9M) and $81,012 ($19.8M), up to +0.14%. Buy walls are at $80,880 ($19.1M), $80,836 ($17.0M) and $80,792 ($19.9M), down to -0.14%. Within 2% of the price, bids total $68.3M against $75.9M of asks, an imbalance of -5.3% that reflects mild selling pressure.
Estimated liquidation zones, derived from a model and not measured, place short positions between $82,580 and $82,755 (~$48M, or +2.2%) and between $84,960 and $85,270 (~$120M cumulative, +5.1% to +5.3%), for roughly $639M in total. Below the price, long positions cluster at $79,050–$79,180 (~$46M), $78,870–$78,960 (~$29M) and above all at $78,390–$78,830 (~$160M, -2.7%), for about $550M. Long/short ratios stand at 1.94 for accounts and 1.80 for top traders, with a taker buy/sell ratio of 0.97: long positioning remains the majority.
Mechanically, price is magnetized in both directions. A liquidity sweep toward $78,400–$78,900 is plausible, with a denser pocket below the price than above (to be confirmed), especially in the event of a restrictive decision. Conversely, a break above $82,750 could trigger a short squeeze toward $85,000.
Calendar: Catalysts to Watch
Only events likely to shift the price structure are retained. The releases of October 23 and 27 have already been absorbed by the market.
- Wednesday, October 28, 19:00 (Zurich) — FOMC and policy rate (consensus 4%, top of range; prior 4%): Kevin Warsh’s tone on future hikes is the key factor, a restrictive message threatening $79,200, a softer tone opening $82,500.
- Thursday, October 29, 13:30 (Zurich) — core PCE m/m (consensus 0.3%, prior 0.2%), advance GDP q/q (3.5% vs. 6.1%), personal income (0.6% vs. 0.9%) and weekly jobless claims (199 vs. 194): the PCE is the pivot of the session.
- Thursday, October 29, 14:15 (Zurich) — ECB, deposit rate expected at 2.5% (unchanged): a second-order effect on global liquidity.
- Friday, October 30, 04:00 (Zurich) — BoJ, rate expected at 1.25% (unchanged): yen risk for risk assets.
The FOMC decision, extended by the October 29 PCE, is the event most likely to pull price out of its structure.
Three Scenarios for the Coming Weeks
The three scenarios below carry the analyst’s probabilities, which total 100%. The first extends the bearish consolidation, the second describes a trap followed by a rebound, and the third a bullish invalidation of the double top.
Scenario A — Rejection Below the Neckline, Retest of the Floor (probability 45%)
The trigger is the FOMC on October 28 at 19:00, specifically a rejection between $81,500 and $82,000, which coincides with the daily R1 and the SMA20 and SMA50. The path leads to $79,800, then $79,200, then $77,680, the double top target. The stop sits beyond the invalidation, at more than one 4H ATR (~$690); with an entry at $81,700, a stop at $82,800 and a first target at $79,200, the risk-reward ratio (R:R) comes to about 2.3. Execution zone: sell between $81,500 and $82,000 after a confirmed rejection on the 4H. Invalidation: 4H close above $82,800, where the short pocket and the $82,744 resistance sit.
Scenario B — Liquidity Sweep Then Rebound (probability 30%)
The trigger is a wick toward $78,400–$78,900, inside the estimated long pocket of about $160M, followed by a recovery above $80,500 on the 4H. The path targets $80,900, then $82,700. The stop goes below the invalidation, at more than one 4H ATR. Execution zone: buy between $78,500 and $78,900 on confirmation. Invalidation: 4H close below $77,700, the double top target.
Scenario C — Bullish Invalidation (probability 25%)
The catalyst is a dovish FOMC or a PCE print on October 29 weaker than expected. The trigger is a 4H close above $82,750, then a daily close above $82,500, which would cancel the double top. The path leads to $84,340, the double bottom neckline, then $85,000–$85,270, estimated short pockets, and $87,300. Execution zone: $82,800 to $83,000 on a retest. Invalidation: a 4H close back below $81,500.
Summary and Conclusion
Bitcoin is consolidating beneath structural resistance: a confirmed double top on the daily chart, rising lows on the 4H and a 15-minute wedge that keeps tightening. ETF flows, with October outflows and a $110M rebound on October 26, along with the rate backdrop, neither confirm nor refute the trend. Accumulation by large wallets, with a record 20,338 wallets holding 10 to 10,000 BTC and more than 85,000 BTC added in three weeks (BigGo, October 16), remains an unconfirmed support, especially since smaller holders are accumulating too, which Santiment notes has historically capped rallies. Regulatory progress is mixed: the SEC proposed a custody framework on October 1 while the Clarity Act remains stalled in the Senate. The 50% drop in Datavault AI stays an idiosyncratic case.
The dominant technical strategy is to wait for the Fed decision and the exit from the wedge before committing. The prudent bias is to sell rallies below $82,500, with protection above $82,800. A buy only becomes reasonable after a sweep toward $78,400–$78,900 or a 4H close above $82,750. Reference levels remain the $80,500–$80,900 zone, the $79,200 floor tested on October 24, 26 and 27, and the $77,680 downside target.
Sources
- Datavault AI stock plummets 50% after firm says it cannot withdraw bitcoin tied to $150 million deal — The Block, 27–28/10/2026
- VanEck launches diversified ETF combining stocks, bonds and Bitcoin exposure — Cointelegraph, 27/10/2026
- Bitcoin Price Rests Near $80,500 as Midterms, Fed Decision Loom — Bitcoin Magazine, 27/10/2026
- Stock futures are mixed as traders await Fed decision, Big Tech earnings — CNBC, 27/10/2026
- Wednesday’s big stock stories — CNBC, 27/10/2026
- How Investors Can Position Ahead of the Fed’s Next Policy Decision — CNBC, 27/10/2026
- Bitcoin dips below $80,000 as crypto ignores Asian tech rally and Fed meeting begins — CoinDesk, 27/10/2026
- Bitcoin ETFs bleed nearly $500 million in one day — CoinDesk, 08/10/2026
- Crypto ETF Outflows Pass $1 Billion in October — CryptoTicker.io, 10/10/2026
- Bitcoin Whale Wallets Reach Record 20,338 — BigGo Finance, 16/10/2026
- SEC Crypto Custody Rules Clarify Institutional Digital Asset Holders — The Cryptonomist, 02/10/2026
- Minutes of the FOMC, September 15–16, 2026 — federalreserve.gov, 07/10/2026
- Economic calendar provided (Zurich time), 28/10/2026
Disclaimer: This article is for educational and informational purposes only. It does not constitute investment advice, a recommendation to buy or sell, or an invitation to trade any financial asset. Cryptocurrency markets are extremely volatile; any investment decision should be based on your own research (DYOR) and, where appropriate, the advice of a licensed financial adviser.

