


Bitcoin trades at $79,675, roughly 8.8% below the period high of $87,385 reached on September 21. For a month, the price has moved in a $79,200–$87,400 range and has just broken the necklines of a daily double top and an H4 head and shoulders, both now confirmed. It is sitting on its last support, the $79,200–$79,550 zone, which combines the October 24 low, the S1 pivot and the daily SuperTrend.
Institutional flows remain the main driver. According to CoinDesk (October 8), US spot ETFs recorded $487.1M of outflows on October 7, the largest since June 25, after $2.65B of inflows in September. Bitcoin Magazine (October 26) cites outflows of about $635M on October 22. Strategy bought nothing between October 19 and 25 and spent $204.9M repurchasing STRC preferred stock, while Strive lifted its holdings to 43,000 BTC (The Block, October 27).
Macro dominates the agenda. The September FOMC minutes, released October 7, flagged inflation as the main risk, with two- and ten-year yields up roughly 35 basis points. Recent data were mixed: UK inflation reached 3.5% year on year on October 21, above the 3.4% consensus; Japanese core inflation came in at 2.1% on October 23, in line with forecasts; and US housing starts fell 5.2%, well below consensus, with no documented market reaction. Bitcoin slid from $84,875 on October 21 to $79,179 on October 24, with no demonstrated causal link to these releases. Regulation has had little direct price impact.
For the technical read, the signal is therefore two-sided: the patterns lean bearish, but the floor must hold into a decisive FOMC. In this bitcoin technical analysis, each timeframe should be read against the one above it.
Multi-Timeframe Technical Analysis
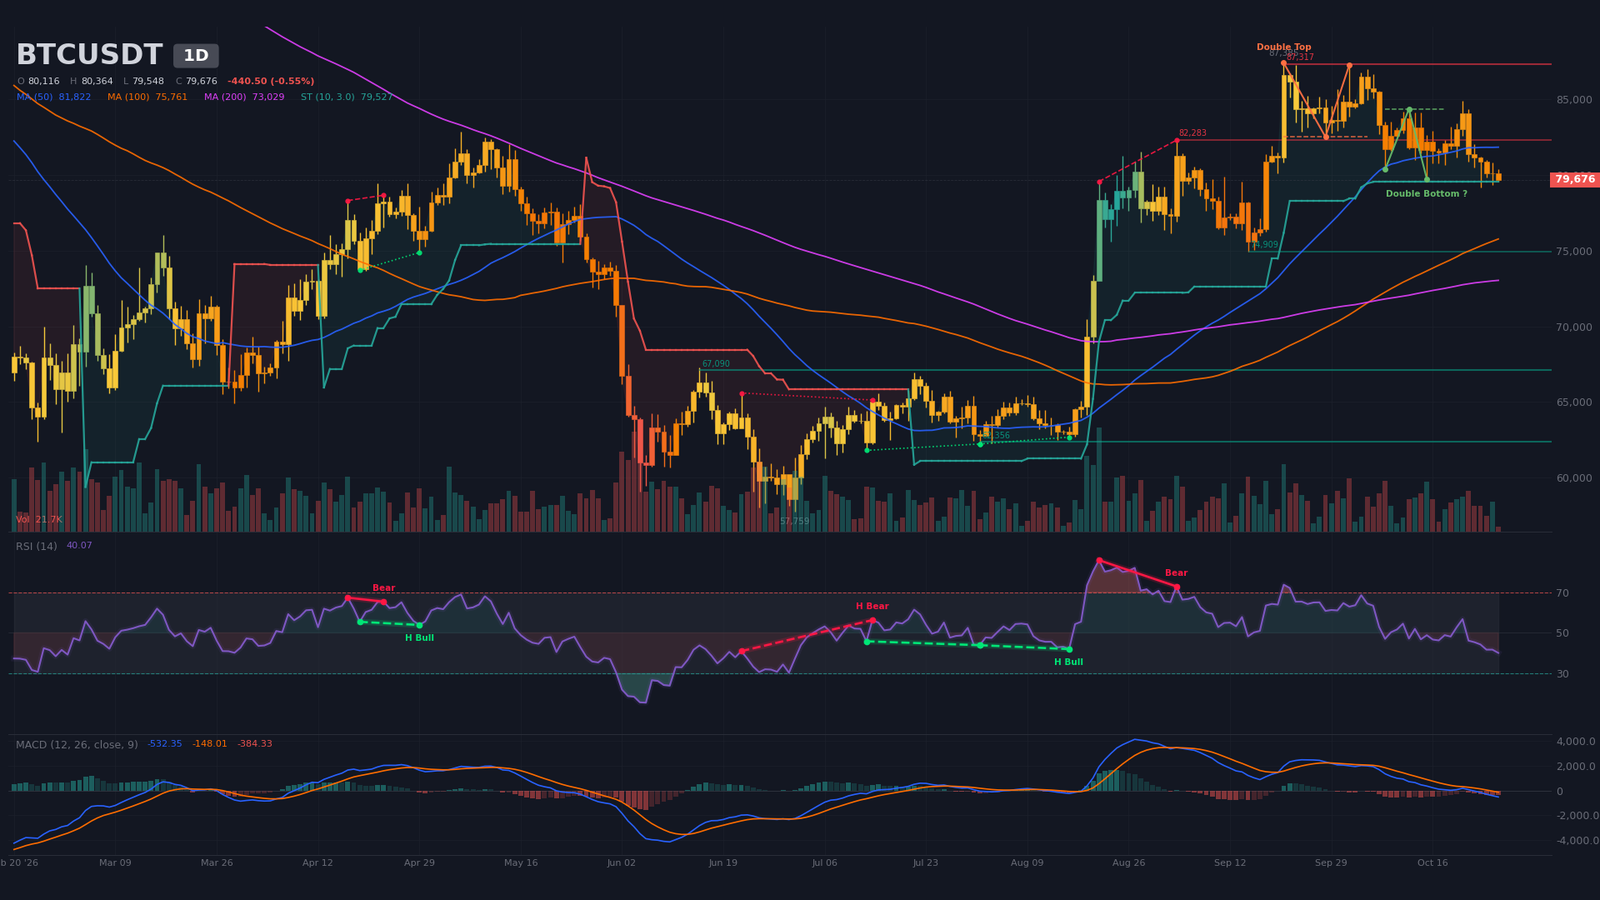
Daily Timeframe (1D): Confirmed Double Top Below $87,400
The phase is a consolidation with a distribution bias. Since the September 21 peak, highs have stepped down ($87,250, $86,980, $84,340, $84,880), and so have the lows ($82,830, $80,340, $79,730, $79,180). Price sits below the 20-period simple moving average (SMA20, about $81,850) and the SMA50 (about $81,820), which are converging, but above the SMA200 (about $73,030). The bullish 50/200 crossover of September 8 has held for 49 candles.
The confirmed pattern is a double top ($87,385 and $87,250) with a neckline at $82,500 and a measured objective at $77,680. A daily double bottom, with a neckline at $84,340 and an objective at $88,640, is detected but not confirmed and should be treated as a hypothesis. The daily SuperTrend, a trend-following trailing stop, remains bullish at $79,530, only 0.2% below the price: a daily close beneath it would flip the trend.
The RSI (relative strength index) sits at ~40, neutral and down from ~57, after a regular bearish divergence between August 21 and September 3. The MACD is below its signal line and below zero, with a bearish crossover dated September 29 and a negative histogram. Volume on the current, provisional candle is only 17% of its 20-period average, so no conclusion can be drawn yet.
Intermediate Dynamics (4H): Confirmed Head and Shoulders, Bearish SuperTrend
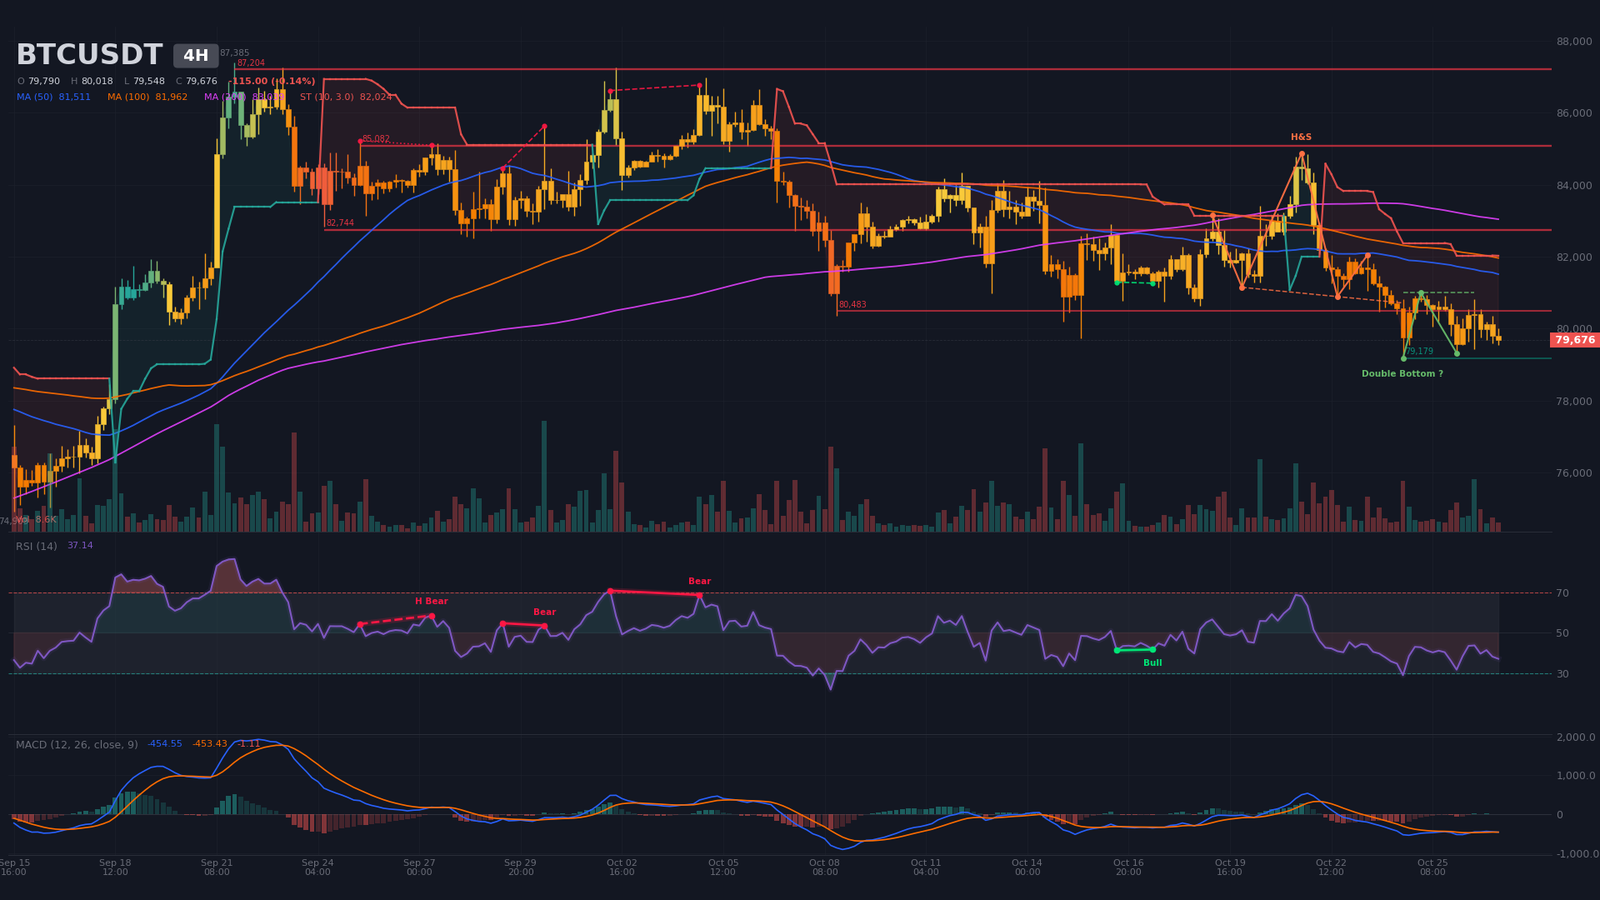
The 4H confirms and strengthens the daily bias. Price is below its SMA20 (about $80,320), SMA50 (about $81,510) and SMA200 (about $83,040), and the SuperTrend is bearish at $82,020. Highs keep descending ($82,010, $82,040, $81,000, $80,920, $80,820) while lows tighten between $79,180 and $79,430, a fragile base. The confirmed head-and-shoulders pattern has a neckline at $80,890 and an objective at $76,920; a 4H double bottom with a neckline at $81,000 and an objective at $82,750 remains unconfirmed.
The RSI is at ~37, close to oversold without reaching it. The bearish MACD crossover has just occurred, with a near-zero histogram: sell momentum is not yet expanding. Volume at 49% of its average shows that sellers lack conviction. Resistance to watch sits at $80,480 (two touches), $82,740 and $85,080 (three touches each).
Intraday Structure (15m): Compression Wedge Below $80,000
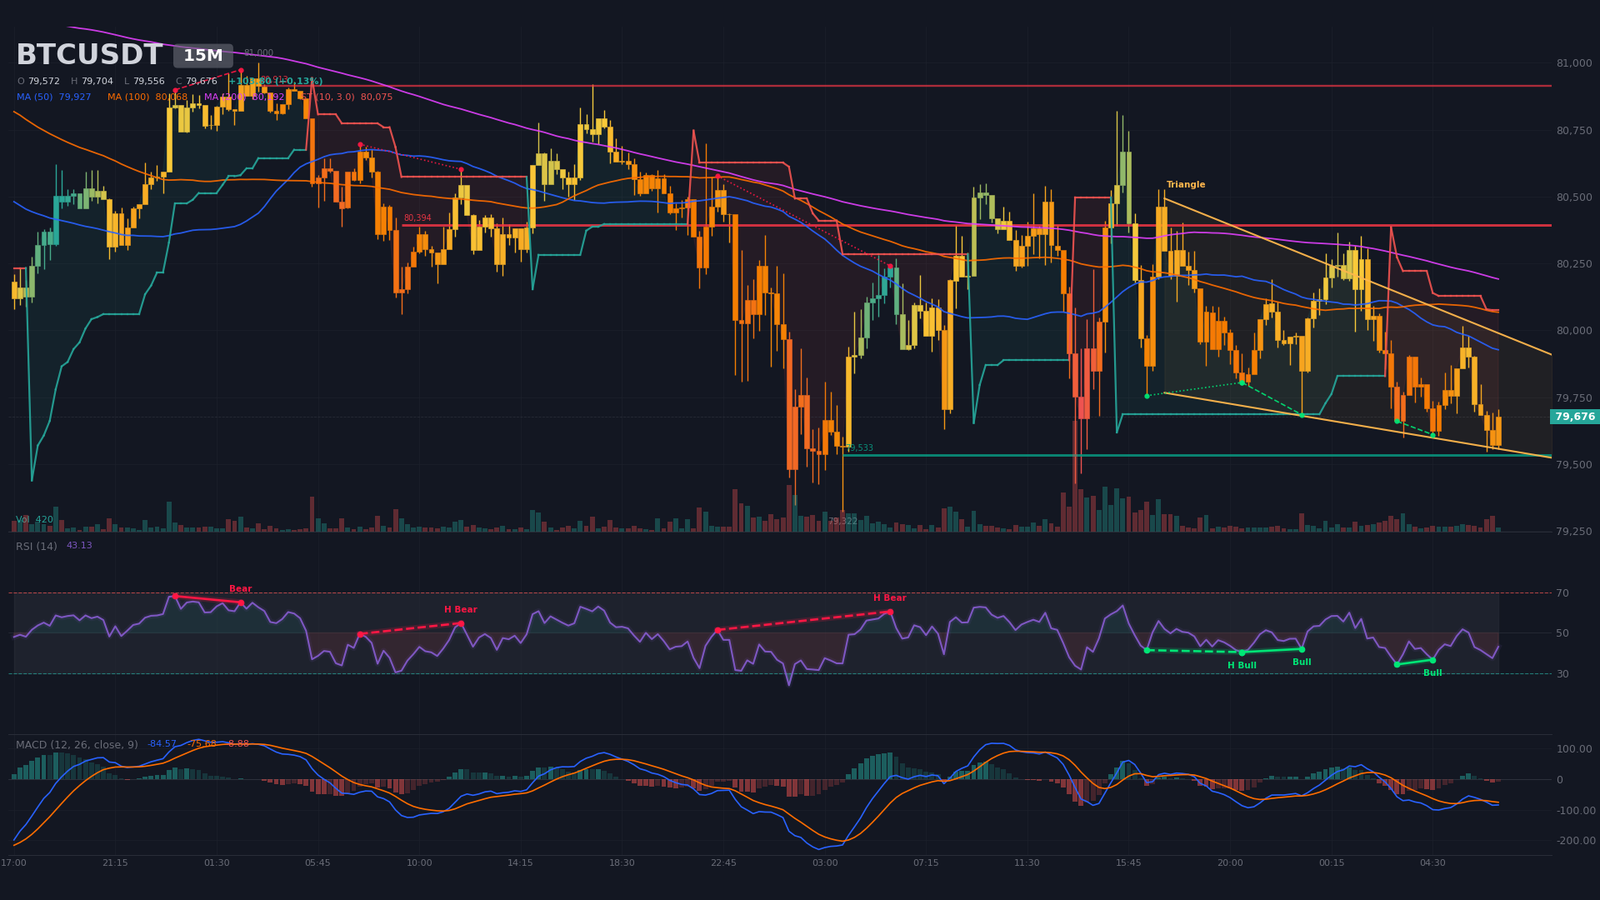
A wedge is detected on the 15-minute chart, with an upper boundary at $80,040, a lower boundary at $79,580 and an apex estimated on October 28 around 03:50. Price trades inside the structure, between support at $79,530 (five touches) and resistance at $80,390 (seven touches), below its moving averages and below a bearish SuperTrend at $80,080. The MACD crossed down on October 27 and the RSI is at ~43.
Two recent regular bullish divergences, on the evening of October 26 and the early hours of October 27, point to local seller exhaustion without a confirmed trigger. Volume at 54% of its average is typical of compression. An exit is expected before the apex, probably around the Fed decision.
Multi-Timeframe Summary
| Timeframe | Dominant Trend | RSI (14) | MACD | Chart Pattern |
|---|---|---|---|---|
| Daily (1D) | Bearish (distribution range) | ~40 | Below signal and zero, bearish crossover on September 29 | Confirmed double top |
| 4-hour (4H) | Bearish | ~37 | Bearish crossover on October 27, neutral histogram | Confirmed head and shoulders |
| 15-minute (15m) | Neutral (compression) | ~43 | Bearish crossover on October 27 | Wedge $79,580–$80,040 |
Key Levels and Pivot Map
The map combines classic daily pivots, swings across the three timeframes, detected supports and resistances, order-book walls and estimated liquidation pockets. No reference impulse stands out clearly enough to apply Fibonacci extensions. The short-term central pivot is the daily pivot at $80,090, which coincides with the upper boundary of the M15 wedge: above it, a rebound can take hold; below it, the decline extends.
| Level | Price (USD) | Category | Technical Basis |
|---|---|---|---|
| Major resistance 3 (R3) | $84,300–$85,100 | Resistance | Daily double-bottom neckline ($84,340), swing of October 21 ($84,875), H4 resistance ($85,080), estimated short pocket |
| Major resistance 2 (R2) | $82,300–$83,100 | Resistance | Daily resistance ($82,283), daily double-top neckline ($82,500), H4 resistance ($82,740), estimated short pocket |
| Immediate resistance (R1) | $80,400–$81,000 | Resistance | M15 resistance ($80,394, seven touches), H4 resistance ($80,483), head-and-shoulders neckline ($80,889) |
| Central pivot (P) | $79,900–$80,100 | Pivot | Daily pivot ($80,086), M15 wedge upper boundary ($80,044), M15 SuperTrend ($80,076) |
| Immediate support (S1) | $79,150–$79,550 | Support | October 24 low ($79,179), M15 support ($79,533), daily S1 pivot ($79,352), daily SuperTrend ($79,527) |
| Major support 2 (S2) | $78,580–$78,950 | Support | Densest estimated long pocket (about $134M), daily S2 pivot ($78,588) |
| Major support 3 (S3) | $76,900–$77,700 | Support | H4 head-and-shoulders objective ($76,919), daily double-top objective ($77,683) |
Order Book and Liquidity Heatmap
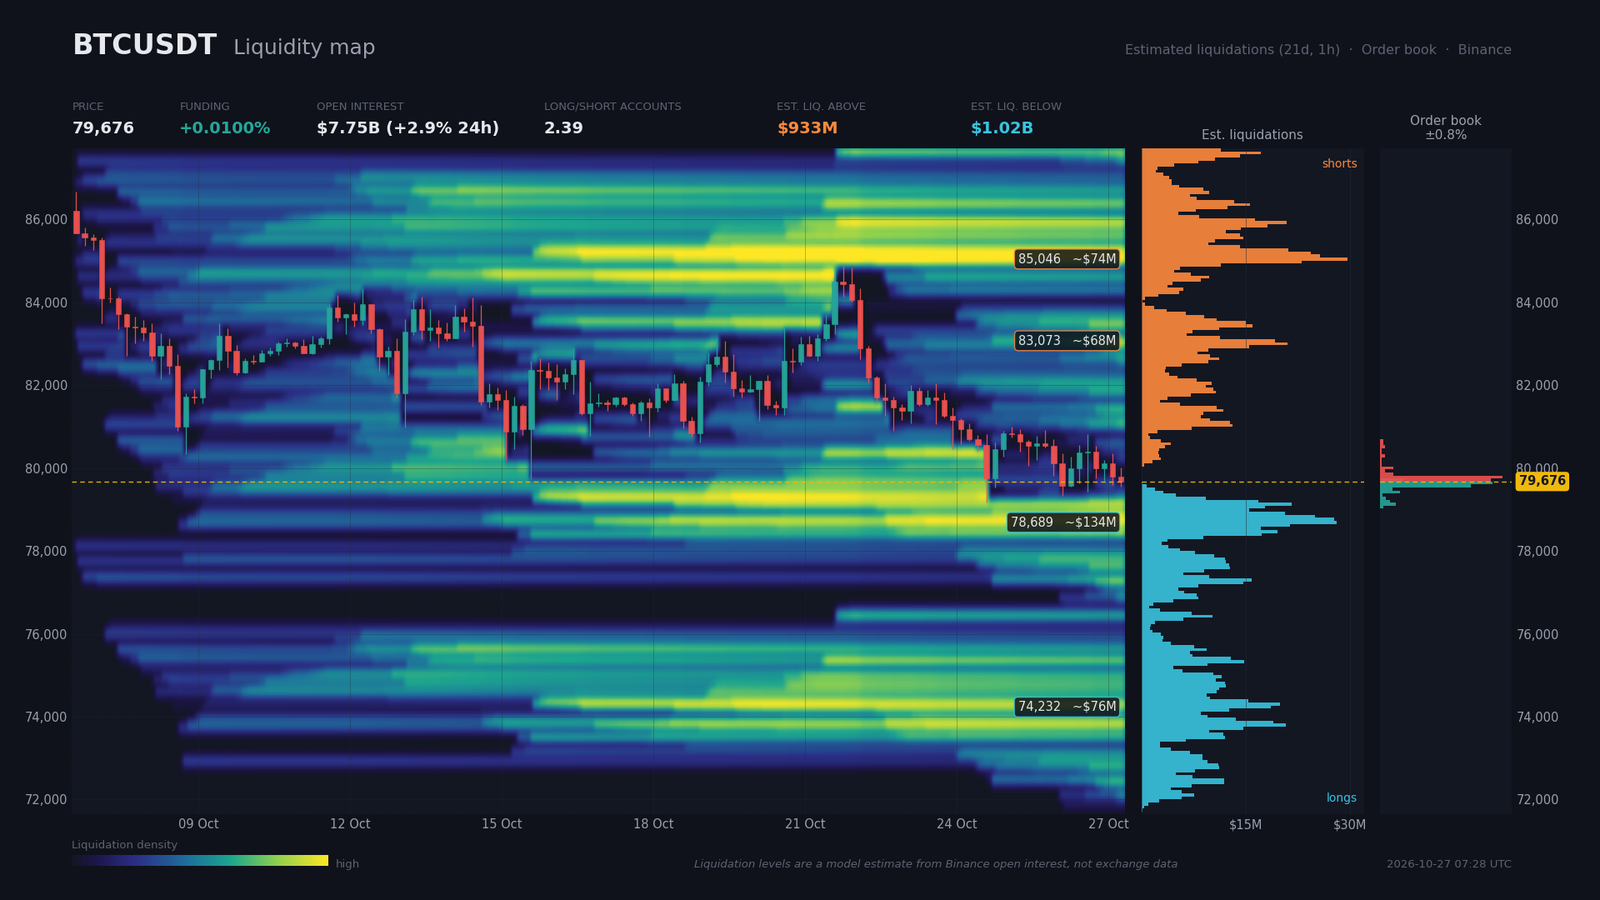
The order book covers only 0.83% around the price, so the read applies to that tight zone. On the sell side, $29.7M sits at $79,710 and $32.8M at $79,790; on the buy side, $30.1M rests at $79,640 and $24.2M at $79,570. Beyond these levels, liquidity is thin ($5.2M at $79,420, $4.1M at $79,130). A 1.3% imbalance in favor of bids is negligible, and the symmetry of the orders is consistent with the M15 compression.
Liquidation pockets, estimated by model rather than measured, are denser below the price: about $1.02B in total, including roughly $134M between $78,580 and $78,940, then about $76M between $74,120 and $74,410. Above the price, the estimated total reaches about $933M, with about $68M between $82,890 and $83,110 and about $74M between $84,940 and $85,080.
Funding at 0.01% (about 10.9% annualized) is neutral. Open interest stands at about $7.75B, up 2.9% over 24 hours. The long/short ratio of accounts is 2.39, that of large traders 1.95, and the taker buy/sell ratio 1.03. Rising open interest while price falls signals new positions opened on the downside, and such a long-heavy account positioning is vulnerable. A liquidity sweep of the lows near $79,200 becomes plausible, with the $78,600–$78,900 long pocket acting as a magnet. A squeeze toward $83,000 remains possible if the Fed sounds accommodative.
Calendar: Catalysts to Watch
Recent releases did little to move the price. The coming days, however, concentrate the high-impact events. Deribit options expiries and CME settlements are not included in the calendar extract available.
- Wed, Oct 28, 19:00 (Zurich) — FOMC statement and Fed rate (consensus 4%; previous 4%): the tone on inflation is the key issue. Santiment flags a possible rate hike before year-end.
- Thu, Oct 29, 13:30 (Zurich) — Core PCE m/m (consensus 0.5%; previous 0.3%) and advance GDP (3.2%; previous 2.2%): a PCE print above consensus would weigh on risk assets.
- Thu, Oct 29, 14:15 (Zurich) — ECB deposit rate expected at 2.5%, unchanged: a second-order effect on global liquidity.
- Fri, Oct 30, time not specified — Bank of Japan meeting: hold expected at 1.25%, with a hike prepared for December or January according to a CNBC survey.
Three Scenarios for the Coming Weeks
All three scenarios turn on the same pivot: the reaction to the Fed and to the PCE data. The probabilities are the analyst’s and total 100%.
Scenario A — Breakdown below $79,200 and long liquidation sweep (probability 50%)
The catalyst is the FOMC on October 28 at 19:00, followed by the PCE release on October 29. The trigger is an H4 close below $79,150. The path leads first to the estimated long pocket at $78,580–$78,950, then to the daily double-top objective at $77,680 and, if pressure persists, to the H4 head-and-shoulders objective at $76,920. The stop, above $81,600, sits about $1,000 from an entry near $80,600, more than one H4 average true range (ATR, about $750). The risk/reward ratio (R:R) is 1.9 toward $78,690 and about 2.9 toward $77,680. Execution zone: rebound toward $80,400–$80,900 (R1), or a confirmed break of $79,150. Invalidation: H4 close above $81,600, the H4 SMA50 and the H4 double-bottom neckline.
Scenario B — Bearish false break then squeeze toward $82,700 (probability 30%)
The catalyst is an FOMC read as accommodative, or a softer tone than expected. The trigger combines a bullish breakout from the M15 wedge above $80,040, then an H4 close above $81,000, the H4 double-bottom neckline. The path leads to $82,280–$82,750 (H4 objective at $82,750), with the estimated short pocket near $83,000 as the likely limit. R:R is about 2.1. Execution zone: $81,000–$81,100 after a close. Invalidation: return below $80,250 on an H4 close, about 1.06 ATR.
Scenario C — Invalidation: sustained reclaim of the $82,500 zone (probability 20%)
The catalyst is a PCE print below consensus, with ETF flows turning. The trigger is a daily close above $82,500, which would cancel the double top. The path targets $84,340 (daily double-bottom neckline), then $85,000 and the theoretical $88,640 objective, an unconfirmed hypothesis. Execution zone: retest of $82,300–$82,500. Invalidation: daily close back below $80,400.
Synthesis and Conclusion
The phase is a consolidation with a distributive tilt: accumulation by large holders runs into ETF outflows and a Fed-dominated macro backdrop. The bias is bearish, with medium conviction and a confluence score of 3 out of 5. The confirmed patterns weigh on price, but the daily SuperTrend and the SMA200 (about $73,000) still hold, so a trend reversal cannot yet be claimed. The regulatory backdrop, from Canada’s stablecoin consultation to Ripple’s OCC approval and South Korea’s possible fourth delay of its 22% crypto tax, only partly offsets the signal.
The dominant technical strategy is to favor selling rallies below $81,000 or a confirmed break of $79,150, with protection above $81,600 on an H4 close. Reducing exposure before the October 28 FOMC fits the M15 compression, whose apex is expected right after. Critical levels: $79,150–$79,550, $78,580–$78,950, $80,400–$81,000, $82,300–$82,500 and $76,900–$77,700. This is technical analysis, not investment advice, and it should be updated after each H4 close and each release.
Sources
- StoneX lifts Strive price target 34% as new stock offering bolsters bitcoin strategy — The Block, Oct 27, 2026
- Bitcoin Price Hovers Near $80,000 as Traders Await Fed Decision — Bitcoin Magazine, Oct 26, 2026
- Strategy (MSTR) Pauses Bitcoin Buying and Spends $205 Million on Preferred Stock — Bitcoin Magazine, Oct 26, 2026
- Bitcoin’s Bear Market Is Over, Galaxy Says — Bitcoin Magazine, Oct 26, 2026
- Coinbase Institutional Co-CEO: Bitcoin’s “Second Wave” of Institutional Capital has Arrived — Bitcoin Magazine, Oct 26, 2026
- Bank of Japan is expected to hold rates this week — but stay hawkish: CNBC survey — CNBC, Oct 27, 2026
- Bitcoin ETFs bleed nearly $500 million in one day: Crypto Daily — CoinDesk, Oct 8, 2026
- Minutes of the FOMC, September 15-16, 2026 — federalreserve.gov, Oct 7, 2026
- Bitcoin Whale Wallets Reach Record 20,338 as Large Holders Defy October Slide — BigGo Finance, Oct 16, 2026
- Canada opens consultation on stablecoins, citing US GENIUS Act — Cointelegraph, Oct 26, 2026
- US OCC calls on community banks to become payment stablecoin issuers — Cointelegraph, Oct 26, 2026
- Ripple gains final OCC approval to launch national trust bank and bring RLUSD under federal oversight — The Block, Oct 27, 2026
- South Korea Weighs Fourth Delay of Crypto Tax, With 2029 Start Tied to U.S. Data Sharing — Bitcoin Magazine, Oct 26, 2026
Disclaimer: This article is for educational and informational purposes only. It does not constitute investment advice, a recommendation to buy or sell, or an invitation to trade any financial asset. Cryptocurrency markets are extremely volatile; any investment decision should be based on your own research (DYOR) and, where appropriate, the advice of a licensed financial adviser.

