


Bitcoin trades at $80,600, 7.8% below the period high of $87,385 set on September 21. After a flush of long positions, price retested the $79,200 area on October 24 on an intraday low, in a correction phase that still sits inside a broader uptrend.
Derivatives are the immediate engine. According to CoinGlass (The Block, October 24), longs lost $404M out of $436M liquidated in four hours, pushing 24-hour liquidations to $815M, while futures open interest fell 2.2% to $140.1B. US spot ETFs recorded $773M of outflows on Thursday and Friday (SoSoValue, via The Block), after three sessions of inflows totaling $1.07B. Arthur Hayes said he has “sold everything” from his directional book (The Block, October 24).
Macro adds pressure. Fears of US strikes on Iran pushed WTI above $102 and Brent to $116, the highest since mid-March (Cointelegraph, October 23); that day, bitcoin tested $80,988 before slipping back under $81,000. The FOMC minutes from the September 15-16 meeting, published October 7, point to 2-10 year yields up roughly 35 basis points. Among recent releases, China’s GDP printed 4.5% (consensus 4.4%), UK unemployment came in at 4.7% (consensus 4.9%) and US housing starts fell 5.2% m/m (consensus +1.3%), with no documented price reaction. Traders expect Chair Warsh to give a clear framework on “the pace of rate hikes” (MarketWatch, October 24).
The regulatory backdrop offers no immediate catalyst. The SEC published its 2027 examination priorities (Decrypt, October 23) and its “Regulation Crypto Assets” proposal, with offering exemptions of $5M and $75M (SEC.gov, October 20). Franklin Templeton expects its “DRIP bitcoin” ETFs to take effect on October 27 (Bitcoin Magazine, October 23). None of this offsets the bearish setup: ETF outflows, oil and high yields dominate, and institutional demand does not yet validate a rebound.
Multi-Timeframe Technical Analysis
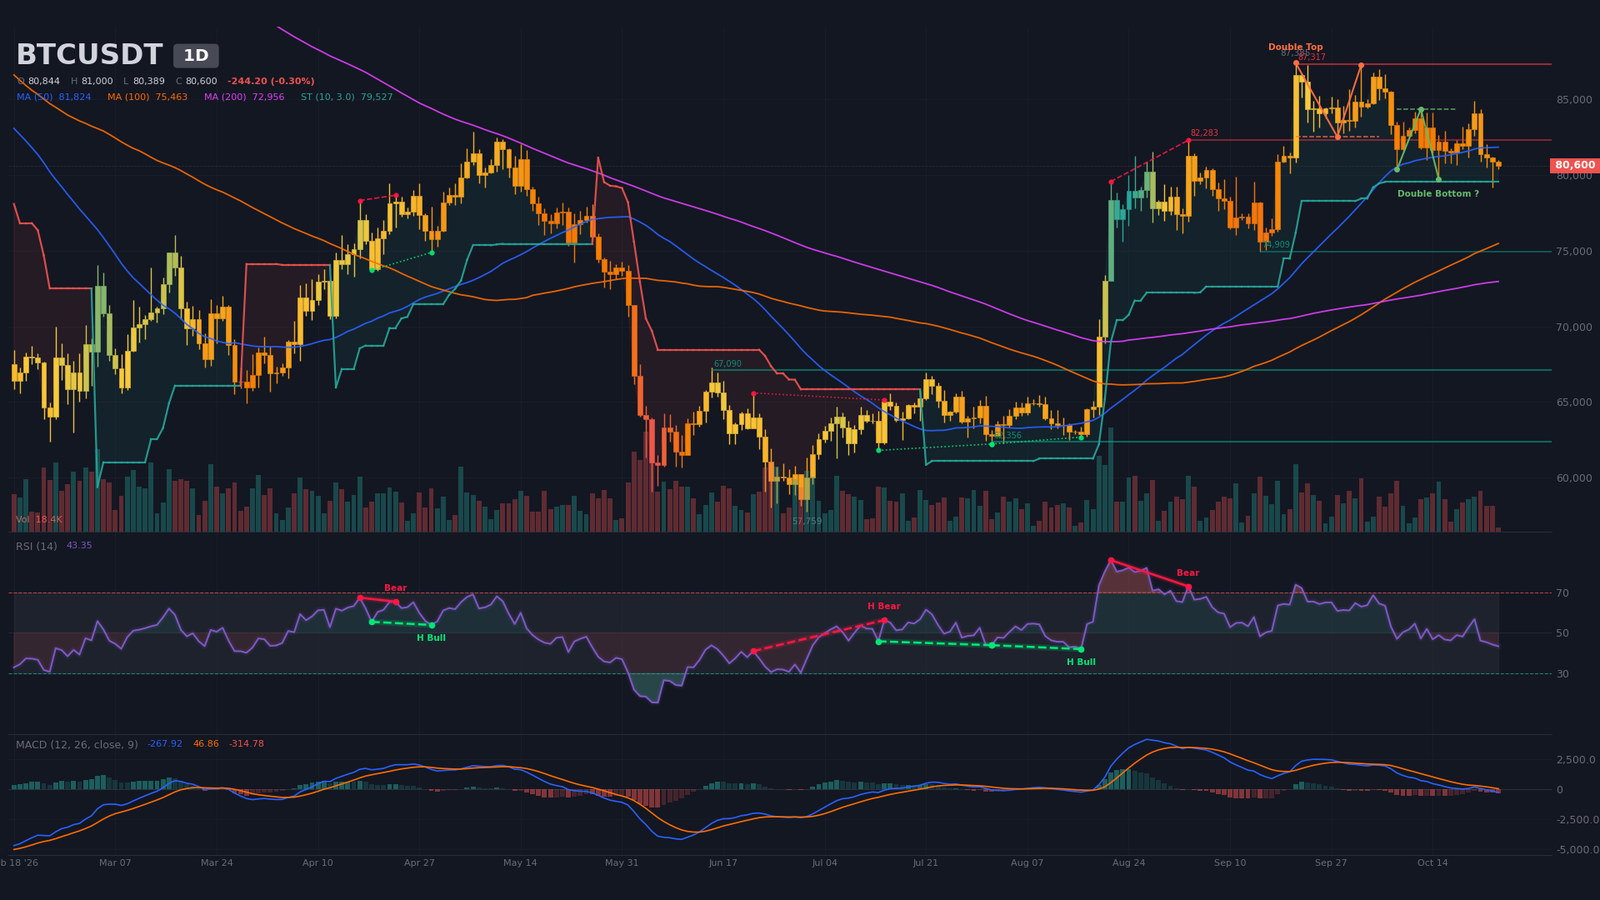
Daily Timeframe (1D): confirmed double top under resistance
The long-term trend remains bullish, with price above the 200-day SMA (near $72,960) and a bullish 50/200 crossover since September 8. The phase, however, is distributive: peaks keep stepping lower, from $87,385 (September 21) to $84,880 (October 21). Price sits below the 20-day SMA (≈ $82,330) and 50-day SMA (≈ $81,820), which form dynamic resistance near $82,000. The SuperTrend remains bullish, with a level near $79,530.
The double top is confirmed, with a neckline at $82,500 and a target at $77,680. A bullish double bottom (neckline $84,340, target $88,640) remains unconfirmed. RSI at ~43 is neutral and not oversold, after a regular bearish divergence flagged between August 21 and September 3. MACD has sat below its signal line and zero since the bearish crossover of September 29, with a negative histogram expanding. Volume on the current candle, at 14% of its 20-period average, is not readable yet, and the 14-period ATR of $2,050 (about 2.5%) sets the daily noise.
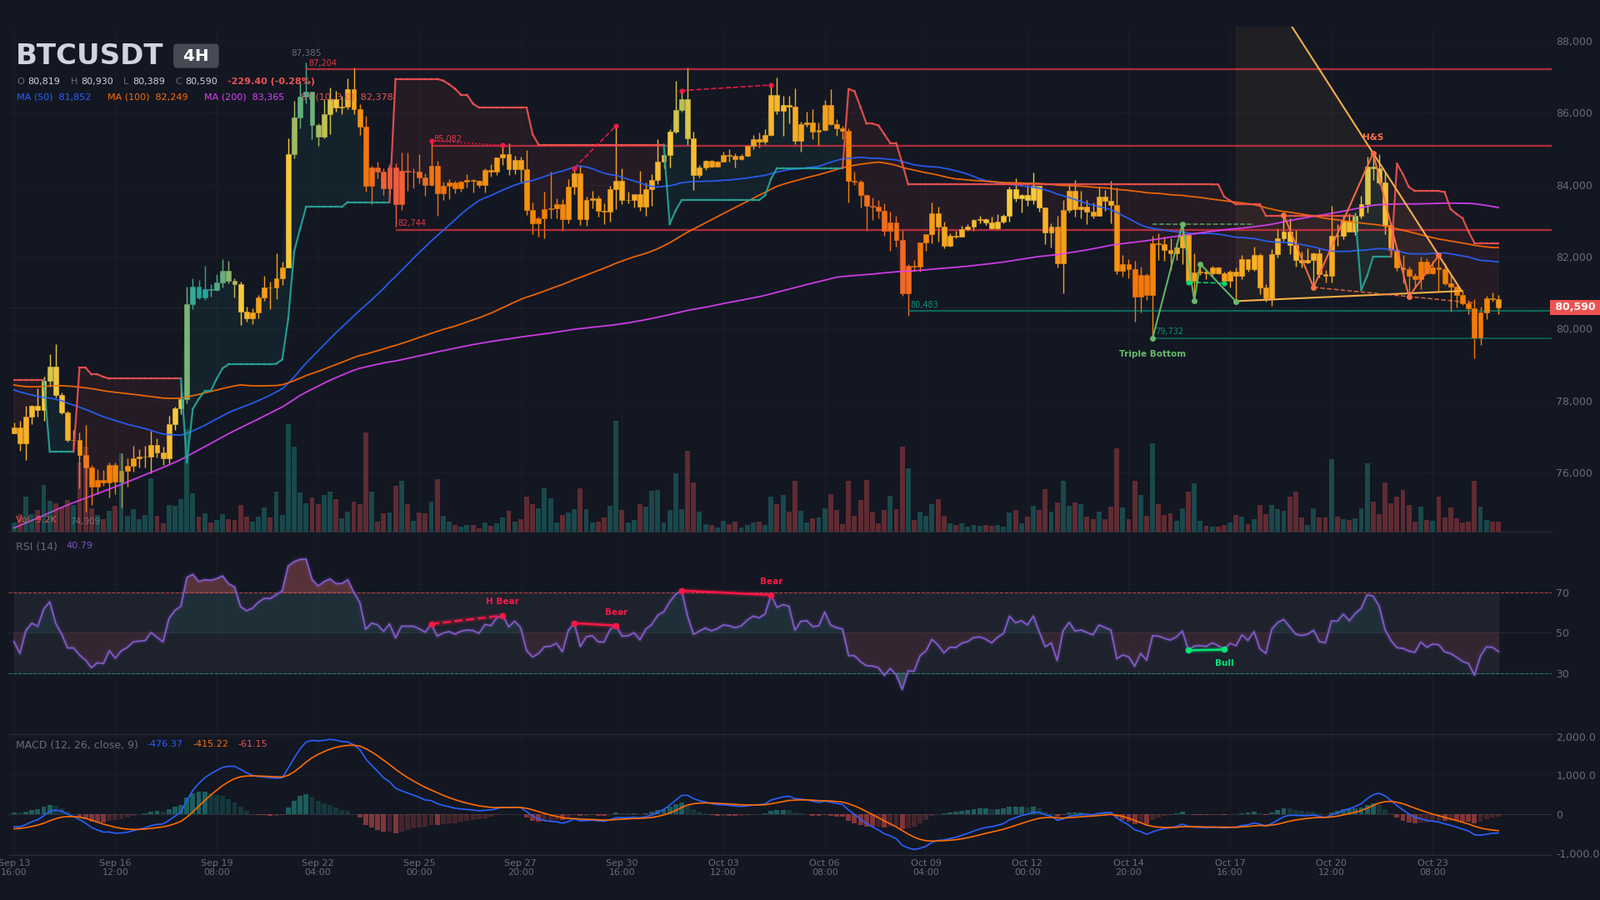
Intermediate Dynamics (4H): head and shoulders confirmed below neckline
The 4H is clearly bearish: price trades below the 20-period SMA (≈ $81,260), 50-period SMA (≈ $81,850) and 200-period SMA (≈ $83,360), and the SuperTrend sits at $82,380. A head and shoulders is confirmed, with a neckline at $80,890 and a target at $76,920. The descending triangle of October 17 broke to the downside, with a wick to $79,180 on October 24. A bullish triple bottom (neckline $82,900) is also flagged, but price remains below that line, which weakens it.
RSI touched 29 at $79,180 before recovering to ~41, and a regular bullish divergence from October 16-17 is noted. MACD, below its signal and zero since October 22, carries a slightly negative histogram that is contracting. Volume runs at 43% of its average. Support sits at $80,480 (two touches) and then $79,730; resistance at $82,740 and $85,080, with three touches each.
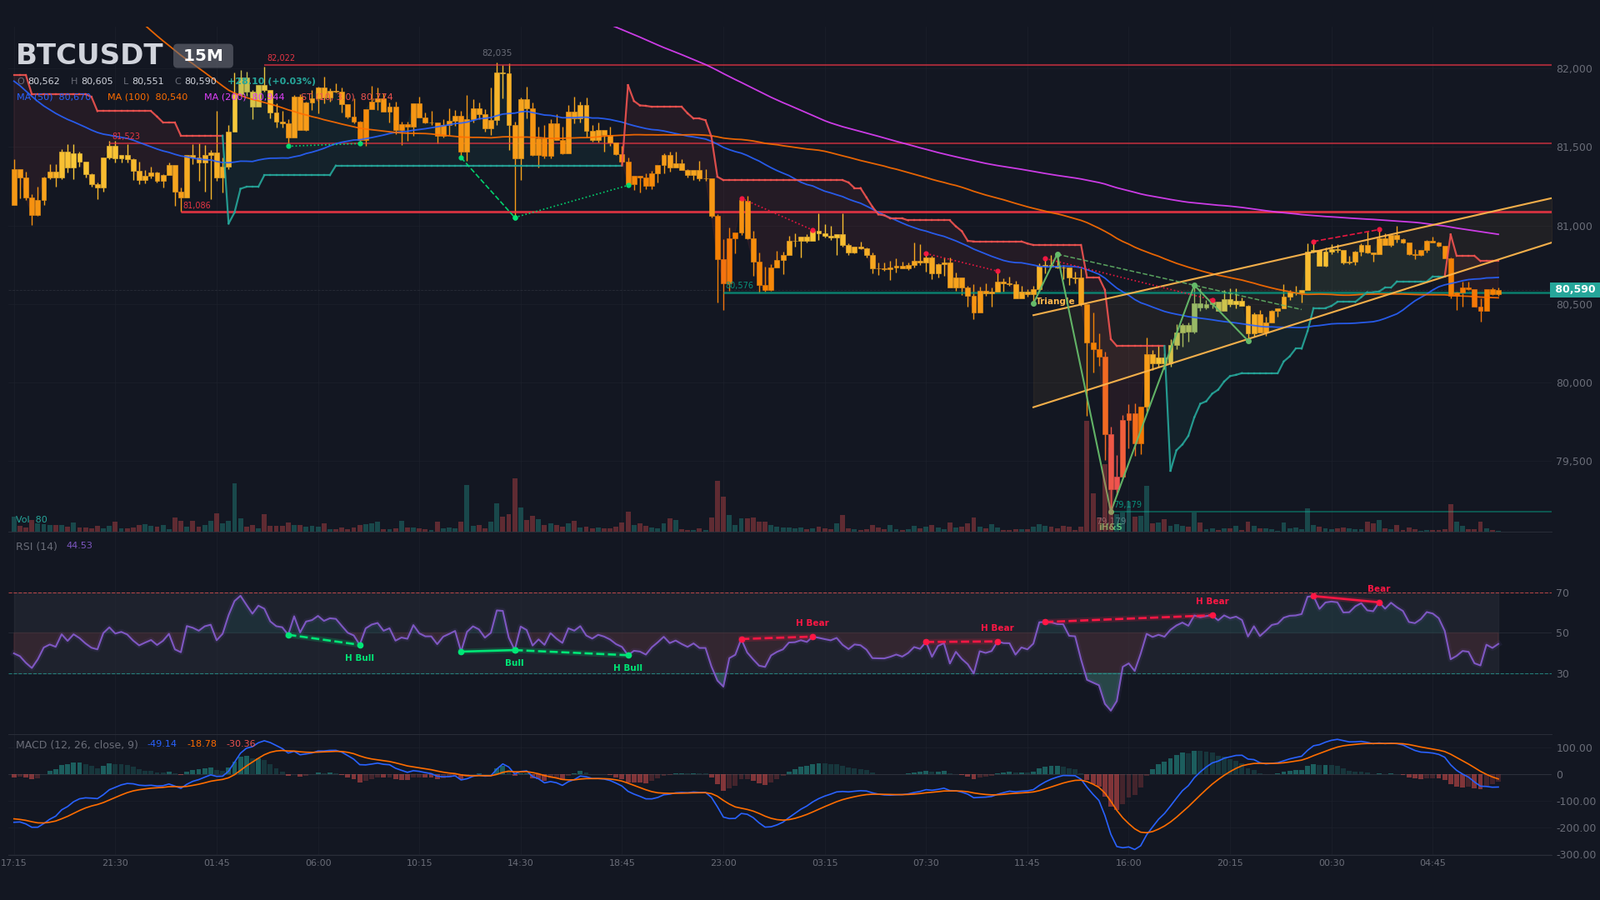
Intraday Structure (15m): compression wedge under resistance
The wedge opened on October 24 at 12:00 has boundaries at $81,000 (upper) and $80,650 (lower). Price, at $80,590, has just broken the lower boundary, with an apex estimated near October 26 at 06:00. An inverse head and shoulders (neckline $80,620, target $82,100) is confirmed, but price has slipped back below it. The SuperTrend is bearish at $80,770, and MACD crossed down on October 25 at 03:15. A regular bearish divergence runs from October 24 at 23:45 to October 25 at 02:30.
This structure contradicts the bearish patterns on higher timeframes. RSI is at ~45, volume at 13% of its average, and the intraday low sits at $80,390 (October 25, 06:45). Boundaries: support at $80,580 (four touches), then $79,180; resistance at $81,090 (five touches), $81,520 and $82,020. ATR14: about $99.
Multi-Timeframe Synthesis
| Timeframe | Dominant trend | RSI (14) | MACD | Chart pattern |
|---|---|---|---|---|
| Daily (1D) | Bullish long-term, correction below 20 and 50 SMA | ~43 | Bearish crossover on September 29, histogram expanding | Confirmed double top (target $77,680) |
| 4 hours (4H) | Bearish | ~41 | Bearish crossover on October 22, histogram contracting | Confirmed head and shoulders (target $76,920) |
| 15 minutes (15m) | Bearish, compressing | ~45 | Bearish crossover on October 25 at 03:15 | Wedge broken to the downside; inverse head and shoulders contradicts |
Level Mapping: Technical Levels and Pivots
The map combines classic daily pivots, detected swings, order book walls and estimated liquidation pockets. The short-term central pivot sits between $80,400 and $80,900, where the 4H neckline, the daily pivot and the order book walls converge.
| Level | Price (USD) | Category | Technical basis |
|---|---|---|---|
| Major resistance 3 (R3) | $84,900 – $85,300 | Liquidity / resistance | Estimated short pocket ($145M) and 4H resistance at $85,080 |
| Major resistance 2 (R2) | $82,400 – $82,900 | Resistance | Daily double top neckline ($82,500), 4H resistance at $82,740, 4H triple bottom neckline ($82,900) |
| Immediate resistance (R1) | $81,000 – $81,650 | Resistance | 15m resistance at $81,086 (5 touches), daily R1 at $81,630 |
| Central pivot (P) | $80,400 – $80,900 | Pivot | Daily pivot $80,404, 4H neckline $80,889, 4H support $80,483, order book walls $80,490 – $80,690 |
| Immediate support (S1) | $79,500 – $79,750 | Support | Daily S1 $79,618, October 15 low ($79,732), daily SuperTrend $79,527 |
| Major support 2 (S2) | $78,400 – $78,900 | Support / liquidity | Daily S2 $78,392, estimated long pocket $78,585 – $78,919 ($109.7M) |
| Major support 3 (S3) | $76,900 – $77,700 | Pattern targets | 4H target $76,919, daily double top target $77,683 |
Order Book and Liquidity Heatmap
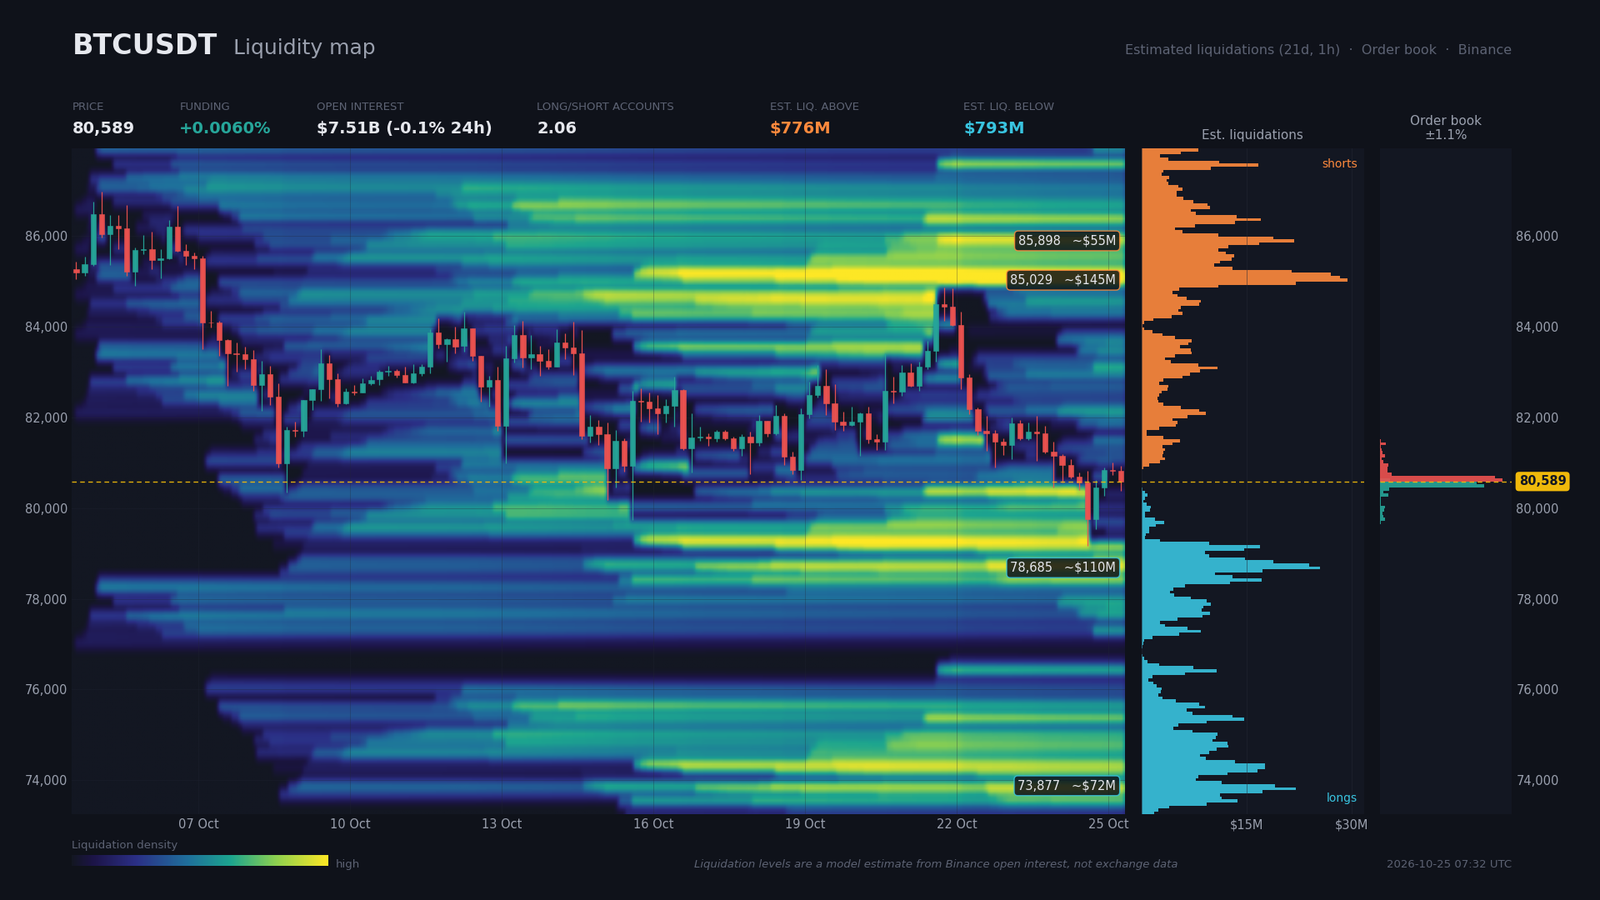
The order book covers only 1.1% around price, so the information is very local. Sell walls sit at $80,622 ($31.3M) and $80,689 ($29.4M), against buy walls at $80,555 ($24.8M) and $80,488 ($26.6M). Within 2%, bids total $64.0M against $73.8M of asks, a 7.1% imbalance in favor of sellers that points to an immediate ceiling between $80,620 and $80,690.
The liquidation zones are model estimates, not measured data. Above, shorts are estimated between $84,930 and $85,260 (peak at $85,030, $145M), then between $85,860 and $86,470. Below, longs are estimated between $79,050 and $79,190 ($44.8M), $78,590 and $78,920 ($109.7M), then $73,710 and $73,910 ($71.7M). Estimated totals are $776M above and $793M below. Funding at 0.006% (6.6% annualized) is neutral to slightly positive, open interest stands at $7.51B, the account long/short ratio at 2.07 and the top-trader ratio at 1.66.
Positioning remains mostly long, with aggressive flow slightly sell-side (taker buy/sell of 0.95). The risk of a liquidity sweep toward $78,600 – $79,200 is therefore closer and denser than the $85,000 upside pocket, where a squeeze would first require reclaiming $82,900.
Calendar: Catalysts to Watch
The October 28 FOMC is the event most likely to pull price out of its structure, with the October 29 PCE data taking over. The calendar lists no Deribit expiry or CME settlement in our sources.
- Tuesday, October 27, 13:30 (Zurich) — core durable goods (consensus 0.6%, previous 0.3%): expected effect of Franklin Templeton ETF flows.
- Wednesday, October 28, 19:00 (Zurich) — Fed rate decision, press conference at 19:30 (consensus and previous both shown at 4): a hawkish surprise or a harsh tone would weigh on price.
- Thursday, October 29, 13:30 (Zurich) — advance GDP q/q (consensus 3.2%, previous 2.2%) and core PCE m/m (consensus 0.3%, previous shown at 3.4%, to be verified): the Fed’s macro follow-through.
Three Scenarios for the Coming Weeks
The probabilities below come from the analyst’s assessment and total 100%. The October 28 Fed decision is the pivot for all three paths.
Scenario A — Bearish continuation toward the long liquidation pocket (probability 45%)
The trigger is a 4H close below $79,700 after rejection of the $80,890 neckline, ideally in the wake of the Fed decision. The path leads to $79,180 (October 24 low), then $78,700 (peak of the estimated long pocket), $77,680 (double top target) and $76,920 (4H head and shoulders target). Execution zone: sell into a rebound between $80,900 and $81,100, below the 4H neckline and the 15m resistance at $81,086. Invalidation: 4H close above $82,050, a stop of about $1,100, above the 4H ATR of $750, for a $2,250 gain toward $78,700 and an R:R of about 2.
Scenario B — Range, bullish sweep then rejection (probability 35%)
The trigger is a 15m close above $81,090. Price could then aim for $82,100 (inverse head and shoulders target on the 15m), then $82,740 (4H resistance with three touches), where rejection is likely between $82,500 and $82,900, before a return toward $80,400 – $81,100. Durable goods on October 27 and the Fed on October 28 are the catalysts for this oscillation. Execution zone: buy the retest of $81,090. Invalidation: 15m close below $80,300, under the $80,389 low and more than one 15m ATR ($99) away.
Scenario C — Bullish invalidation (probability 20%)
The trigger is a 4H close above $82,900, the triple bottom neckline, with a clean break of the $82,280 – $82,740 zone. The path targets $85,080 (4H resistance and estimated short pocket), then $85,380 (triple bottom target), with $87,320 in case of acceleration, supported by an accommodative Fed or an easing in oil. Execution zone: retest of $82,700 – $82,900 from above. Invalidation: a 4H close back below $82,000.
Synthesis and Conclusion
Bitcoin is in a distributive correction below $87,000, inside a long-term uptrend that still holds. The daily double top and the 4H head and shoulders are confirmed, and the ETF outflows ($773M on Thursday and Friday) and the October 24 leverage flush point the same way, while high yields weigh on risk. On the other side, the absence of capitulation (daily RSI at ~43, thin volumes on this Sunday) leaves room for a range before the Fed. The 15m structure remains contradictory, which explains the medium conviction and a confluence score of 3/5. On-chain data and whale behavior are not available.
The dominant technical strategy is to favor selling rebounds below $81,000, with protection above $82,050 on the 4H. A close back above $82,900 would flip the reading. Critical levels: $82,900 (4H triple bottom neckline), $81,090 (15m resistance), $80,480 – $80,890 (4H support and head and shoulders neckline), $79,180 – $79,730 (October 24 low and S1), then $78,590 – $78,920 (estimated long pocket) and $77,680 (daily target).
Sources
- Crypto longs lose $404 million in four hours as bitcoin briefly slips below $80,000 — The Block, 24/10/2026
- Bitcoin ETFs Bleed $636 Million as October Turns Red Again — Decrypt, 23/10/2026
- Bitcoin seeks support above $81K as Brent crude oil hits highest level since March — Cointelegraph, 23/10/2026
- ‘Non-answers’ aren’t working. This is what investors really need from the Fed. — MarketWatch, 24/10/2026
- Minutes of the FOMC, September 15–16, 2026 — federalreserve.gov, 07/10/2026
- What next for France as riots rattle markets? — CNBC, 24/10/2026
- Turmoil hits AI build-out as neoclouds face pressure — CNBC, 24/10/2026
- Regulation Crypto Assets — SEC.gov, 20/10/2026
- SEC Flags AI ‘Super Intelligence’ and Tokenization as Systemic Market Risks — Decrypt, 23/10/2026
- Franklin Templeton Clears Final Hurdle For ETFs That Turn Stock Dividends Into Bitcoin — Bitcoin Magazine, 23/10/2026
- Blockstream Launches Institutional Consulting Services, Opens Lugano Office — Bitcoin Magazine, 23/10/2026
Disclaimer: This article is for educational and informational purposes only. It does not constitute investment advice, a recommendation to buy or sell, or an invitation to trade any financial asset. Cryptocurrency markets are extremely volatile; any investment decision should be based on your own research (DYOR) and, where appropriate, the advice of a licensed financial adviser.

